Week 6 - CHT Analysis on a Graphics card
Aim: Perform a CHT analysis on a graphic card.
Theory:
A Graphic card is an electronic hardware that is used for graphics processing in computers. It increases the video memory of the computer and makes it able to do graphics intensive work like simulations, gaming, video editing, etc. A graphic card is made of various smaller components mounted on a pcb board.
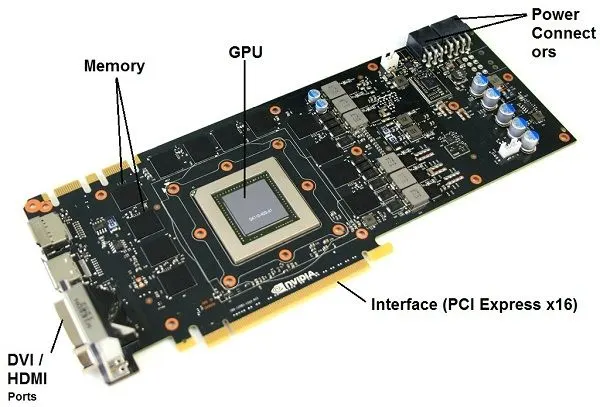
GPU: Graphics Processing Unit or commonly known as GPU is the heart of the Graphics Card. It is the main component of the graphics card where all the graphics processing takes place. It is made of semiconductor materials like silicon.
Memory: It is the place where all the complex textures and other graphics information are stored.
Internal Interface: The internal interface is the one through which your Graphics Card connects to your motherboard.
Heatsink and Fan: These form the cooling part of the graphics card, which are used to lower down the temperature of GPU and RAM (in some cards). Heatsink is a passive cooling device that is made up of copper or aluminum and its main purpose is to take the heat away from the GPU and dissipates it in the surroundings. Fan is an active cooling device that blows air onto the heatsink to make heatsink cool down faster so that it can draw away the heat quickly from the components.
Power Connectors: The power connectors are only present in mid to high range graphics cards because these cards need additional power for their operation.
DVI/HDMI: These form the external interface of the graphic card. They are used to connect your Monitor or LCD Screen to your Graphics Card by means of relevant cable.
As per our problem statement we are to simulate the heat dissipation from surfaces connected to processor, which is our source of heat generation.
Setup up the case:
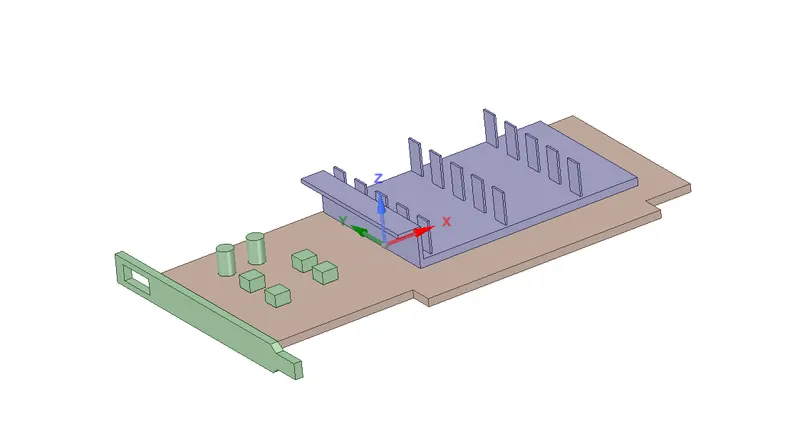
- Setting up geometry: Geometry is imported and common edges are shared for conformal meshing.
- Meshing
Going with default mesh with only face control to limit the cell count within the licensed use and low computational time. Also, faces important for the physics and meshing are named.
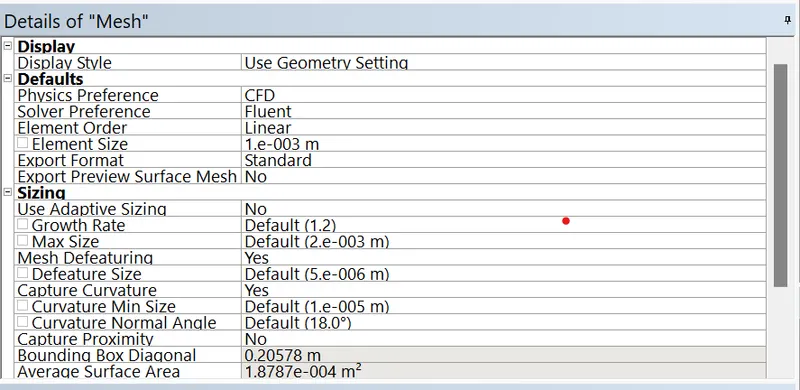
Further face sizing was done at the the fluid solid interface for finer mesh.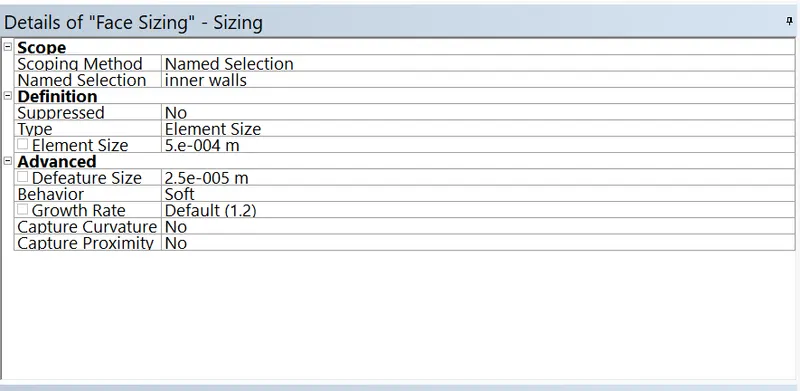
Following mesh was obtained for the given configuration: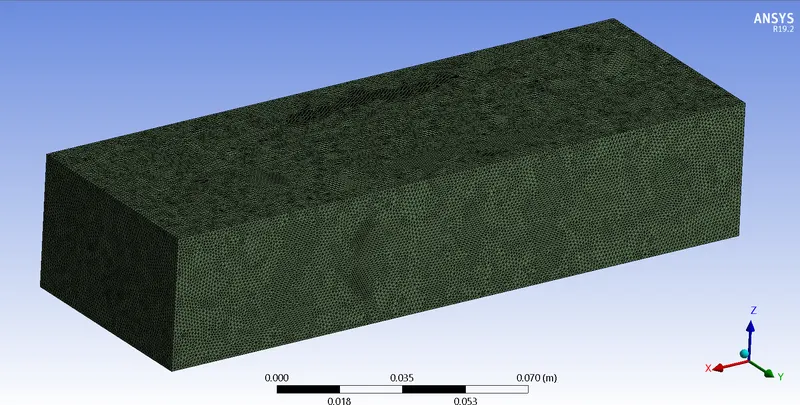
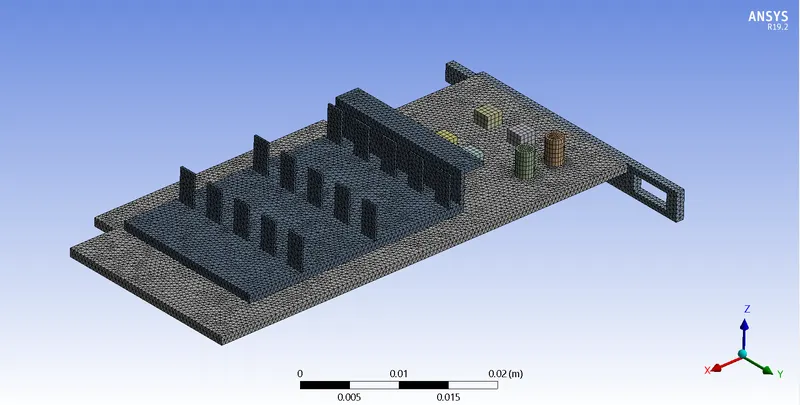
Mesh Metrics obtained were also satisfactory: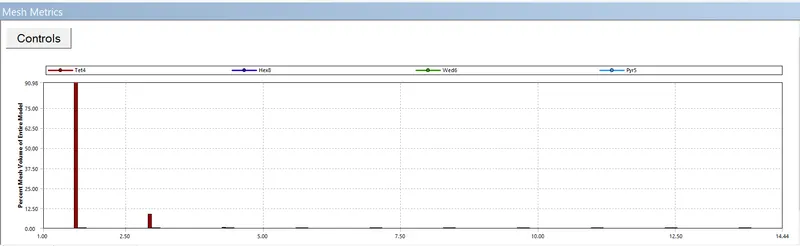
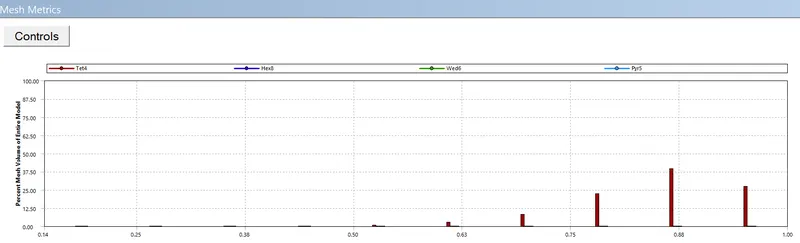
Aspect Ratio Mesh Quality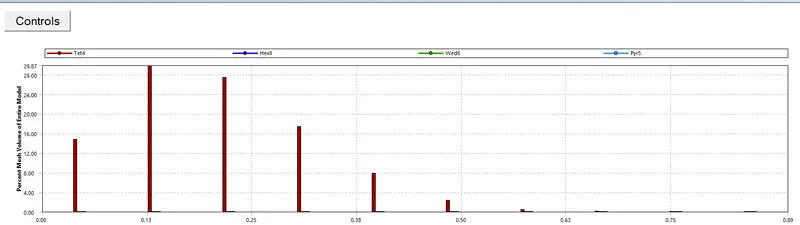
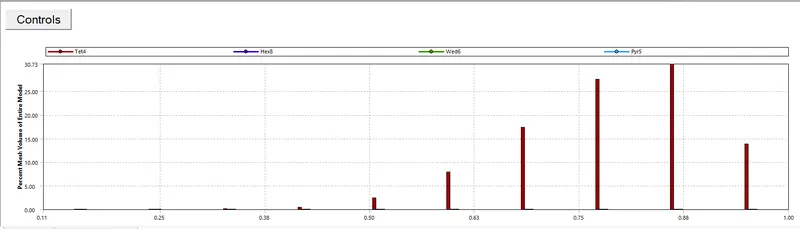
Skewness Orthogonality - Setup:
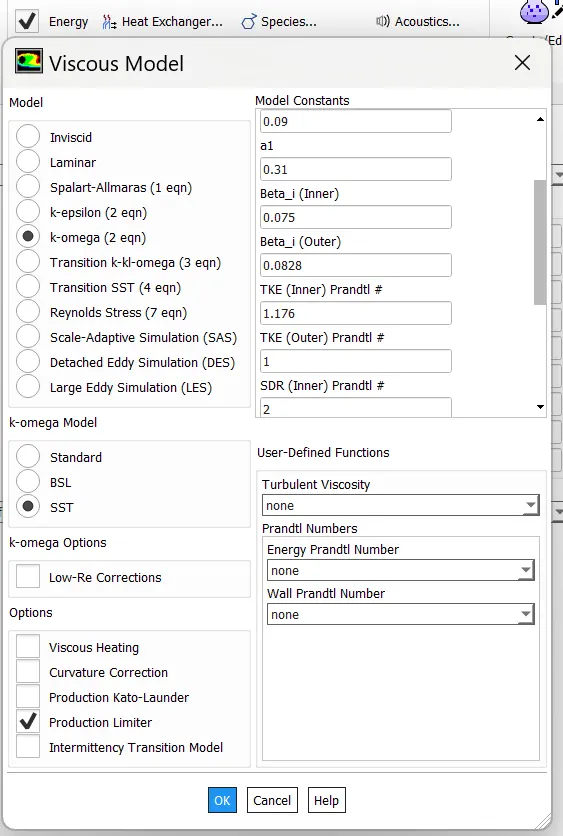
Pressure based steady state solver is used. The viscous model choosen for this probelm is k-omega SST as we are also solving for surface heat transfer coefficient, hence, a slover that captures near surface parameters accurately.
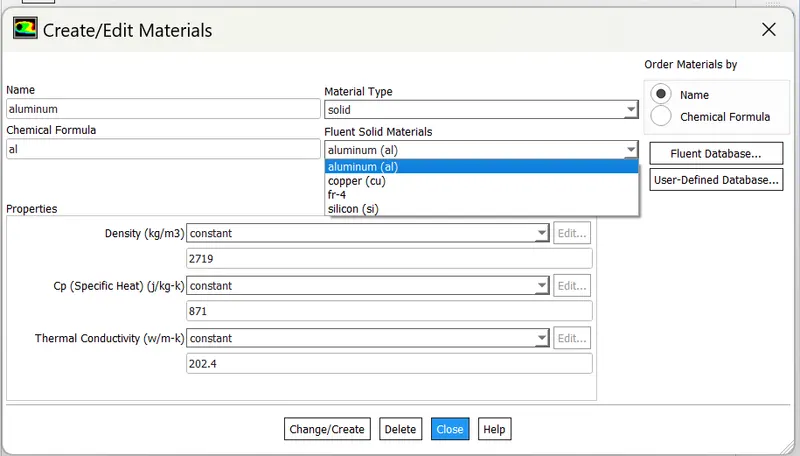
Materials are defined for solid and fluid domain. fluid domain is air. In solids since silicon is not present in fluent database we create a material with silicon name and its properties. For processore silicn is selected, for fins copper and for rest of the body fr-4 material is selected. Fr-4 is used for making PCB boards.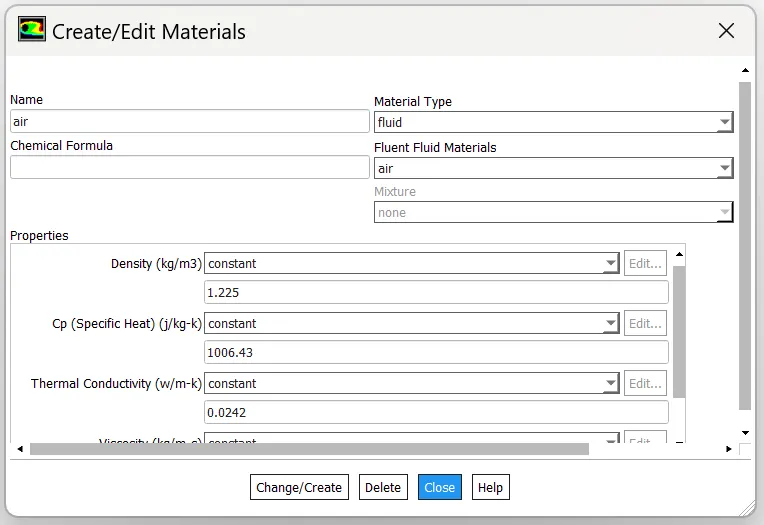
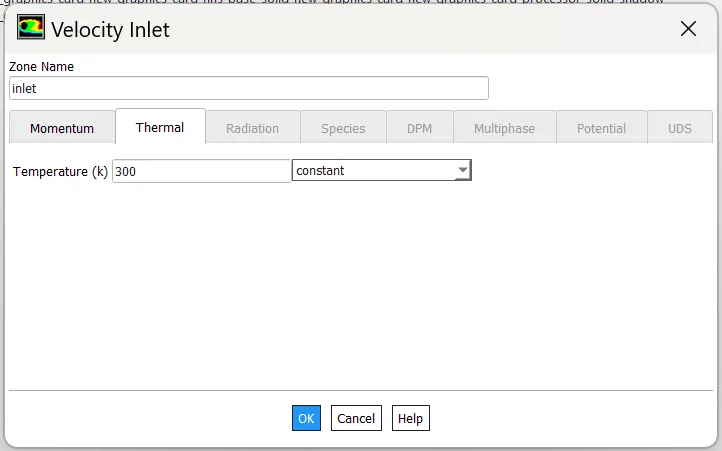
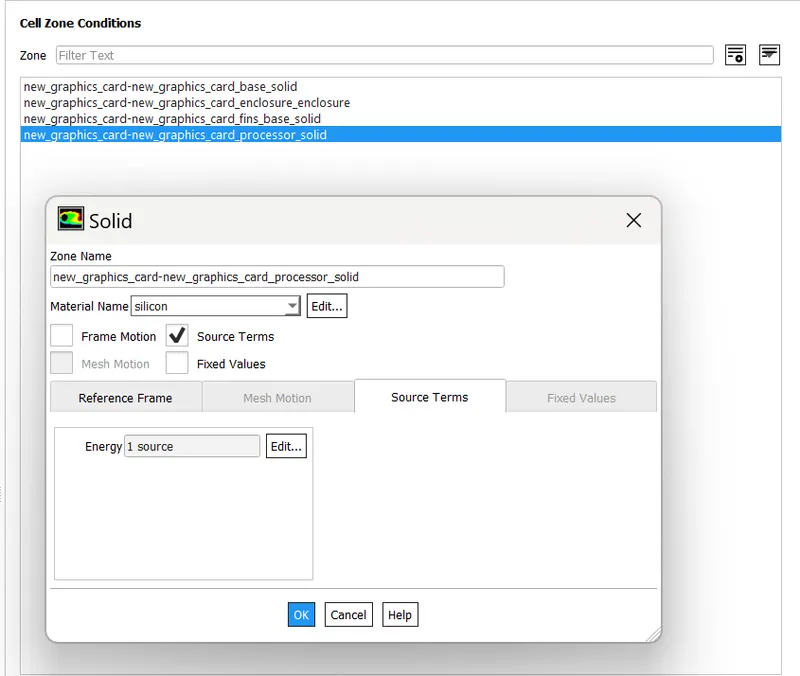
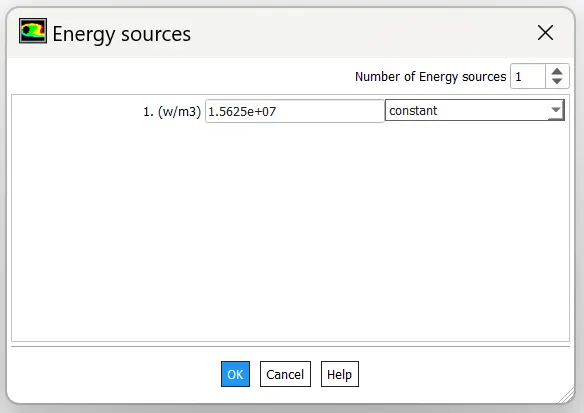
Boundary conditions are defined. inlet is given veocity boundary condition, outlet is given 0 gauge pressure and rest of the walls are given wall boundary condition. the processor however being a source, source term is enabled with 1 source and a value of1.5625 × 10 7
W/m3 is provided (equivalent to 1 W for the processor).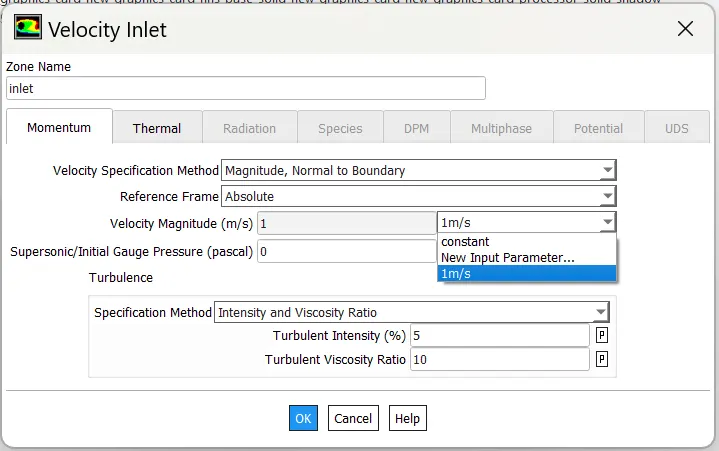
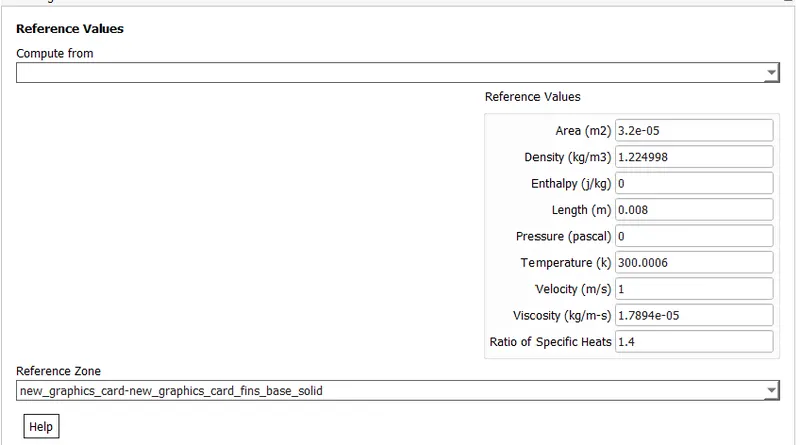
Reference values are provided from inlet conditions. Also the area in reference value will be the area of processor exposed to the air i.e: 4 rectangular faces with each being 1mm x 8 mm in size making area =
- . Lengh being the length of the processor in the flow direction i.e: 8 mm.
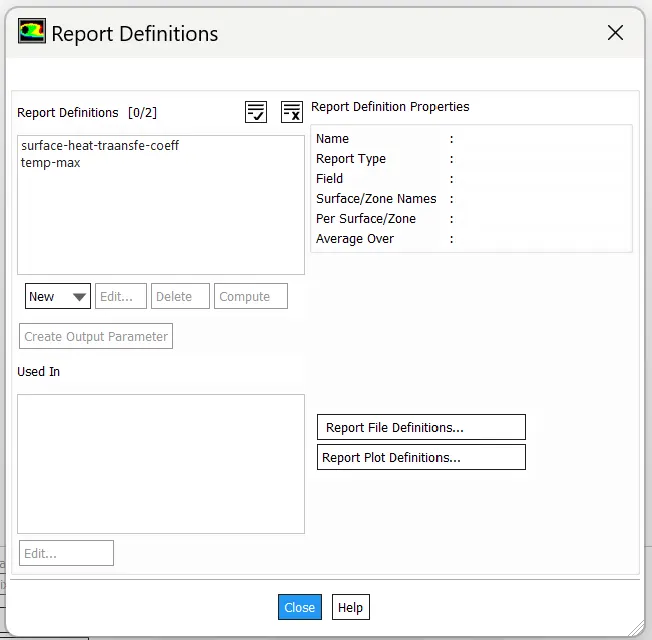
Hybrid initialization and report definitions are created for surface heat transfer coefficient and maximum temperature. Contour plots for temperature and velocity are created.
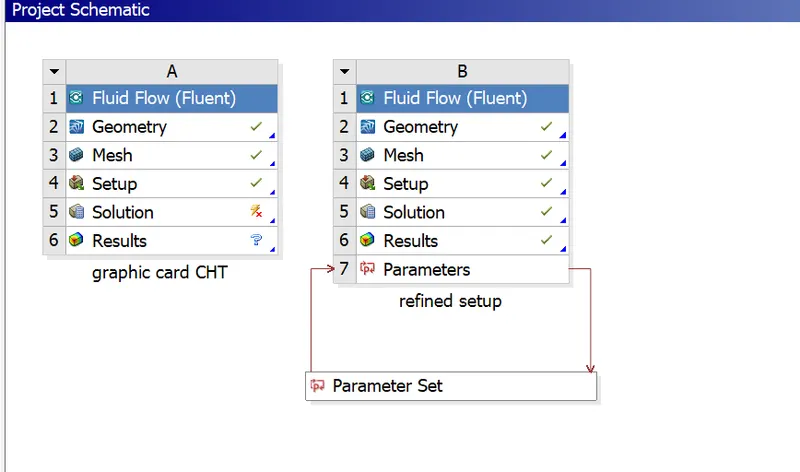
The surface heat transfer coefficient is selcted as an output parameter along with inlet velocity as an input parameter. It appears as parameter set on project schematic window. - Results:
The scaled residue plot shows that our results have converged.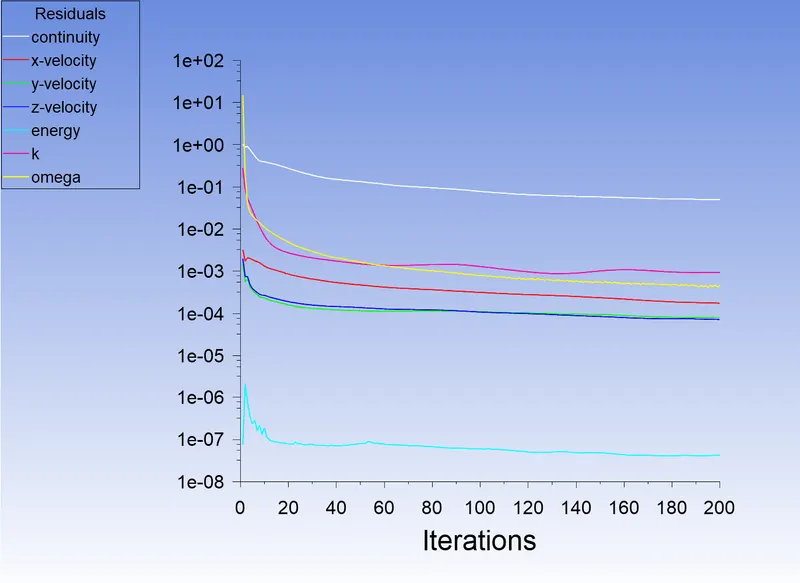
The results are opened in post processing section. Folowing plots were obtained-
Case1: 1m/s
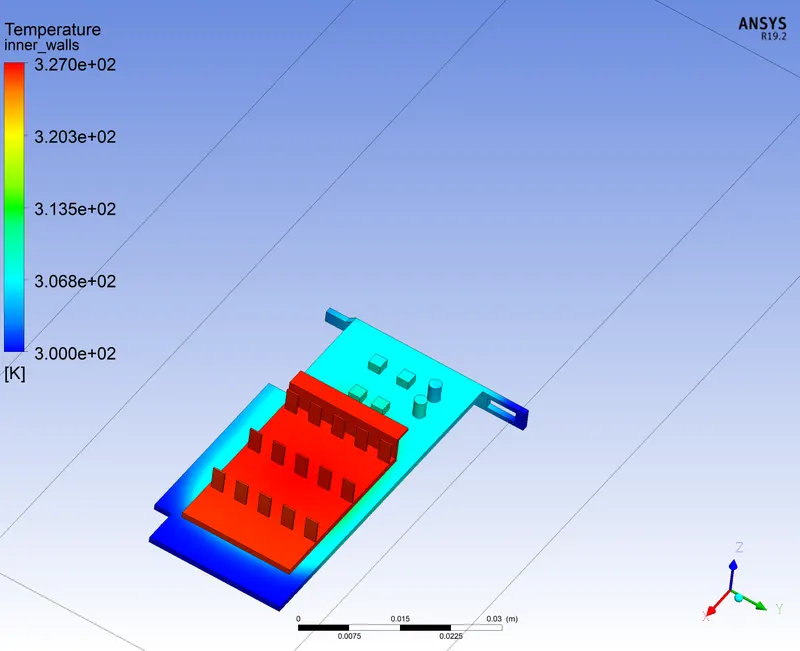
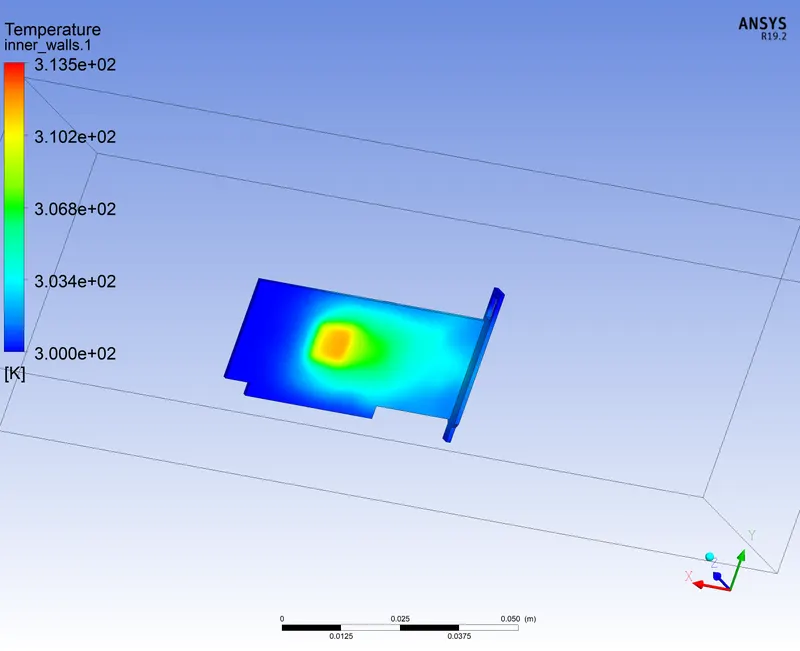
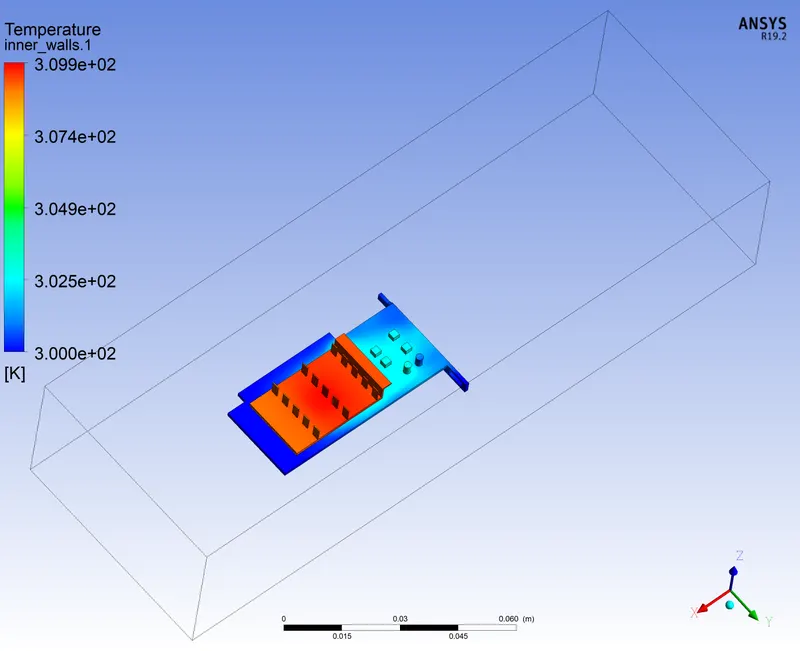
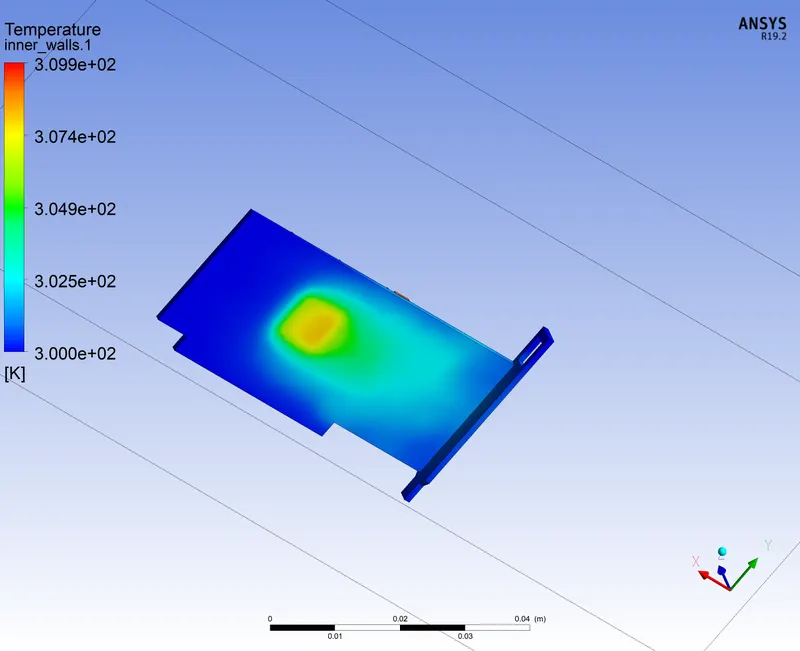
The temperature is maximum around the processor. The fins are also having high temperatures on global scale. When seen on local scale temperature distribution in fin surface is also noted.
The lowest temperatures are observed in fr-4 PCB base.
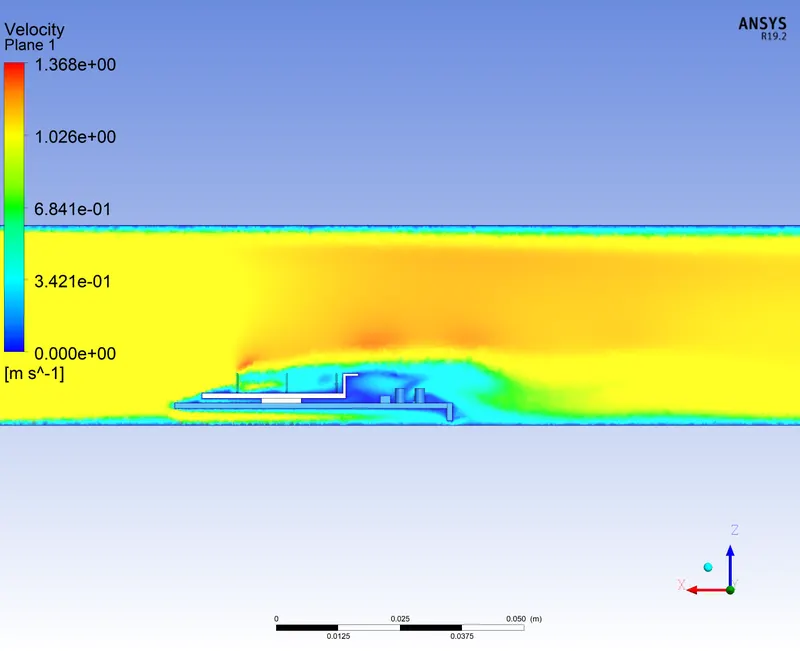
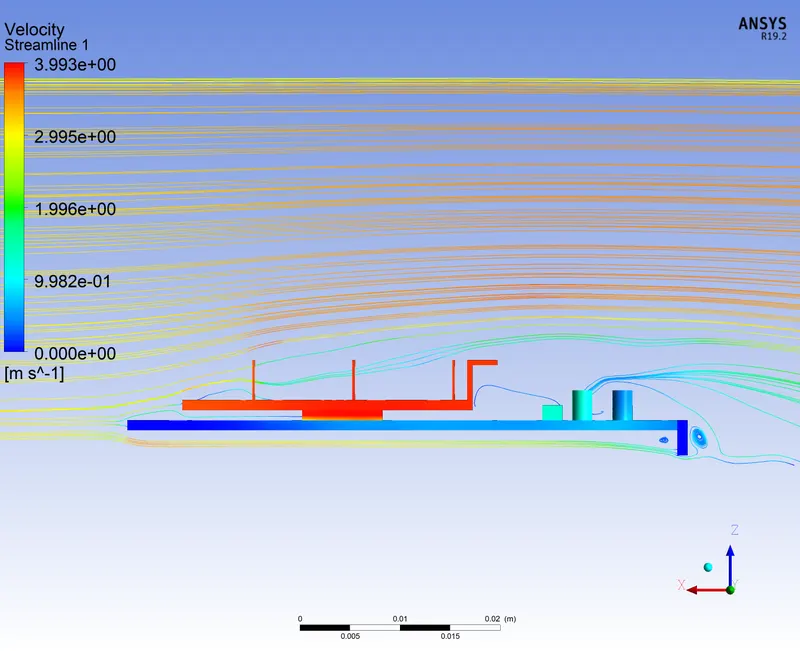
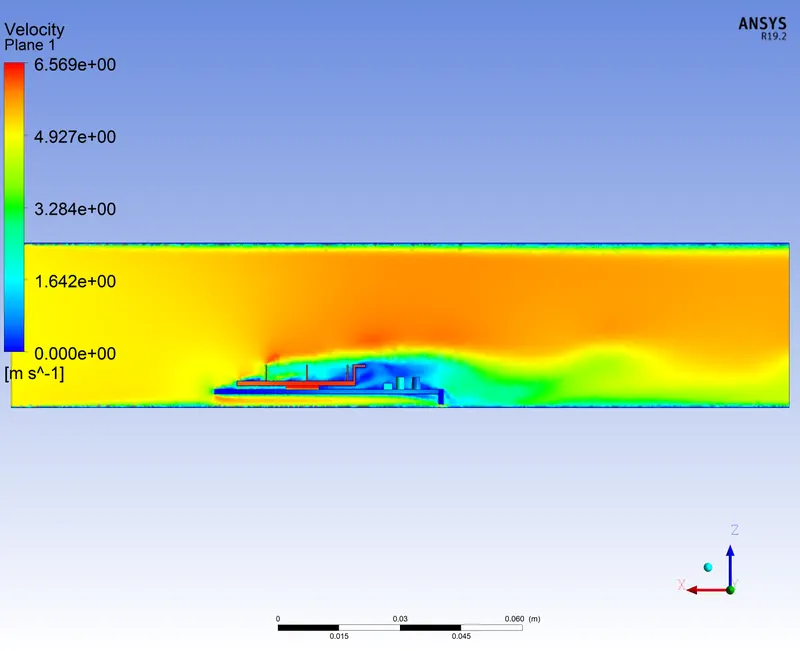
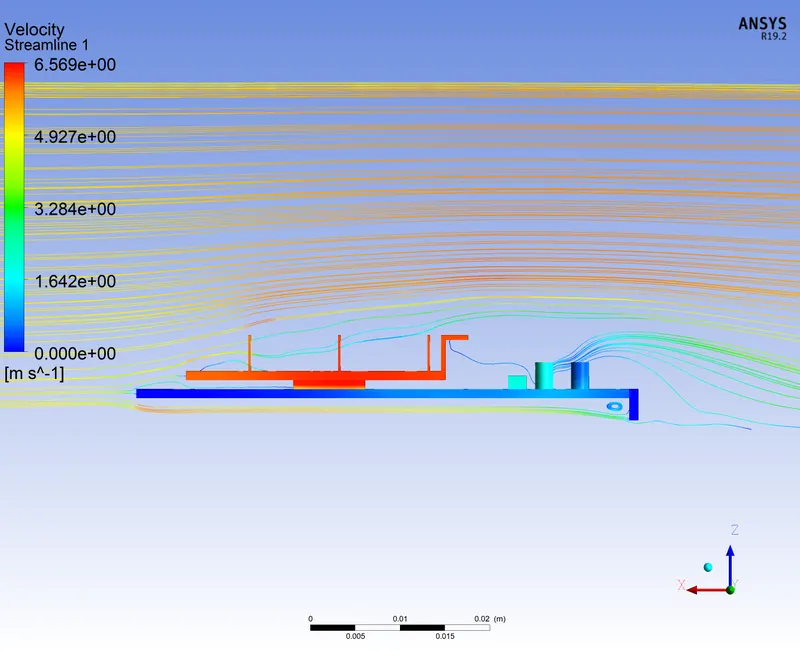
The velocity profile shows the flow breaks from the edge of first fin row leading to low velocity near succeeding fin rows.
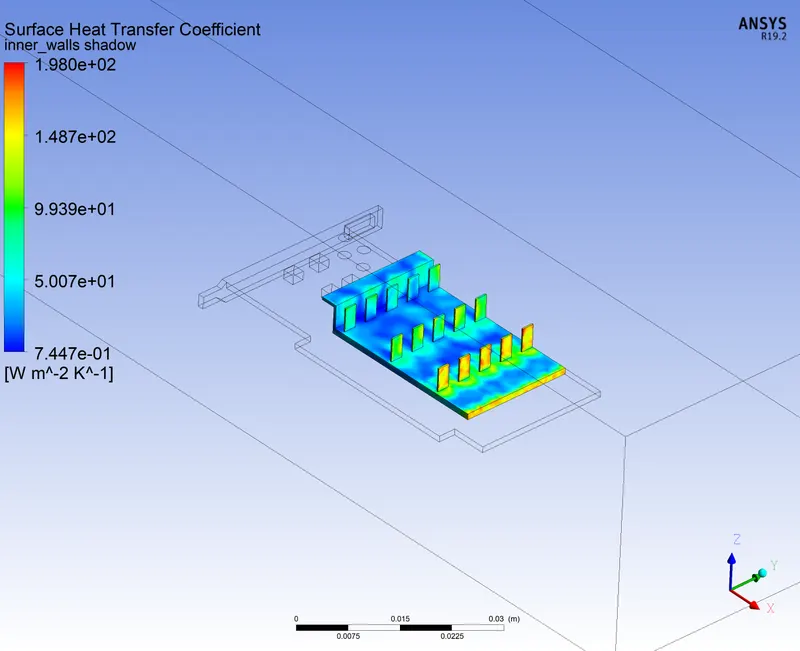
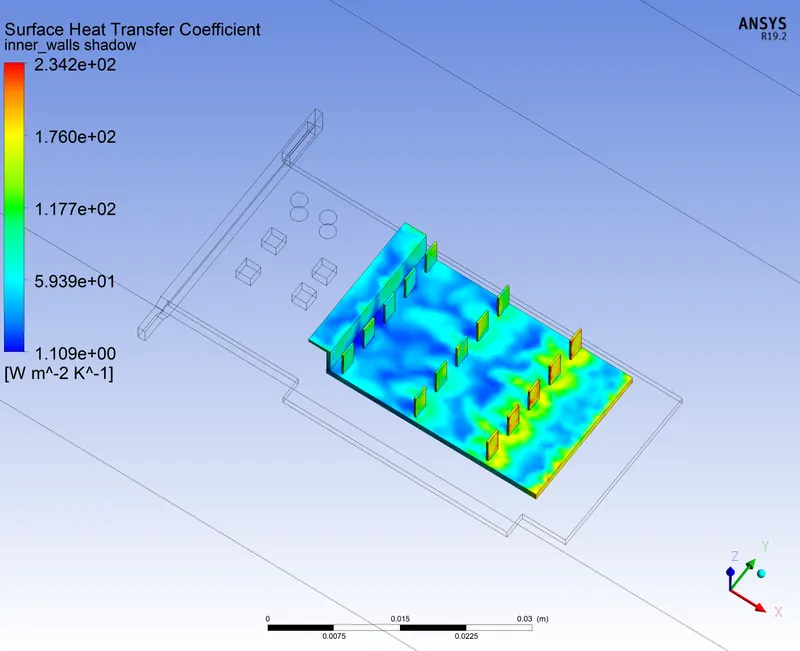
The surface heat transfer coefficient of fins in front row are larger than the fins in succeeding rows.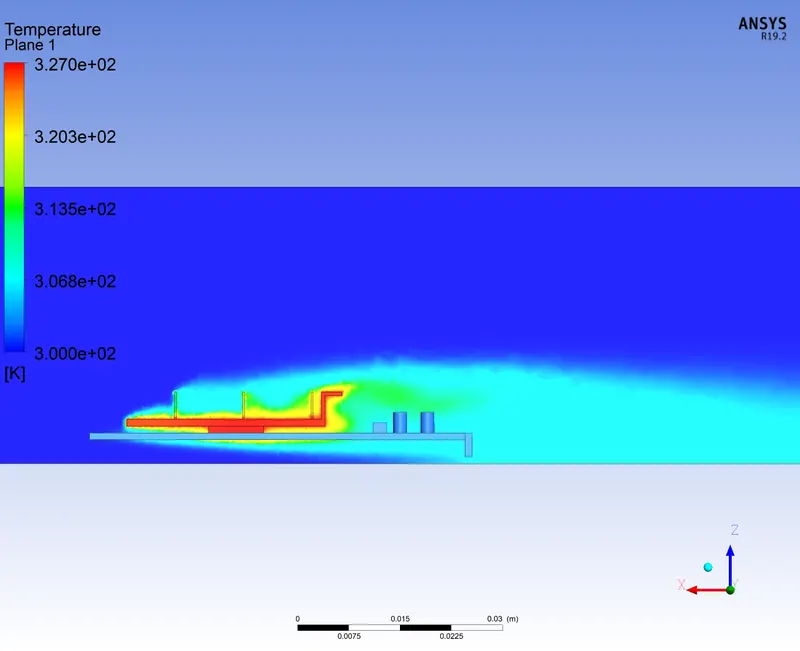
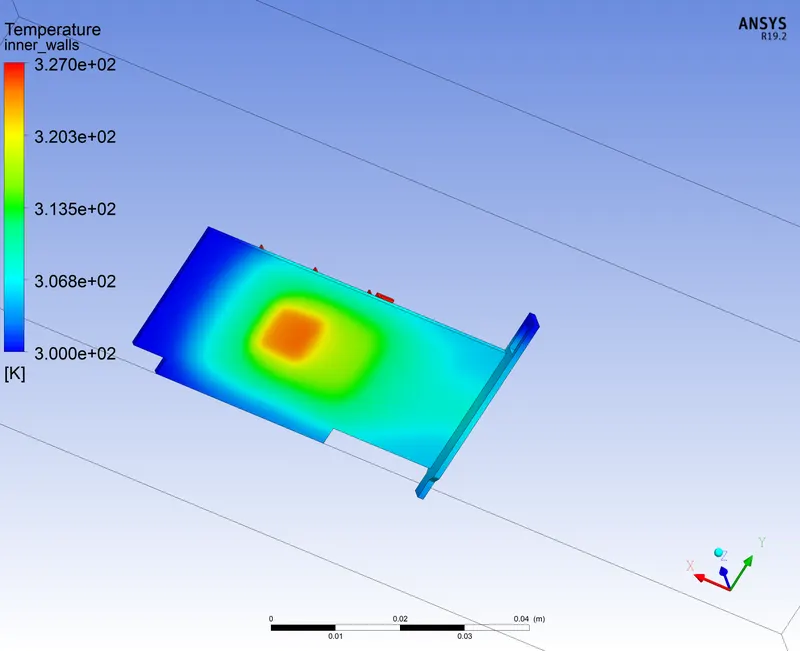
Global temperature contour Global temperature contour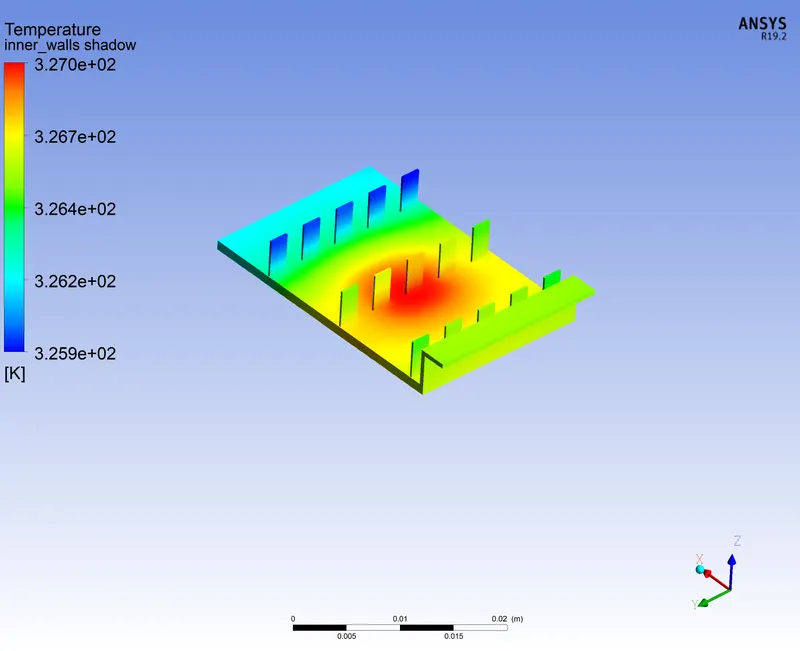
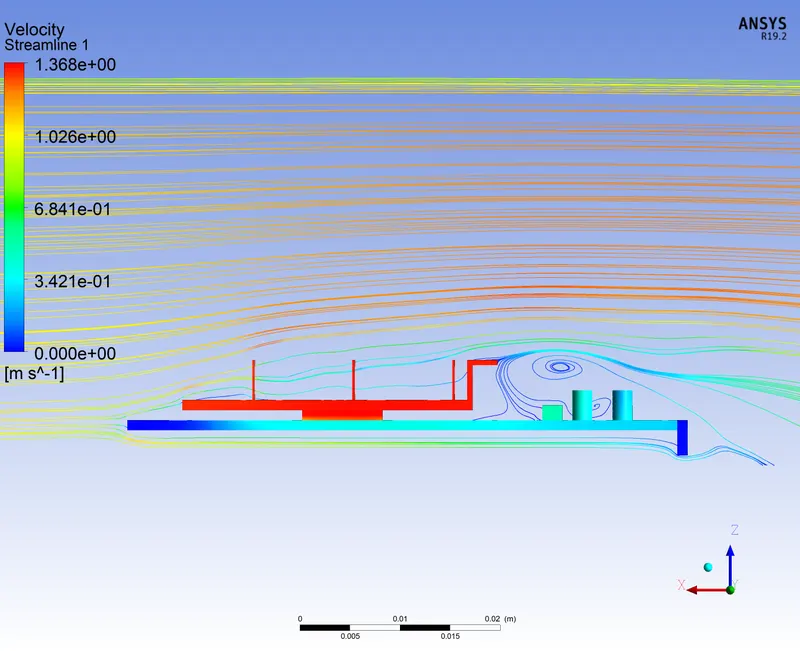
local temperature contour streamlines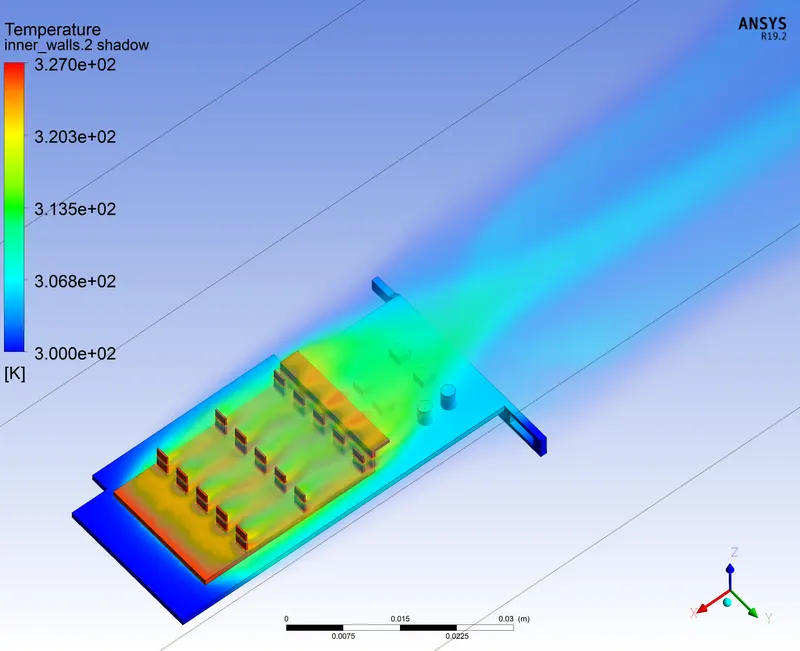
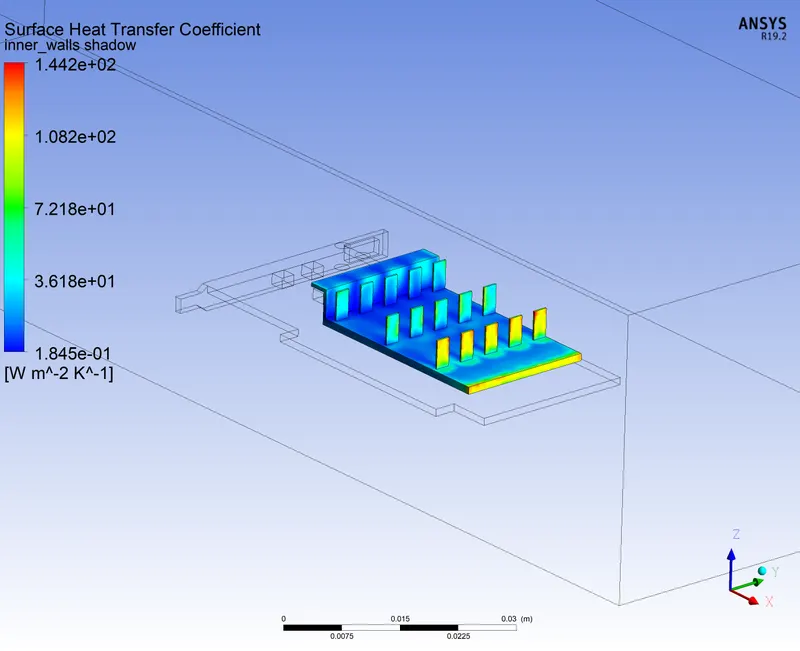
volume rendering surface heat transfer coefficient
Case 2: 3m/s
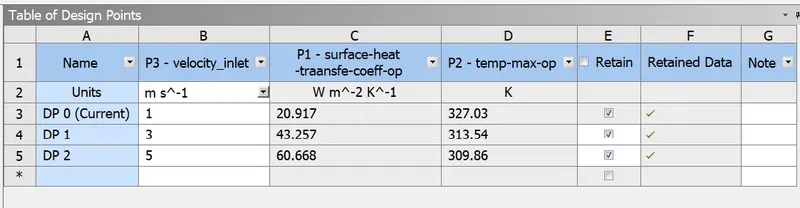
Similar results were obtained with 3m/s velocity, but there is a drop in maximum temperature value and increase in surface heat transfer coefficient value.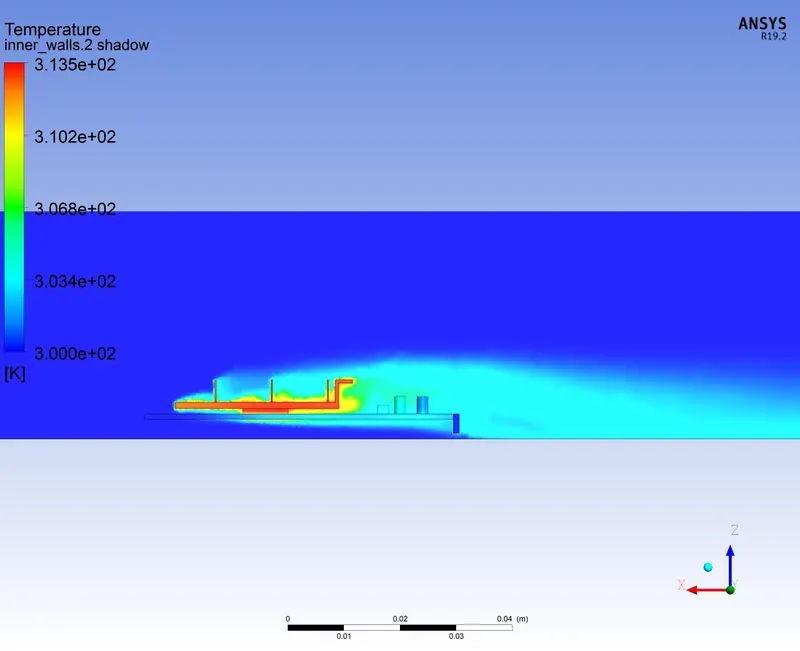
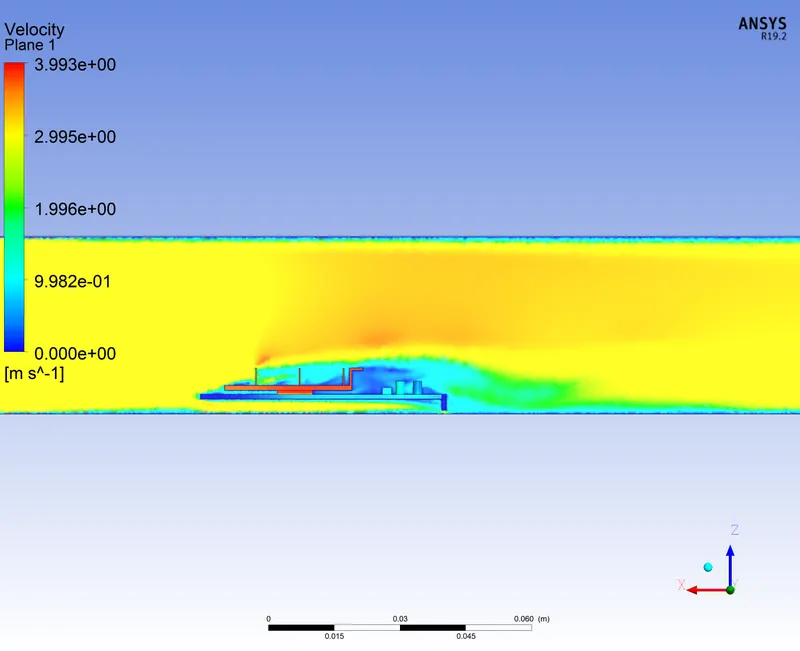
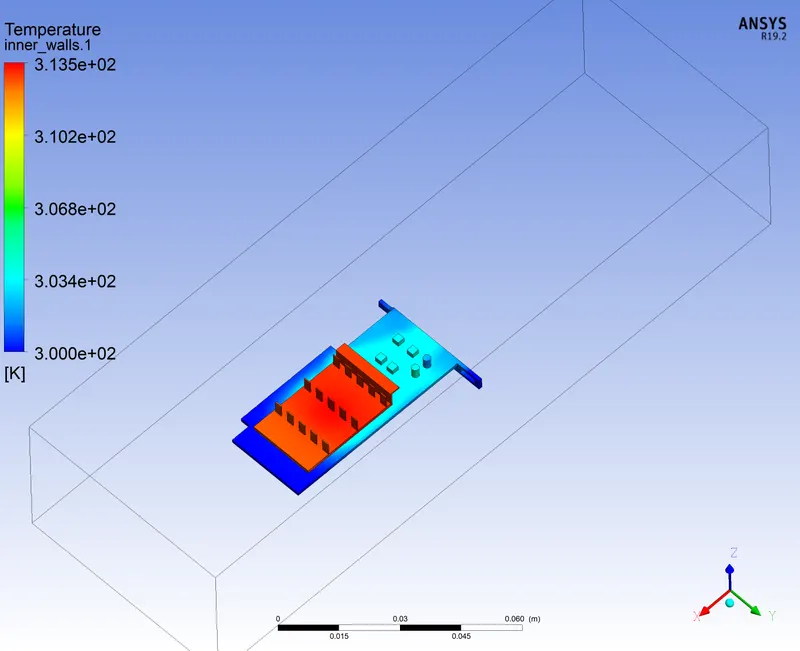
Case 3: 5m/s
Again similar plots were obtained with again the same differences i.e.: even higher surface heat transfer coefficent and lower maximum temperature.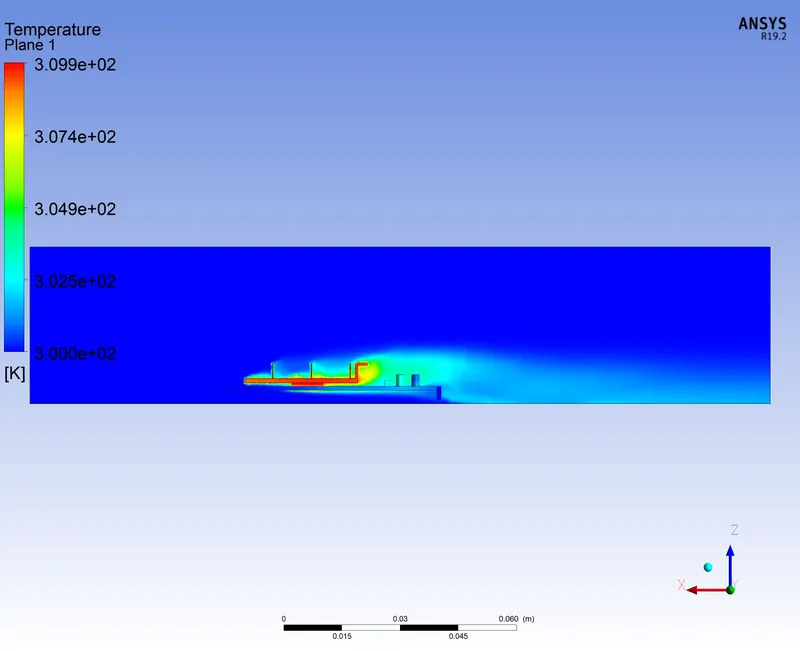
Above results are summarised in the following table:
- Conclusion:
- As the first row of fins experience most air flow, hence has the highest heat transfer coefficient. Since the flow breaks from the first row fin's top edge, the flow experienced by back rows of fins is reduced consequently leading to low surface heat transfer coefficients values.
By providing a better arrangement of the fins the flow distribution can be improved which would help in better penetration of high velocity air over the fins. - As the processor is the only source of heat generation, the surfaces around it forms the hotspot.
- As velocity increases the reynolds number increases and hence the surface heat transfer coefficient also increases. Consequently, the temperature also drops. As,
Q = h A Δ T
- As the first row of fins experience most air flow, hence has the highest heat transfer coefficient. Since the flow breaks from the first row fin's top edge, the flow experienced by back rows of fins is reduced consequently leading to low surface heat transfer coefficients values.
, for a given Q as h increases
- decreases. So, by providing a suitable active cooling system like fans will help in maintaining the temperature of the graphic card.
- As seen in local temperature contour of the fin base, one more reasonfor low heat transfer coefficient is the amount of heat conducted to the outermost fins is lower than the one just above processor. One can choose a material with much better thermal conductivity to aid towards a more uniform temperature distribution.