Project 1 - Parsing NASA thermodynamic data
NASA came up with polynomials that can be used to evaluate thermodynamic properties such as Cp, H and S. They have also documented the co-efficients that are required to evaluate these polynomials for 1000+ species.
So, according to problem statement we have to extract these coefficients for 53 species given in the attached THERMO.dat file, evaluate Cp,Hand E and then plot these values against local temperature range and not the global temperature range.
The program is divided into 4 code sections:
1)The code starts with opening the .dat file of NASA thermodynamic data in read mode and extracting the global temperature values.
%%
%This code section extracts the global temperature values from the given data file.
f1=fopen('THERMO.dat','r');
format shortG                                      %to show numbers in short form.
for i=1:5
    tline=fgetl(f1);
    if i==2
        h_line=strsplit(tline,' ');
        global_temp=zeros(1,3);
        for j=2:4
            global_temp(j-1)=str2double(h_line{j});
        end
    end
end
fgetl :is used to read the file line by line. each time this command is used it will read the next line in the file.
strsplit(tline,' ') : splits the tline wherever ' '(space) is present.
zeros( , ) : is used as it will preassign the memory for global_temp which is changing with each iteration.
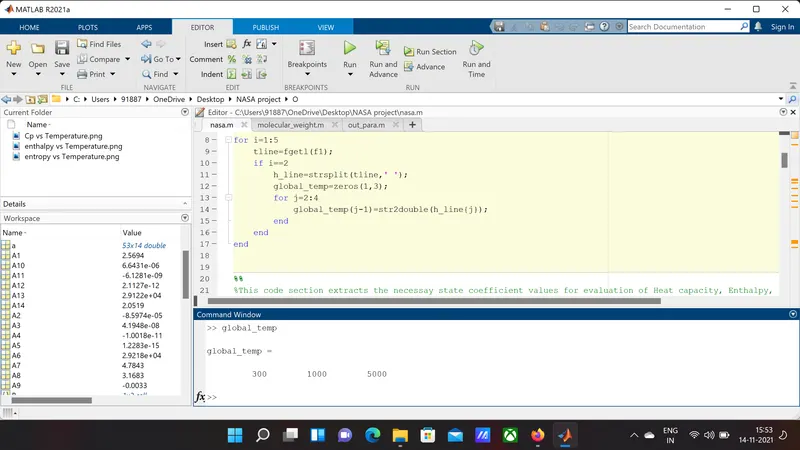
The result of above code section gives us the global temperaure values:
2) This code section extracts the values of coefficients from the file for all the species present in the file.
%%
%This code section extracts the necessay state coefficient values for evaluation of Heat capacity, Enthalpy, Entropy of each species.
%We aslo calculate molecular weight for each species by calling function "molecular_weight".

for i=1:inf
    species_line=fgetl(f1);
    if strcmp(species_line,'END')
        disp('The file was read successfully')
        break
    end
    S=strsplit(species_line,' ');
    species_name{i}=S(1);
    name(i)=string(species_name{i});
    m=0;
    M_wt(i)=molecular_weight(name(i),m);
    B=strsplit(species_line,'G ');
    C=strsplit(B{2},' ');

    for j=1:3
        local_temp(i,j)=str2double(C{j+1});
    end

    tline=fgetl(f1);
    B2=strfind(tline,'E');
    for l=1:5
        a(i,l)=str2num(tline(B2(l)-11:B2(l)+3));
    end
    tline=fgetl(f1);
    B3=strfind(tline,'E');
    for l=6:10
        a(i,l)=str2num(tline(B3(l-5)-11:B3(l-5)+3));
    end
    tline=fgetl(f1);
    B4=strfind(tline,'E');
    for l=11:14
        a(i,l)=str2num(tline(B4(l-10)-11:B4(l-10)+3));
    end
 end
strfind(tline,'E') : will find the positions of 'E' in the tline.
str2num() : converts a string to a number.
species names are stored in an array 'name'.
A function 'molecular_weight' is defined wich takes name as input and gives molecular weight of each species.
function [WT]=molecular_weight(name,m)
t=char(name); %since name array is a string array we have to convert it into char array to differentiate each element within each species.
ele=['H','C','N','O','AR'];
ele_wt=[1.008,12.0096,14.01,15.999,39.948]; %array with values indicating atomic weight of each element in array "ele".

if t~=ele(5)
    for i=1:length(t)
        for j=1:length(ele)
            index=strcmp(t(i),ele(j));
            if index==1
                m=m+ele_wt(j);
            else
                continue
            end
            if lt(i,length(t))
                if rem(str2double(t(i+1)),1)==0
                   z=ele_wt(j);
                   z=(str2double(t(i+1))-1)*z;
                   m=m+z;
                else
                    continue
                end
            else
                m=m*1;
            end
        end
    end
    WT=m;
else
    WT=ele_wt(5);
end
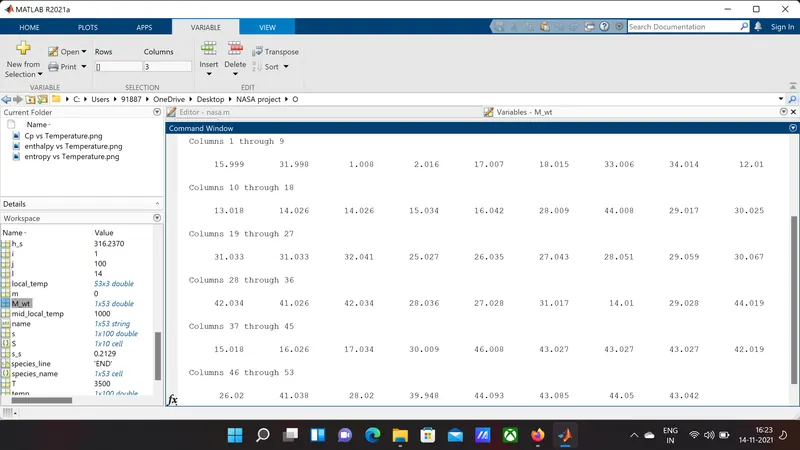
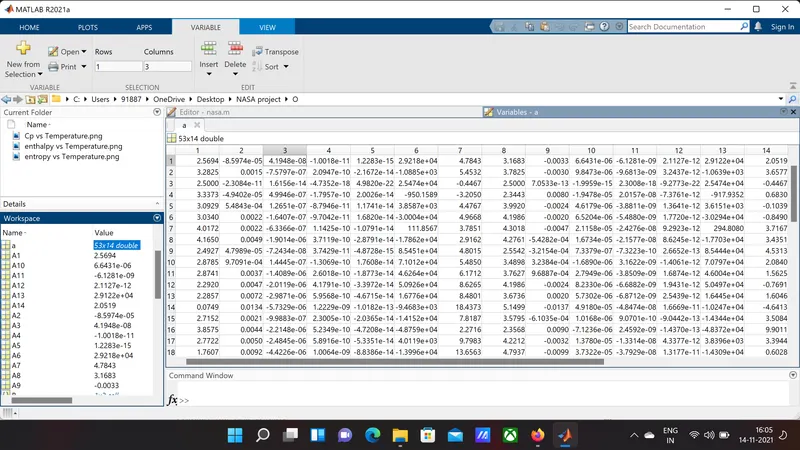
The ouputs of above code section are:
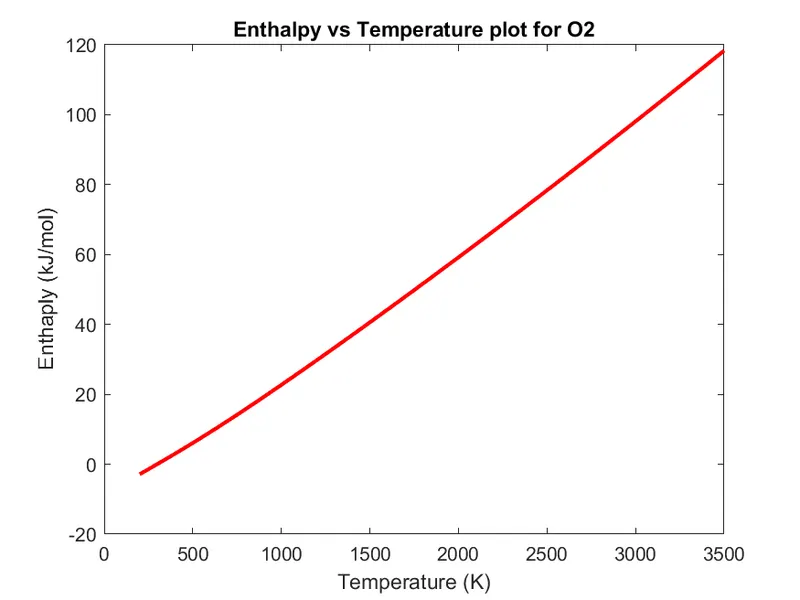
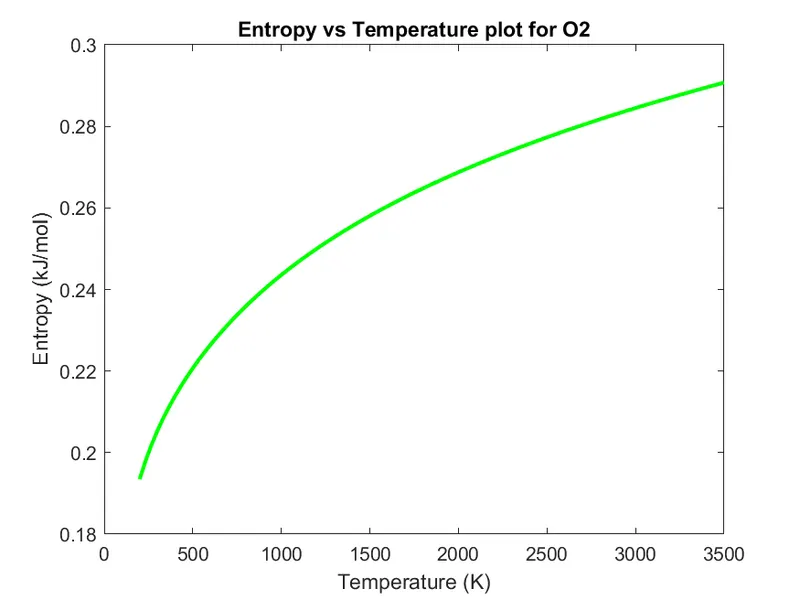
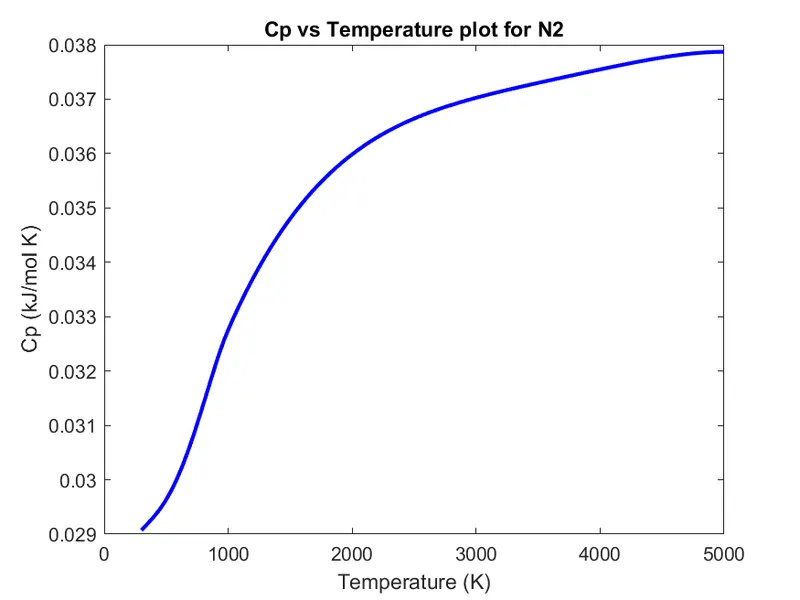
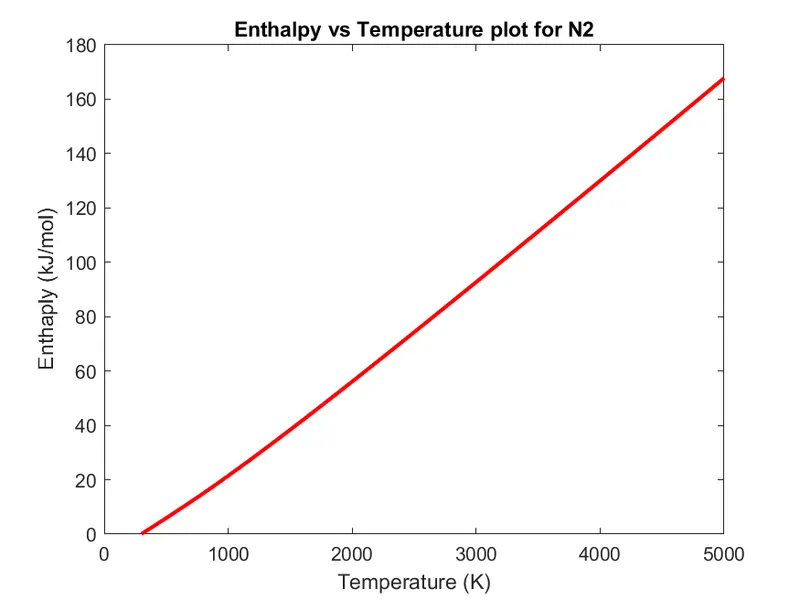
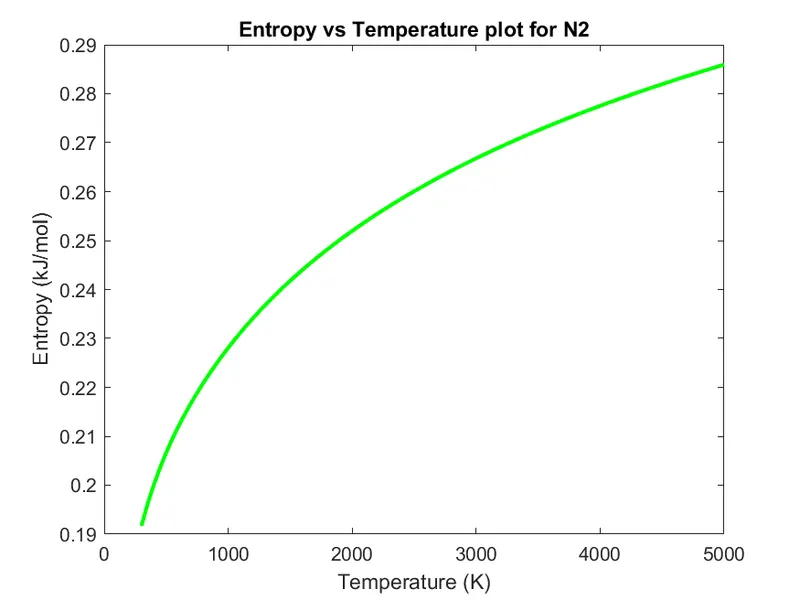
3)This code section defines a function 'out_para' which takes local temperature range of each species; calculates the values of Cp(specific heat), H(enthalpy) and E(entropy) within the temperature range for each species and plots these values against temperature.
local temperatures (temperature range specific to each species) has been used.
since coefficients are present in matrix form, variables (A1,A2,A3,.....)are assigned scalar values to be compatible with the function input field.
%%
 %This code section calls function "out_para" to calculate and plot values
 %of Heat capacity (Cp), Enthalpy(H), and Entropy(S) of each species against Temperature (K).

 for i=1:53
     temp=linspace(local_temp(i,1),local_temp(i,2),100);
     mid_local_temp=local_temp(i,3);
     A1=a(i,1);
     A2=a(i,2);
     A3=a(i,3);
     A4=a(i,4);
     A5=a(i,5);
     A6=a(i,6);
     A7=a(i,7);
     A8=a(i,8);
     A9=a(i,9);
     A10=a(i,10);
     A11=a(i,11);
     A12=a(i,12);
     A13=a(i,13);
     A14=a(i,14);

     for j=1:length(temp)
         T=temp(j);
         [cp_s,h_s,s_s]=out_para(T,mid_local_temp,A1,A2,A3,A4,A5,A6,A7,A8,A9,A10,A11,A12,A13,A14);
         cp(i,j)=cp_s;
         h(i,j)=h_s;
         s(i,j)=s_s;
     end

     cd 'C:\Users\91887\OneDrive\Desktop\NASA project'
     mkdir([name(i)])
     cd(name(i))

     figure(1)
     plot(temp,cp(i,:),'Color','b','LineWidth',2)
     xlabel('Temperature (K)')
     ylabel('Cp (kJ/mol K)')
     title(sprintf('Cp vs Temperature plot for %s',name(i)));
     saveas(gcf,'Cp vs Temperature.png');

     figure(2)
     plot(temp,h(i,:),'Color','r','LineWidth',2)
     xlabel('Temperature (K)')
     ylabel('Enthaply (kJ/mol)')
     title(sprintf('Enthalpy vs Temperature plot for %s',name(i)));
     saveas(gcf,'Enthalpy vs Temperature.png');

     figure(3)
     plot(temp,s(i,:),'Color','g','LineWidth',2)
     xlabel('Temperature (K)')
     ylabel('Entropy (kJ/mol)')
     title(sprintf('Entropy vs Temperature plot for %s',name(i)));
     saveas(gcf,'Entropy vs Temperature.png');

     cd ..
 end
mkdir : makes a directory (or folder) in the current directory.
cd.. : goes back to previous directory.
The function script for "out_para" is as follows:
function [CP,H,S]=out_para(T,mid_local_temp,A1,A2,A3,A4,A5,A6,A7,A8,A9,A10,A11,A12,A13,A14)

R=8.314e-03; %gas constant in kJ/mol K.

%since each species have different mid temperature it will consider mid temperature of individual species and not global mid temperature.

if le(T,mid_local_temp)
  CP=R*(A8+(A9*T)+(A10*T^2)+(A11*T^3)+(A12*T^4));
  H=R*(A8+((1/2)*A9*T)+((1/3)*A10*T^2)+((1/4)*A11*T^3)+((1/5)*A12*T^4)+(A13*(1/T)))*T;
  S=R*((A8*log(T))+(A9*T)+(A10*(1/2)*T^2)+(A11*(1/3)*T^3)+(A12*(1/4)*T^4)+A14);
else
  CP=R*(A1+(A2*T)+(A3*T^2)+(A4*T^3)+(A5*T^4));
  H=R*(A1+((1/2)*A2*T)+((1/3)*A3*T^2)+((1/4)*A4*T^3)+((1/5)*A5*T^4)+(A6*(1/T)))*T;
  S=R*((A1*log(T))+(A2*T)+(A3*(1/2)*T^2)+(A4*(1/3)*T^3)+(A5*(1/4)*T^4)+A7);
end
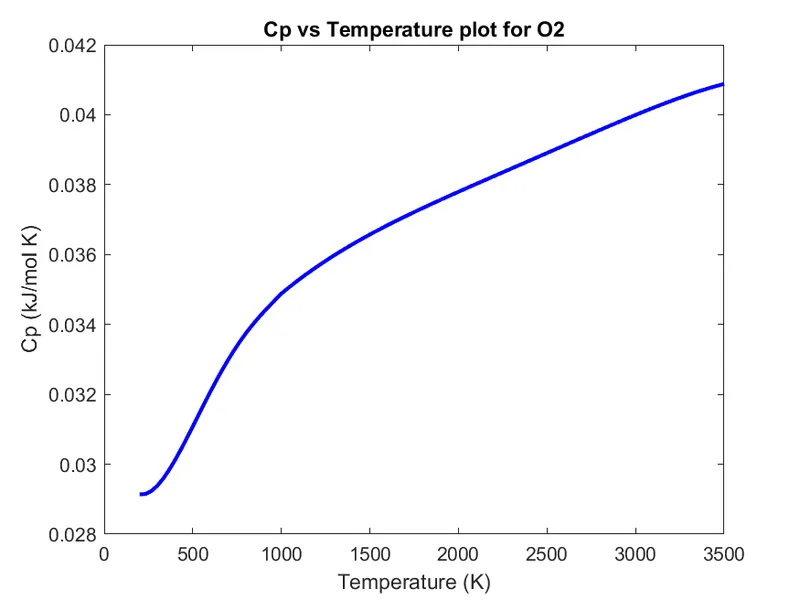
The output of above code section is as follows:
a) O2 plots:
b)N2 plots:
c) CO2 plots:
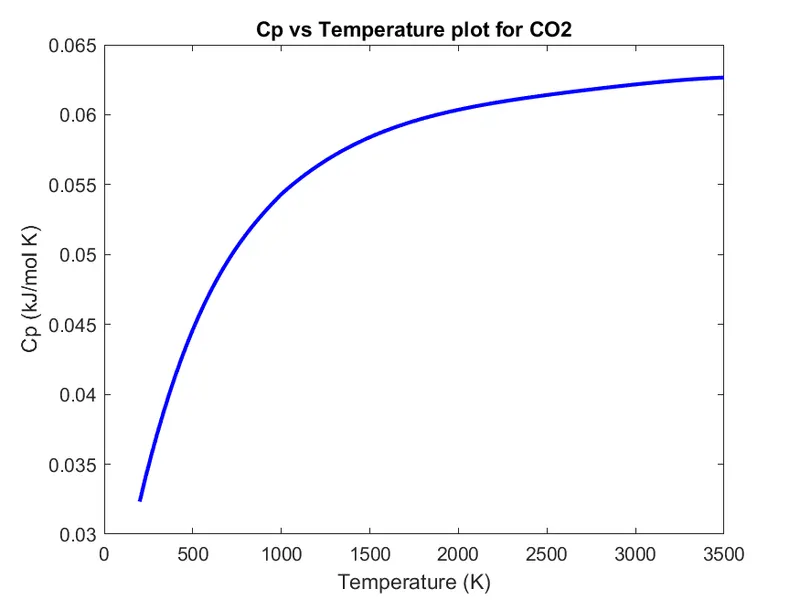
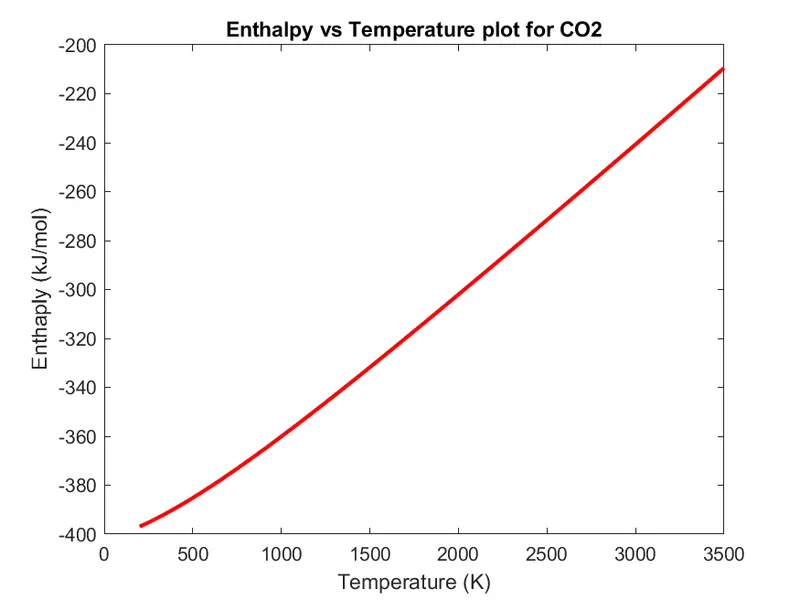
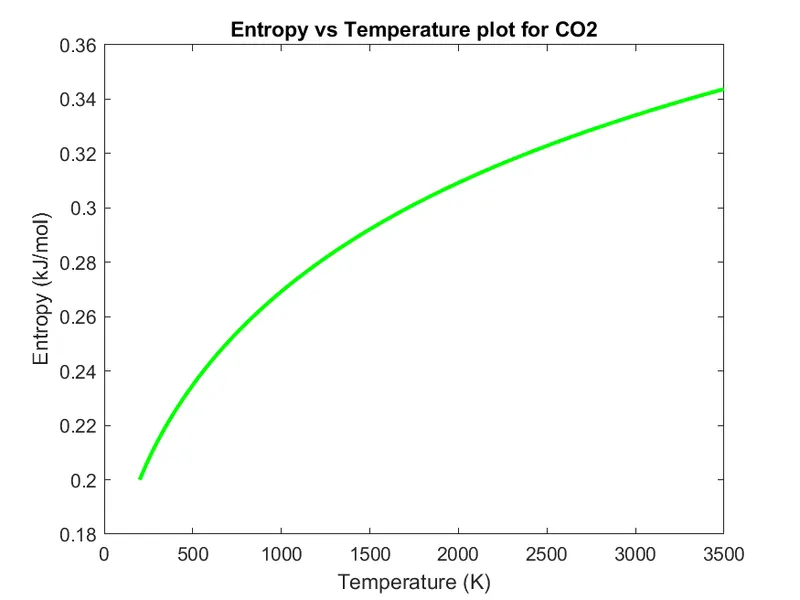
Since few species have different temperature ranges for which the relation for Cp,H and E holds, we see the plots are consistent with temperature ranges.

4)This code section creates a text file with the name "Molecular weight" and fills it with each species name along with their corresponding molecular weight.
%%
 %This section of code creates a text file to same name of each species and corresponding molecular weight of each species.
 fid=fopen('Molecular Weight.txt','wt');
 fprintf(fid,'Species name     Molecular weight');

 for i=1:53
     fprintf(fid,'\n%6s              %5.3f\n',name(i),M_wt(i));
 end
The ouput text file is attached with the project attachments.
The references used for the challenge are as follows:
1)https://in.mathworks.com/help/matlab/
2)http://combustion.berkeley.edu/gri-mech/data/nasa_plnm.html
3)Page 09 of https://shepherd.caltech.edu/EDL/PublicResources/sdt/refs/NASA-TM-4513.pdf