Week 6 - CHT Analysis on a Graphics card
AIM: To Perform a steady-state conjugate heat transfer analysis on a model of a graphics card.
OBJECTIVES:
- Run the simulation by varying the velocity from 1m/sec to 5m/sec for at least 3 velocities and discuss the results.
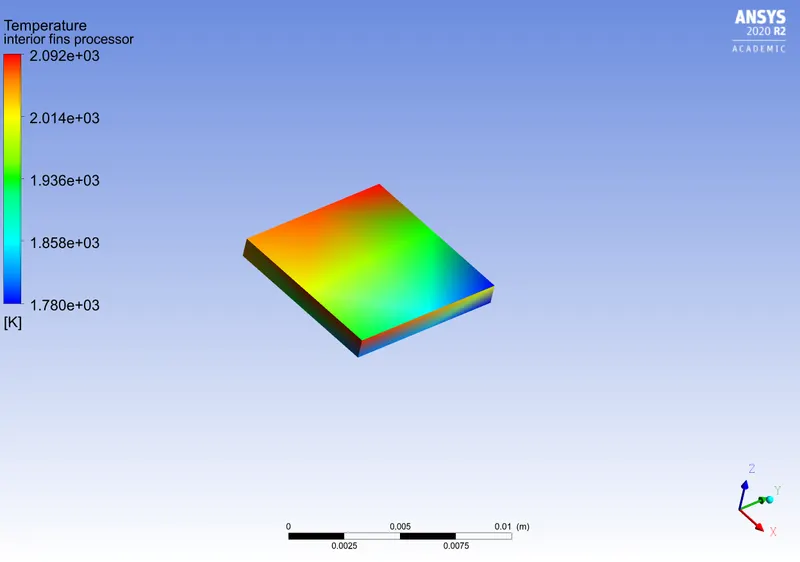
- Find out the maximum temperature and heat transfer coefficient attained by the processor.
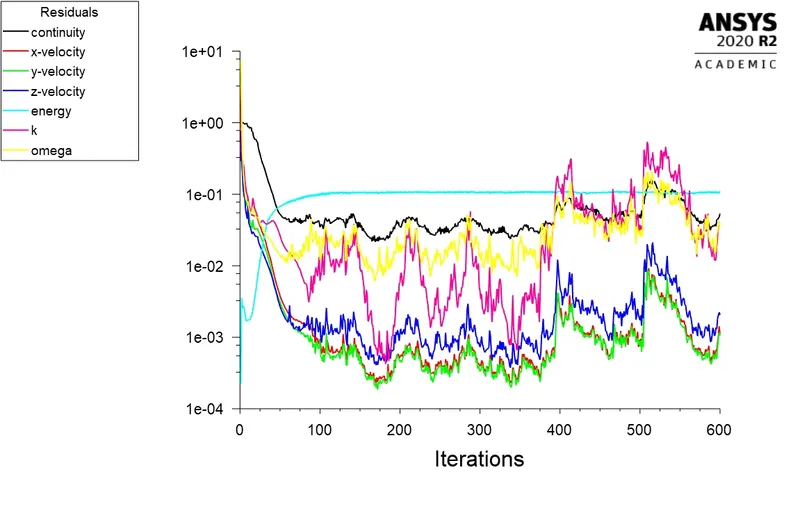
- Prove that the simulation has achieved convergence with appropriate images and plots.
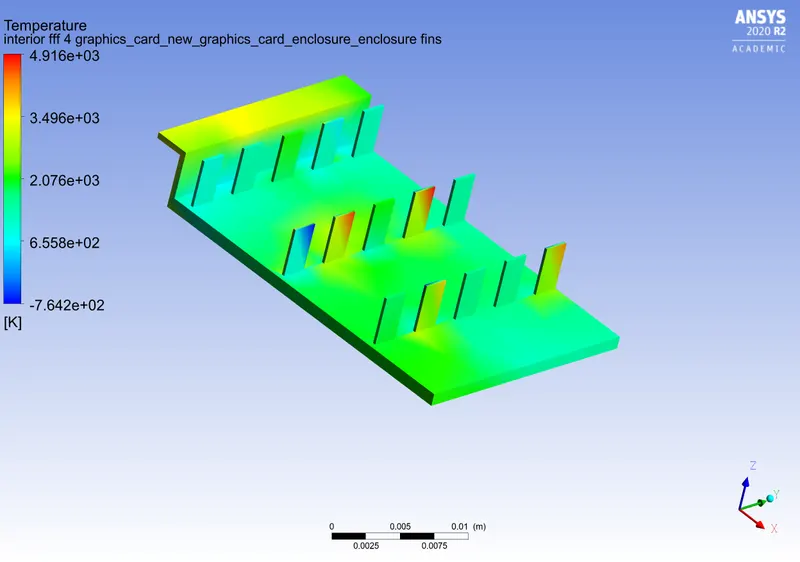
- Identify potential hotspots on the model
Conjugate heat transfer is defined as the heat transfer between two domains by exchange of thermal energy. For a system the thermal energy available is defined by its temperature and the movement of thermal energy is defined by its heat flux through the outer walls. Heat transfer in solids happens through conduction and through the walls by convection and in liquid phase through convection.
CHT provides the temperature prediction and the hotspots regions at the solid liquidinterface and we can also predict the heat transfer accurately for example conduction through solids, convection through fluid and thermal radiation. It also provides the velocity and pressure distribution of the fluids moving inside in the solid. We can also use CHT in design optimisation for improvement for heat transfer and cooliing capacity.
Examples of Conjugate Heat transfer analysis:
HVAC, Heat Exchanger, Tank, Internal Combustion Engine, Heat Sink, Boiler, Reactor, Heat Pipe, Turbocharger.
Benefits:
Conjugate heat transfer analysis is beneficial in accurately predicting the surface temperatures and heat exchanging capabilities of the engineering devices. Through the analysis engineers can optimize the thermal characteristics for their chosen product design.
It can be used for following reasons.
- Measurement of heat transfer through conduction in solid regions.
- Identification of fluid flow parameters around the solid domain.
- Measurement of convective heat transfer from solids to surrounding fluid environment.
- Evaluation of heat transfer capabilities of the product.
- Measurement of surface temperatures and hot spot regions.
- Design optimization for improvement in heat transfer rate and cooling capacity.
Case Setup:
Geometry:
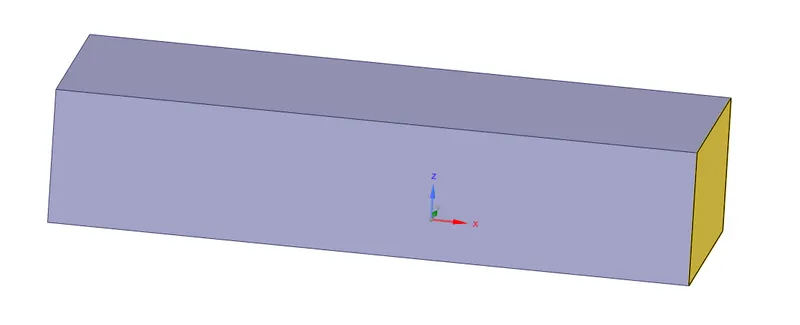
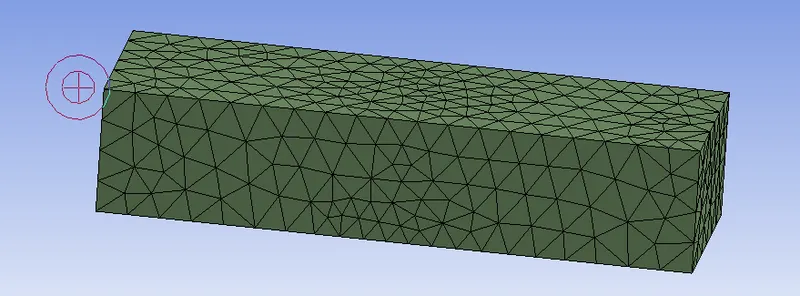
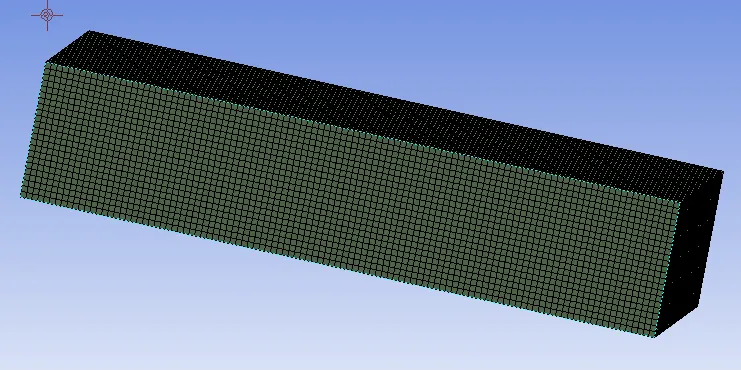
Enclouser:
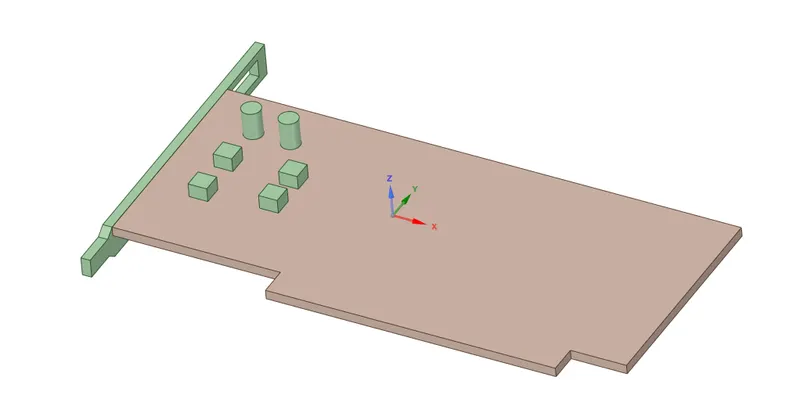
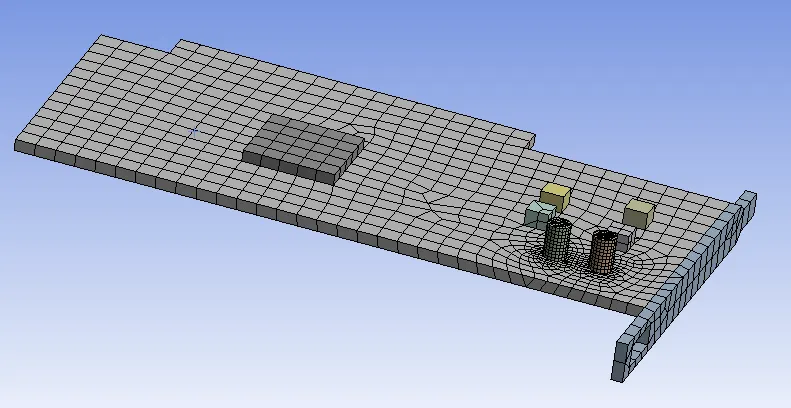
Base:
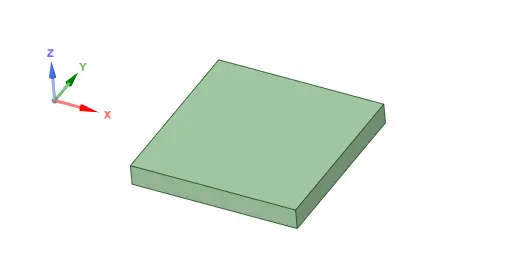
Processor:
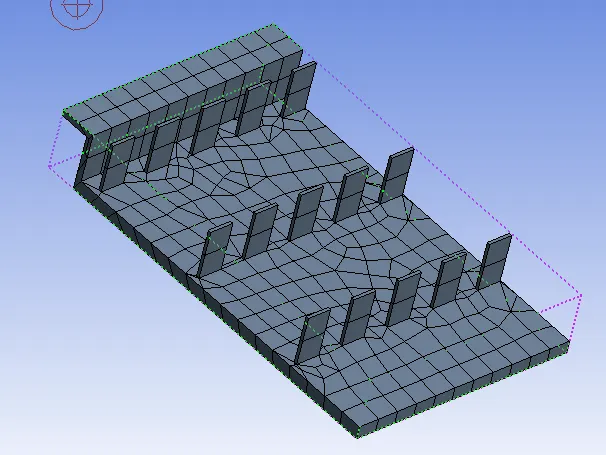
Fins:
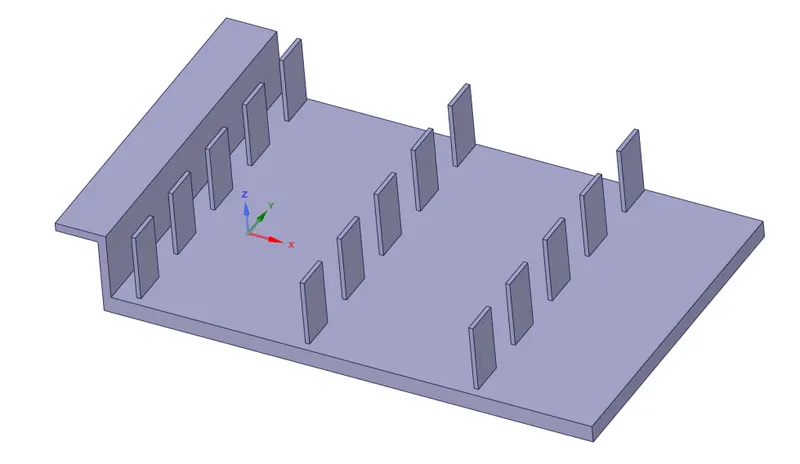
In the geometry setup we are setting up the CAD model which is not exactly the graphics card but for the study of CHT and to understand the concept we are considering the model as shown above.
Meshing:
Coarse mesh is used for the baseline simulation.
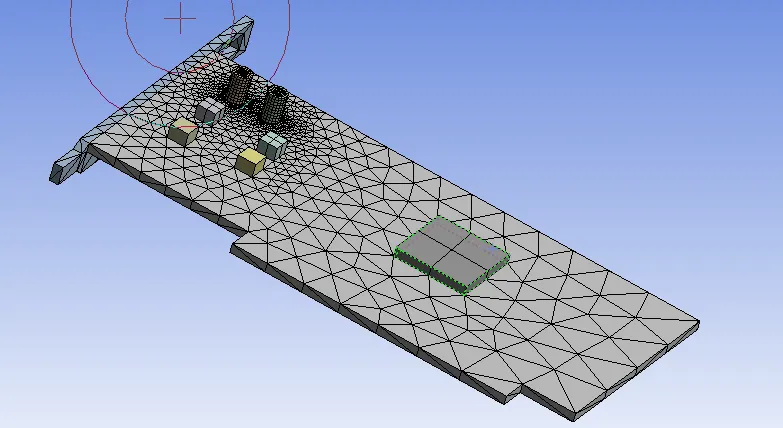
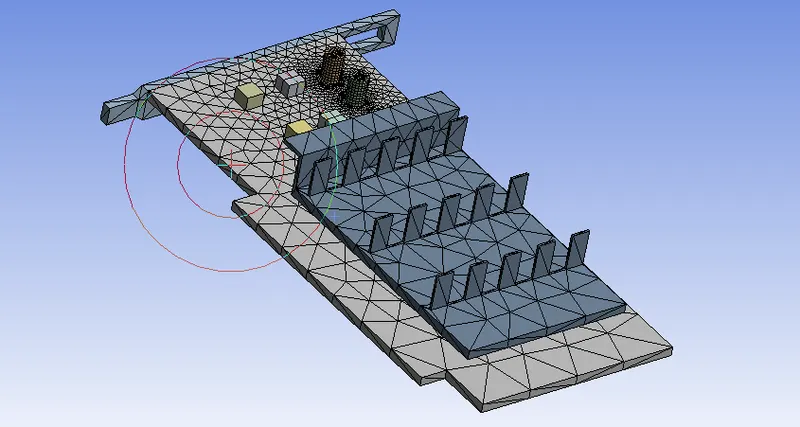
Element size: 10.289 mm (Default)
Nodes: 15952
Elements: 85090
Setup:
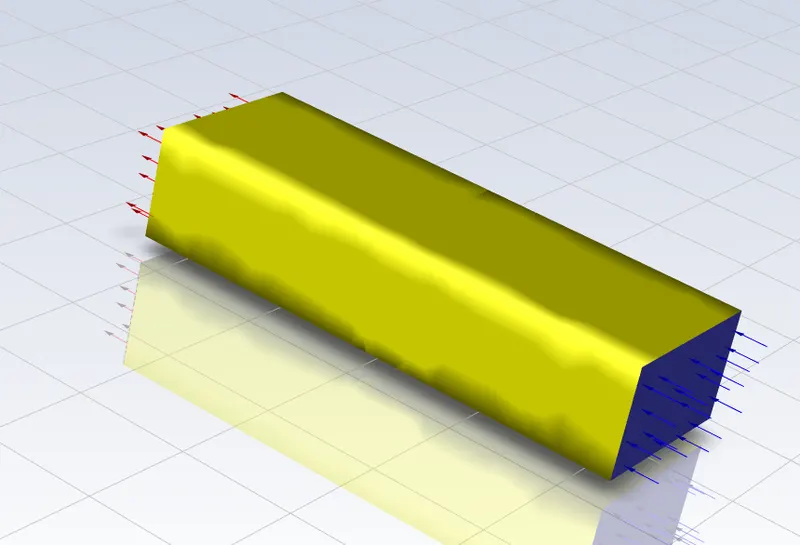
Setting up the physics for CHT analysis on a graphics card in ANSYS fluent.
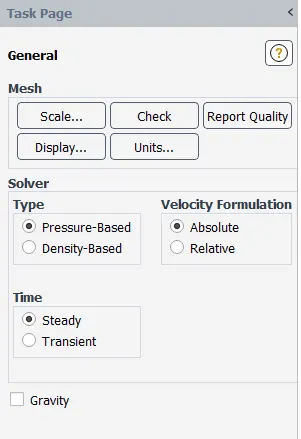
- For this case, we are using a pressure-based steady-state solver
- Velocity formulation - Absolute
Models setup
- Energy
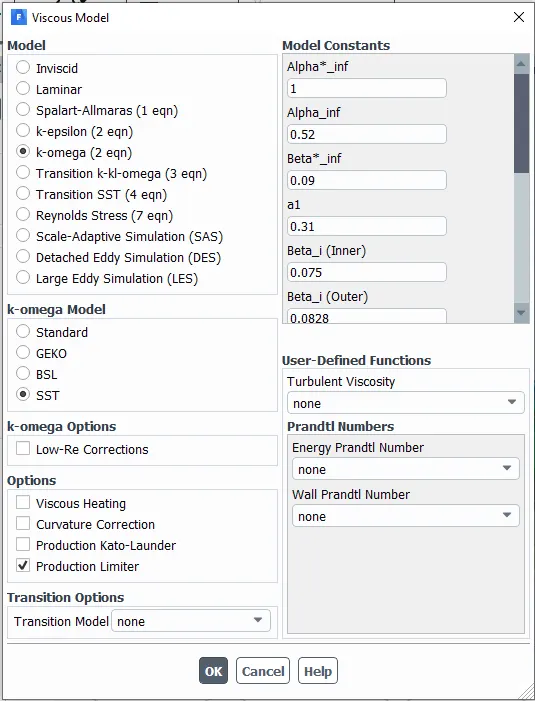
- Viscous - K-Omega
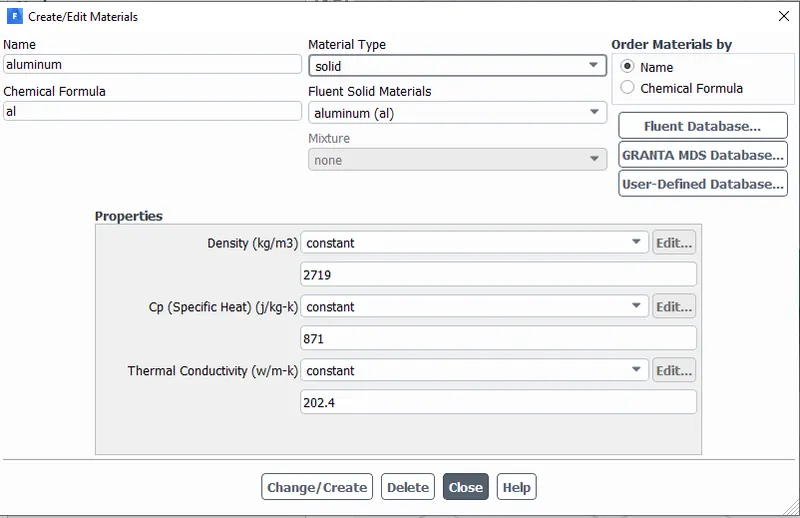
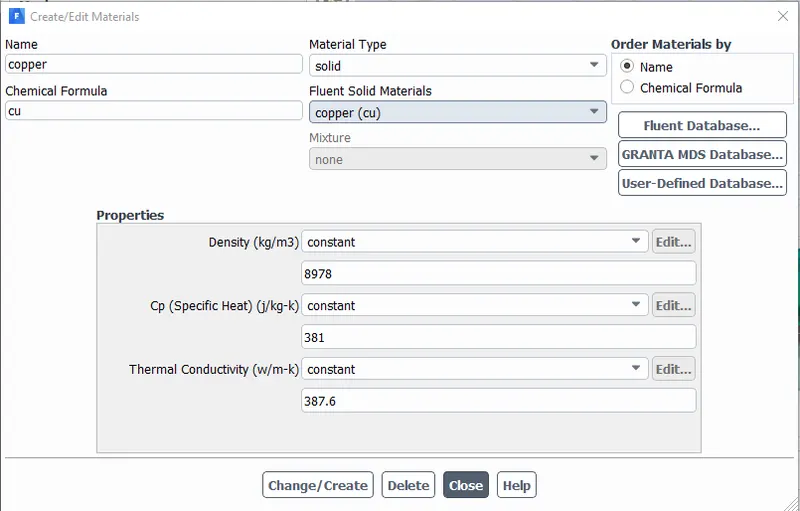
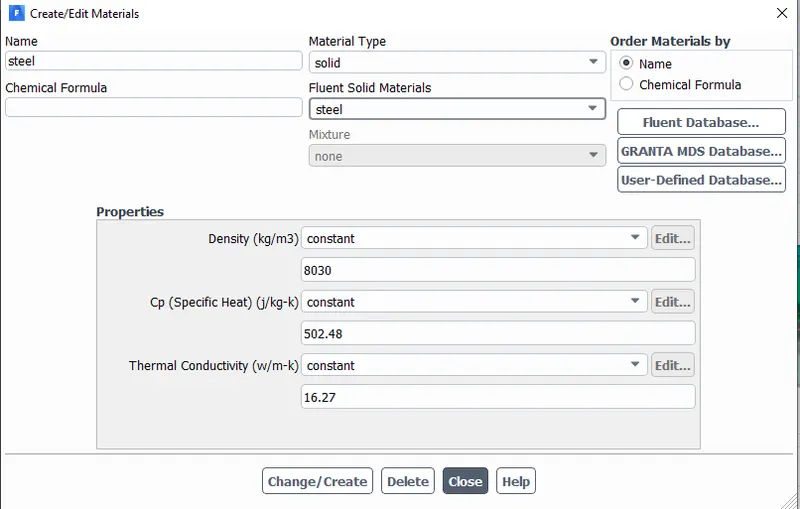
Materials :
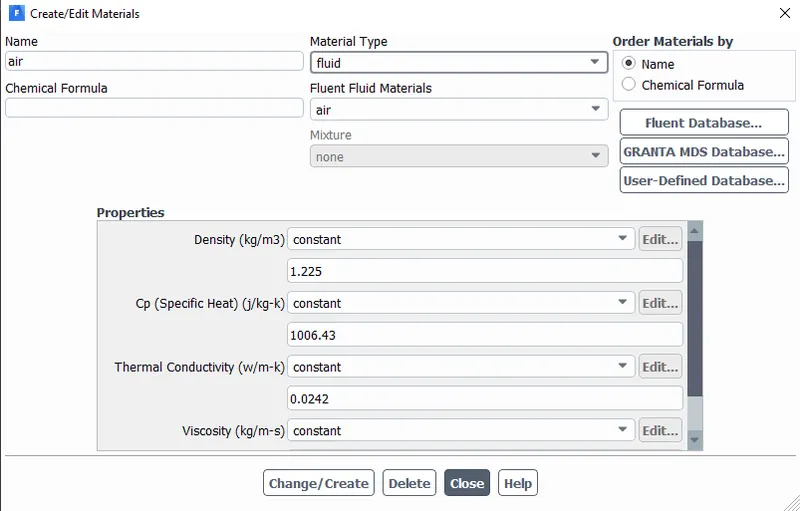
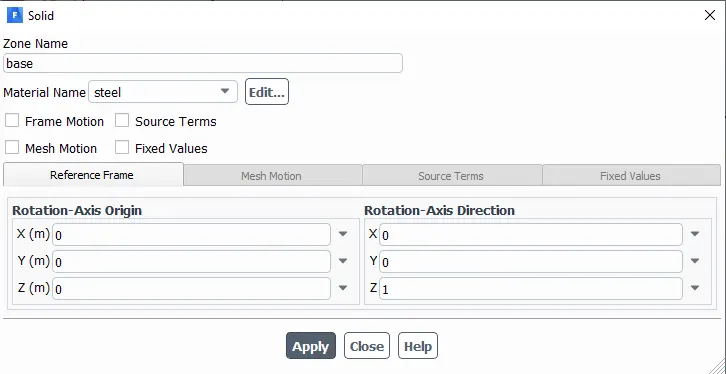
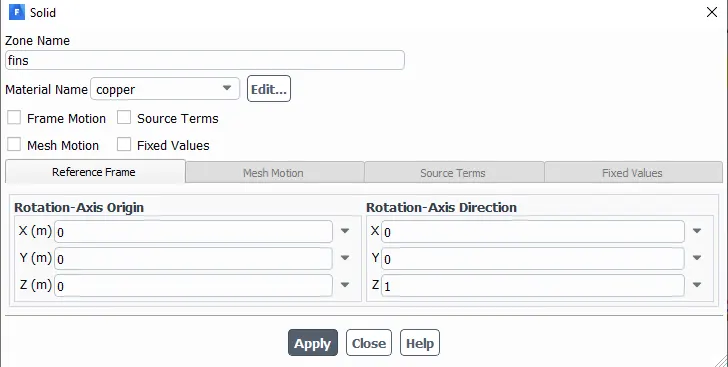
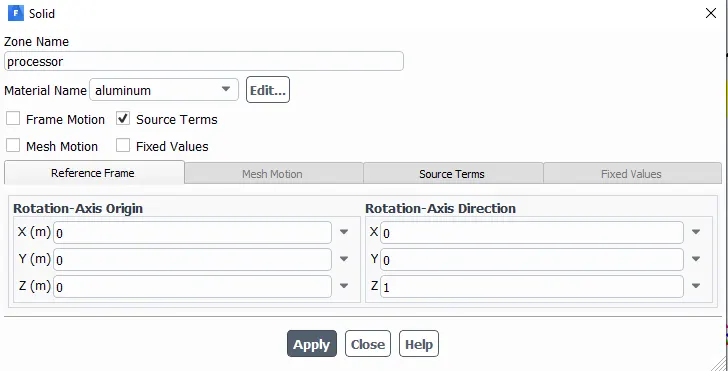
We are using different material for all the component
For fluid : Air (Flowing inside the domain)
- Density = 1.225 kg/m^3
- Viscosity = 1.7894e-05 kg/ms
For Fins : copper(Graphics card component)
- Density = 8978 kg/m^3
- Specific heat = 381 j/kg-k
- Thermal conductivity = 387.6 w/m-k
For Processor : aluminium(Graphics card component)
- Density = 2330 kg/m^3
- Specific heat = 710 j/kg-k
- Thermal conductivity = 150 w/m-k
For Base : steel (Graphics card component)
- Density = 8050 kg/m^3
- Specific heat = 502 j/kg-k
- Thermal conductivity = 16.27 w/m-k
Setting up the source terms :
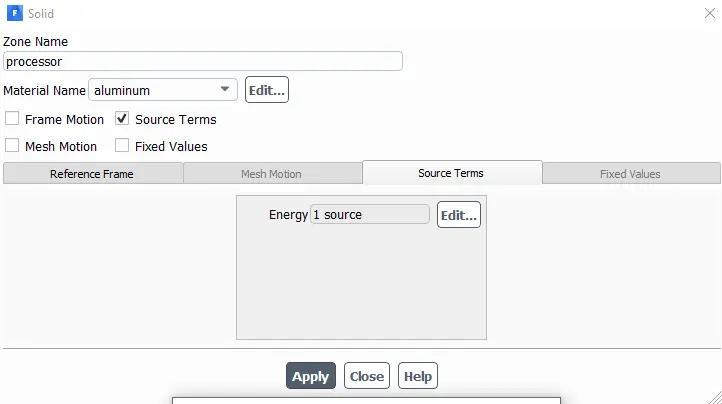
For this case, we consider that our processor is a source term and is generating heat.
So, for setting up the source term go to Zones - Cell zones - and click on the processor for editing which is in the Solid.
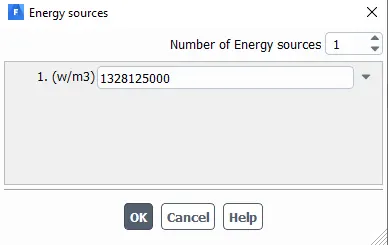
After that select the material to aluminium and click on the source terms to enabled it and set the energy source to 1.
Calculation for the Energy source
Let the processor consume 85 W of power to work.
Dimension of the processor =8*8*1 m^3
So, the Energy produced by the processor is 1328125000 w/m^3.
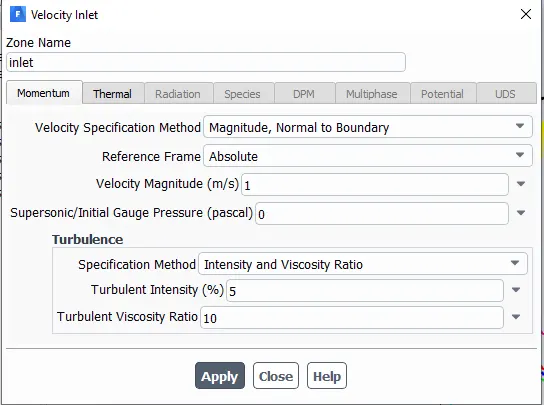
Inlet
- Air is used as a fluid
- Velocity = 1 m/s
- Temperature = 300 K
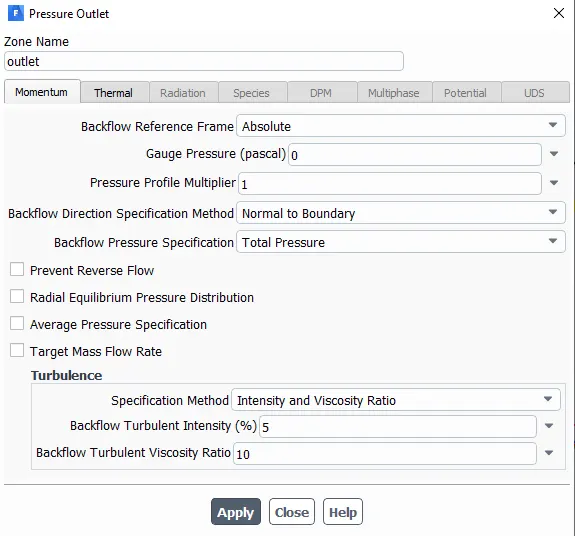
Outlet
- Pressure = Gauge pressure (0 pa)
All the four side faces
- Follow the symmetry B/C
Graphics card
- Follow the No-slip Wall B/C

Results:
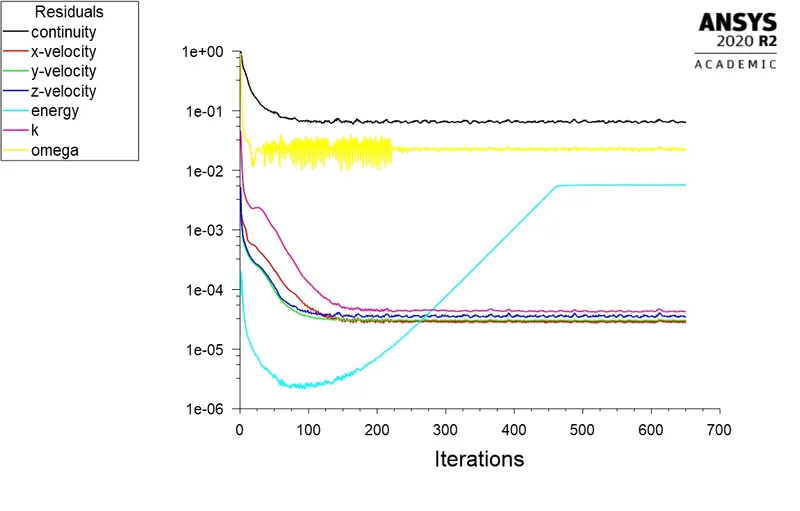
Residuals:
Temperature contours.
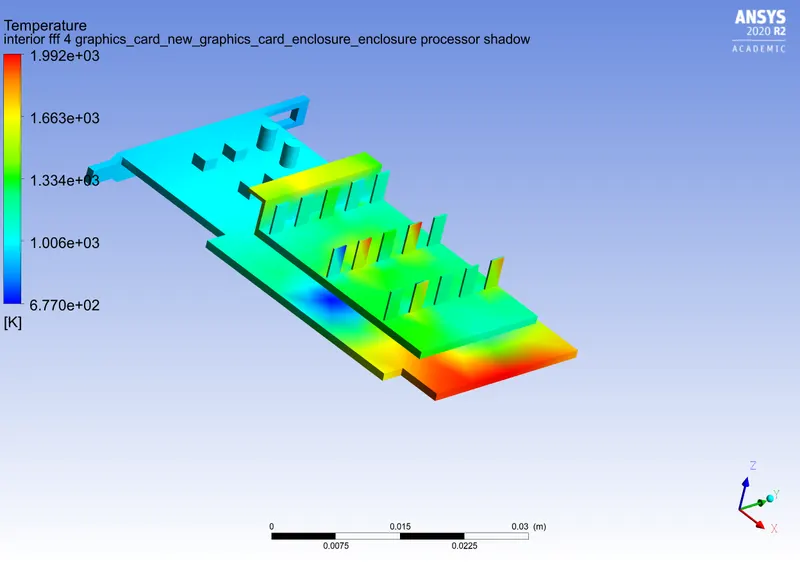
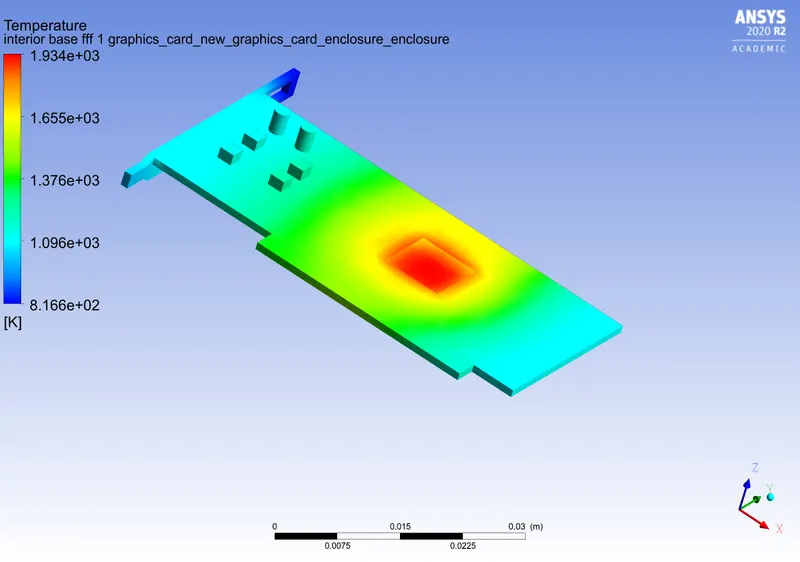
Hotspot on the base.
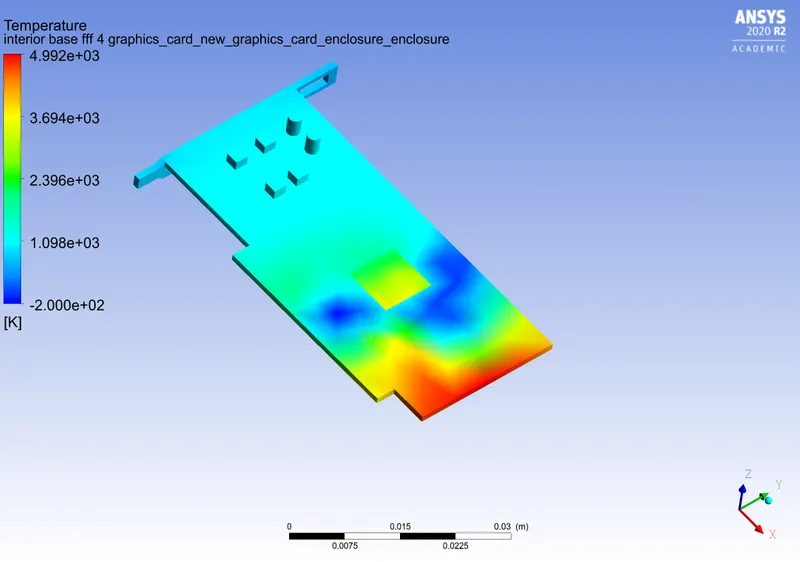
The temperature at the processor.
Temperature at the Fins.
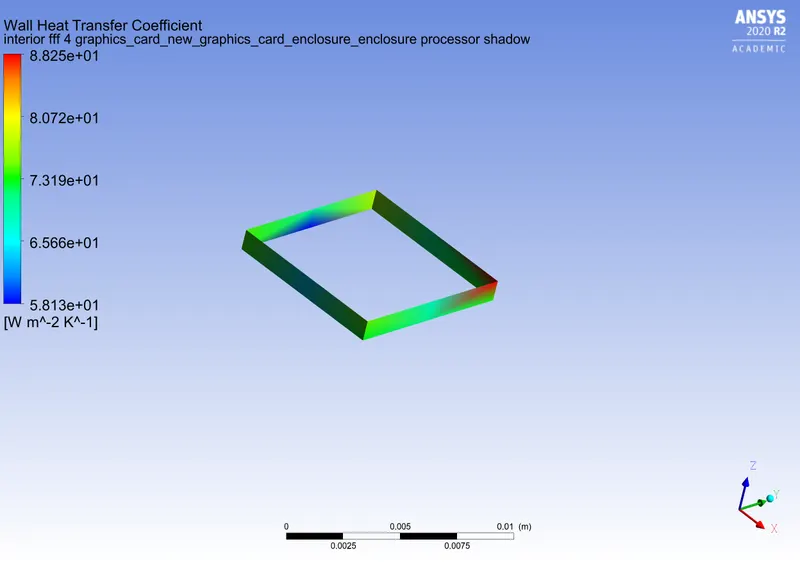
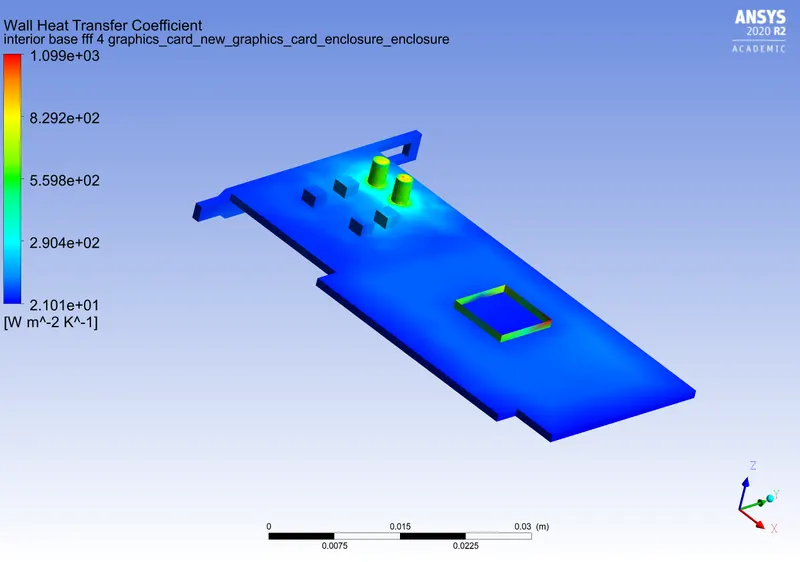
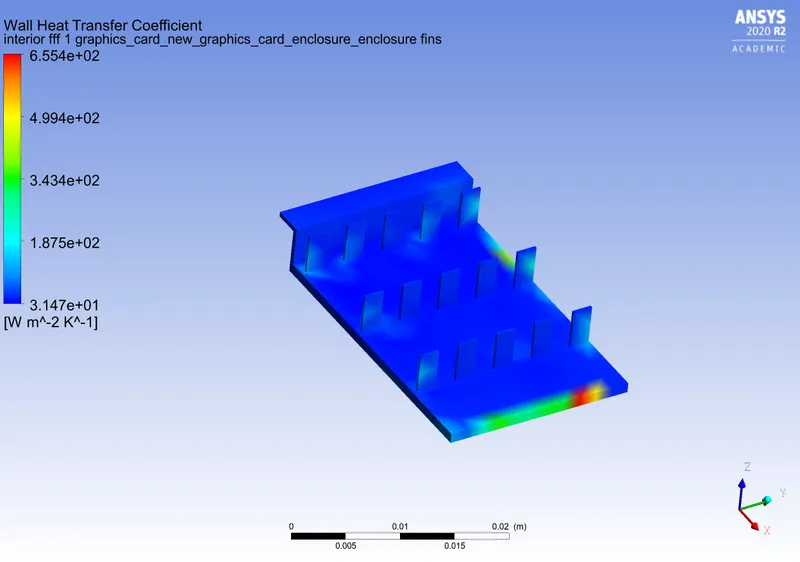
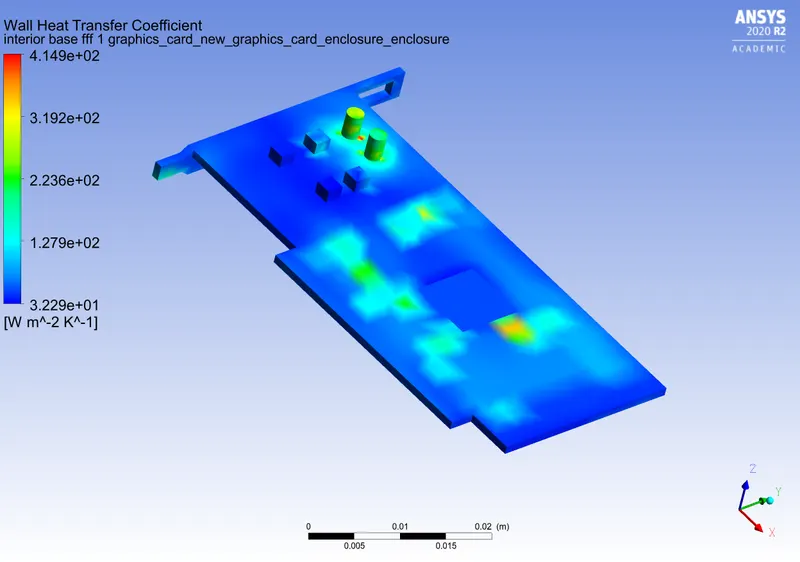
Wall heat transfer coefficient.
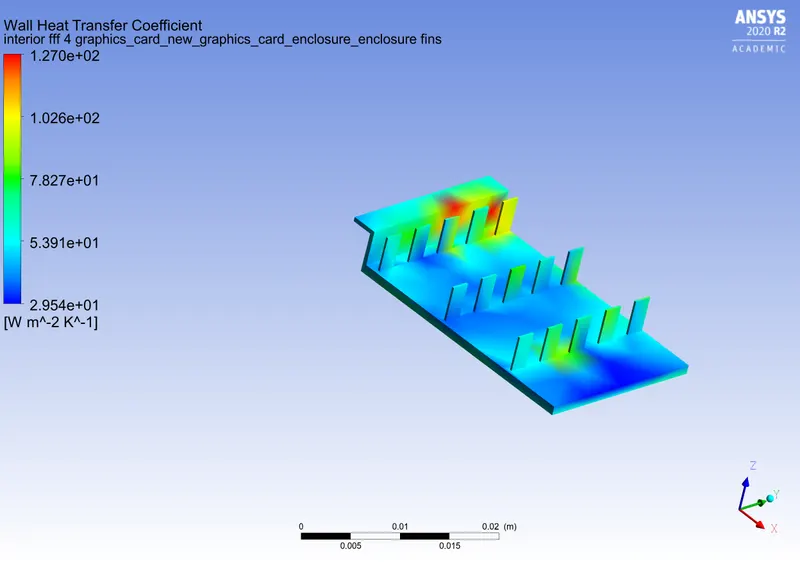
CASE 1.
For velocity 1m/s.
Refined mesh simulation.
Element size: 1.75 mm
Nodes: 112633
Elements: 117834
Residuals:
In the graph, we can observe that the solution is converging after 475 iterations.
Temperature Hotspot on the base.
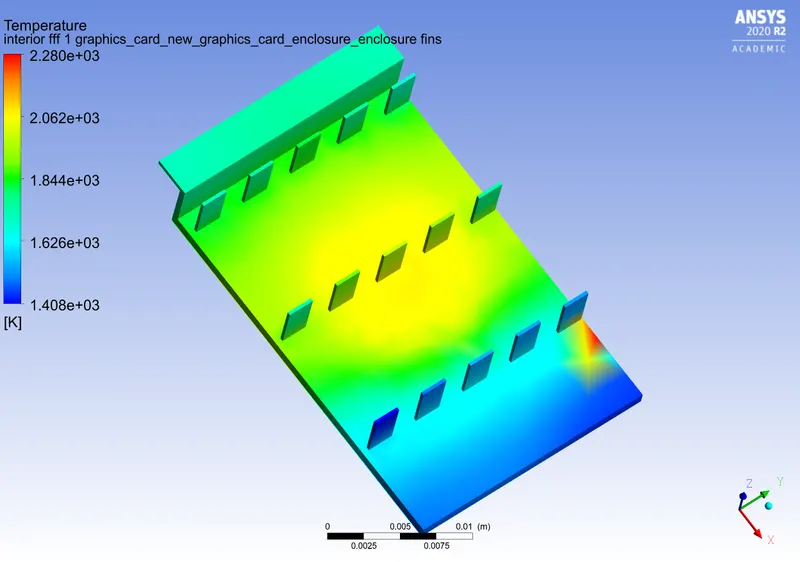
Temperature at the fins.
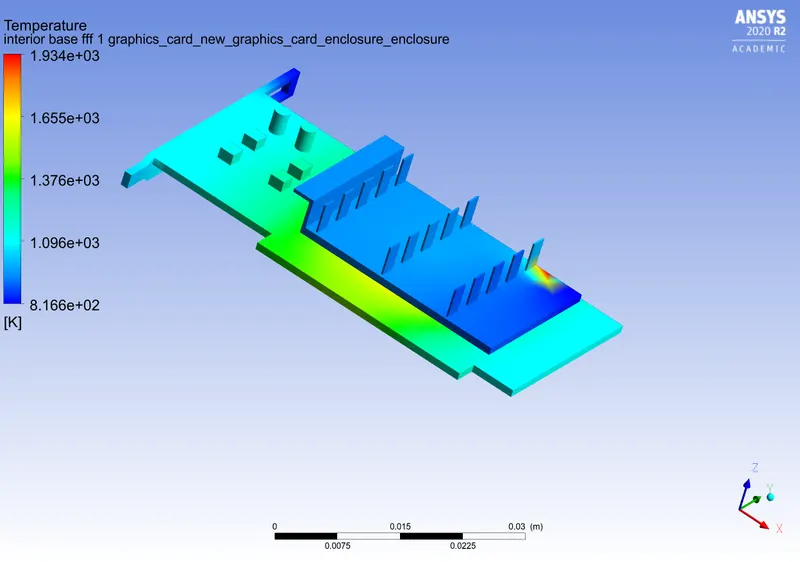
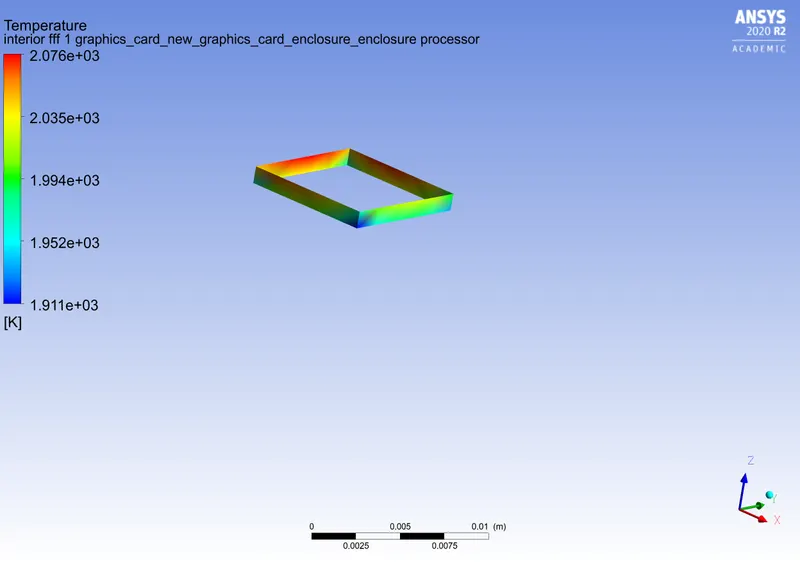
Temperature at processor.
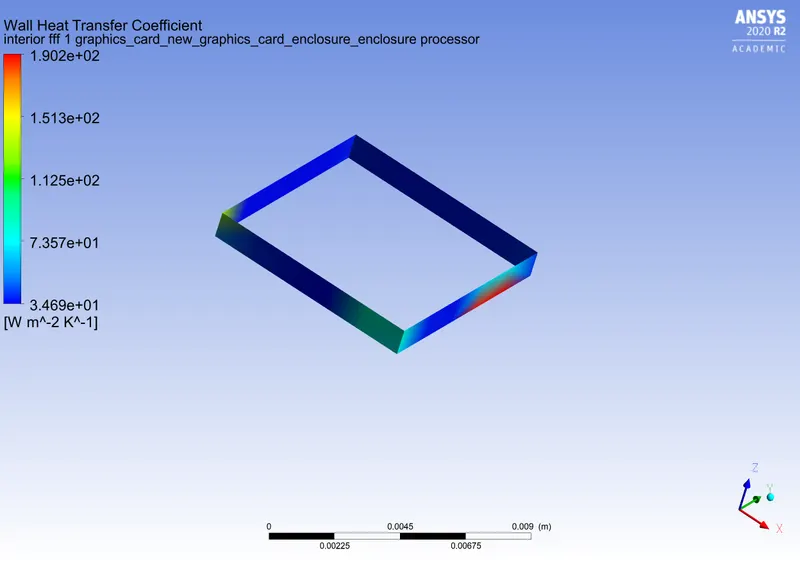
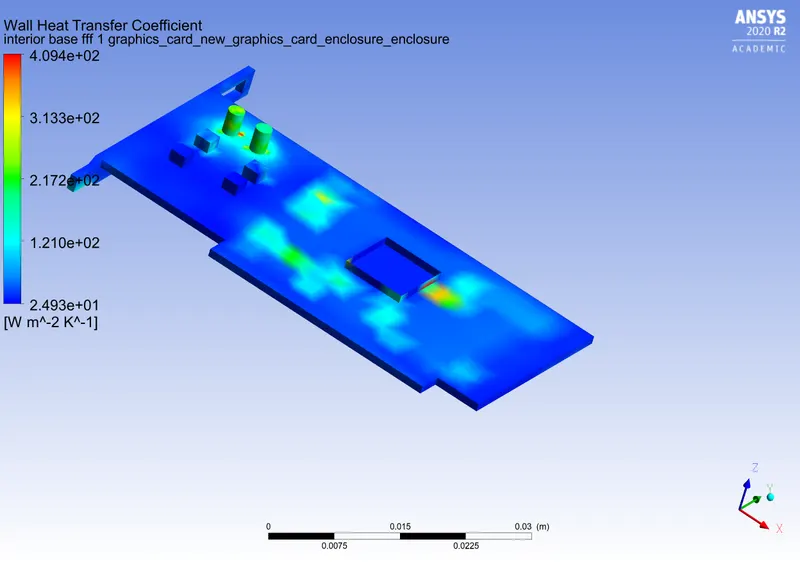
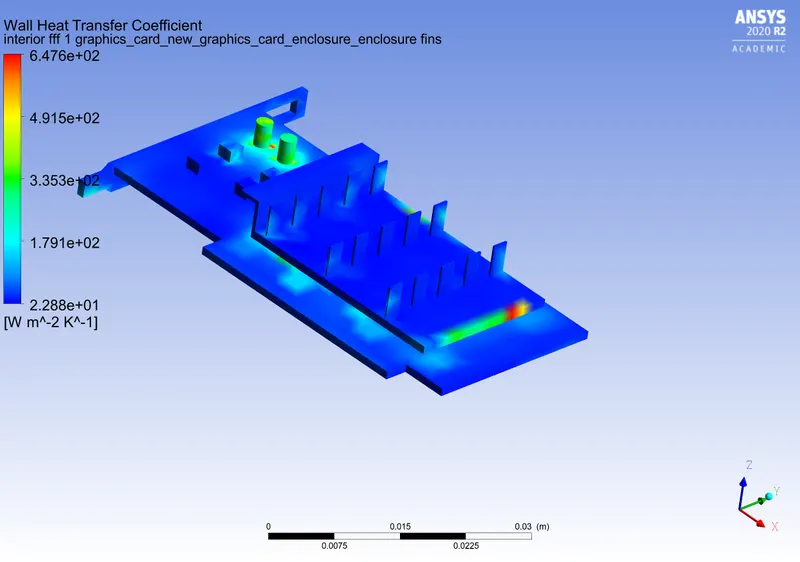
Wall heat transfer coefficient.
CASE 2.
For velocity 3m/s.
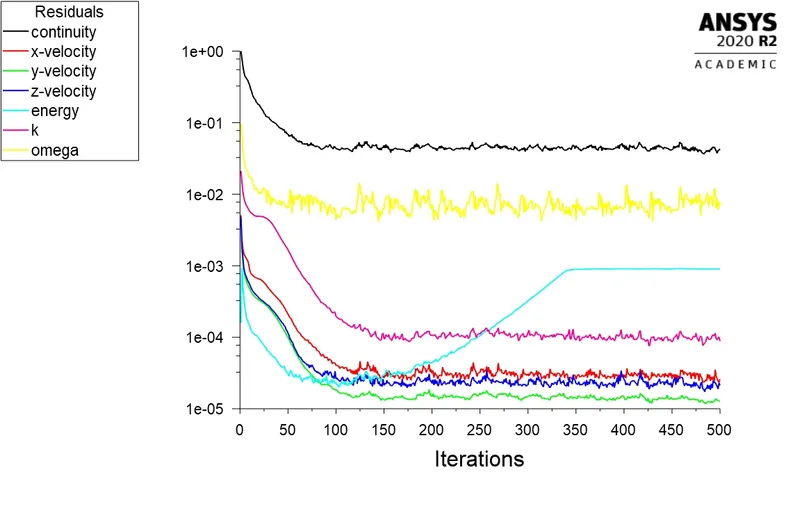
Residuals.
In the graph, ew can observe that the solution has converged after 350 iterations.
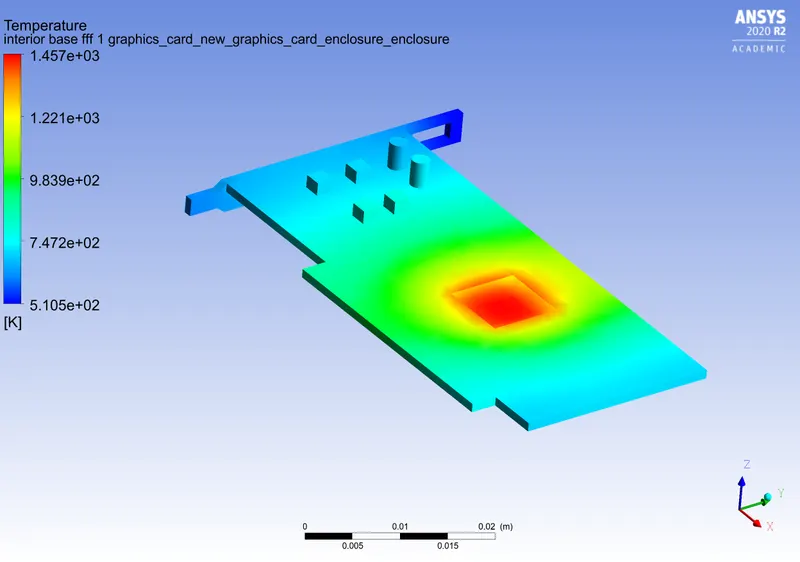
Temperature Hotspot.
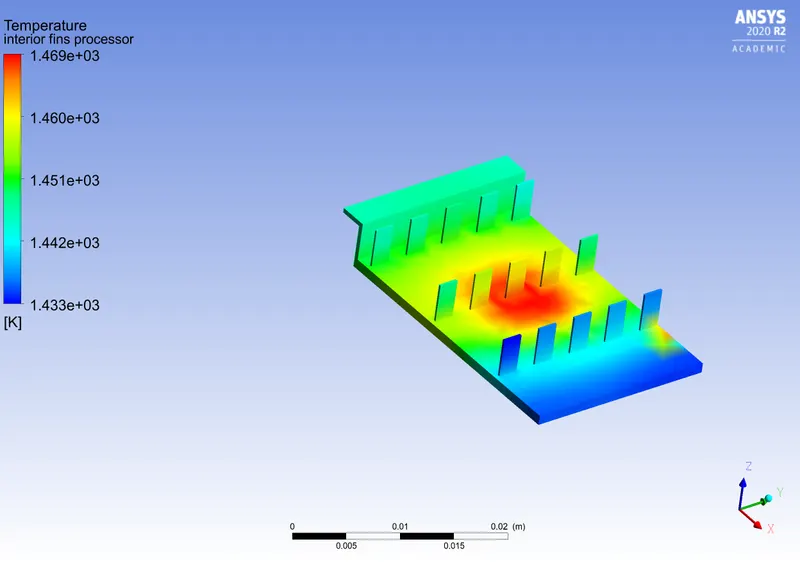
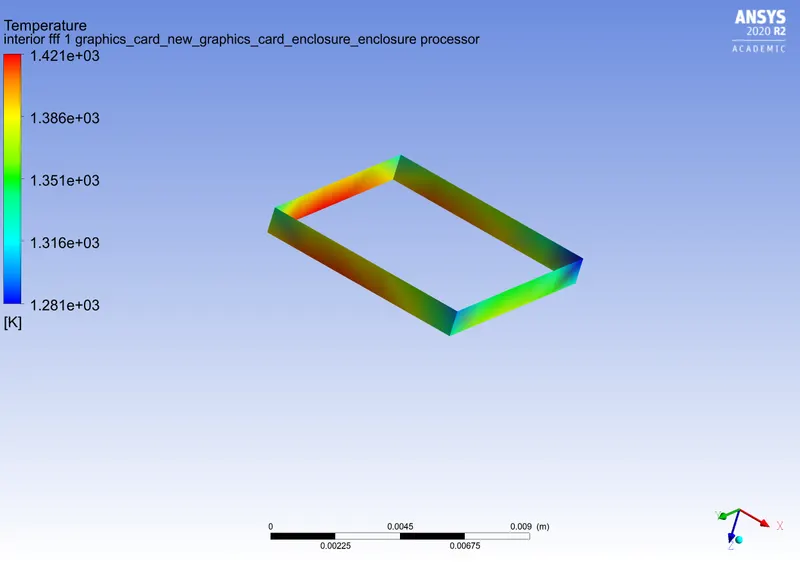
Temperature at processor.
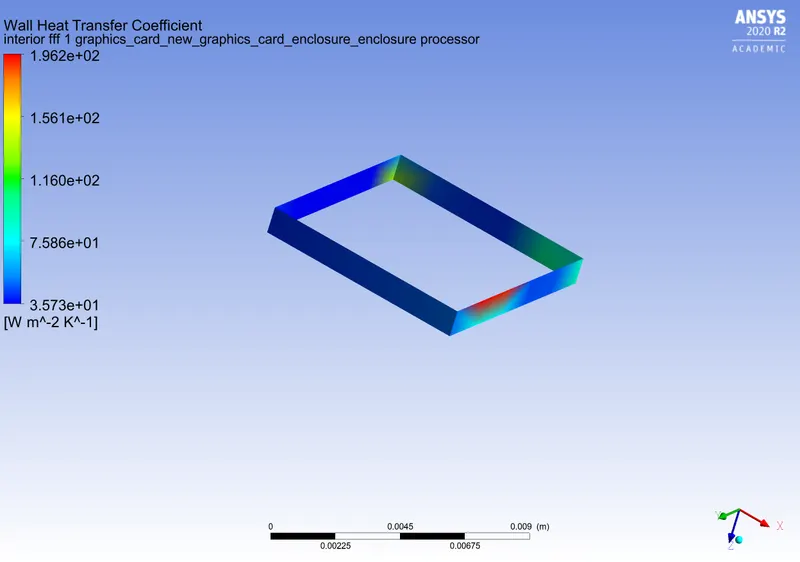
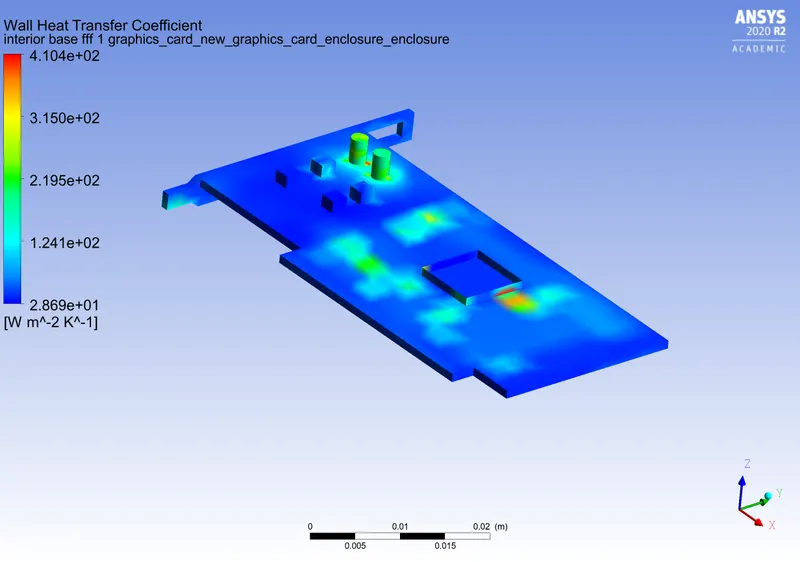
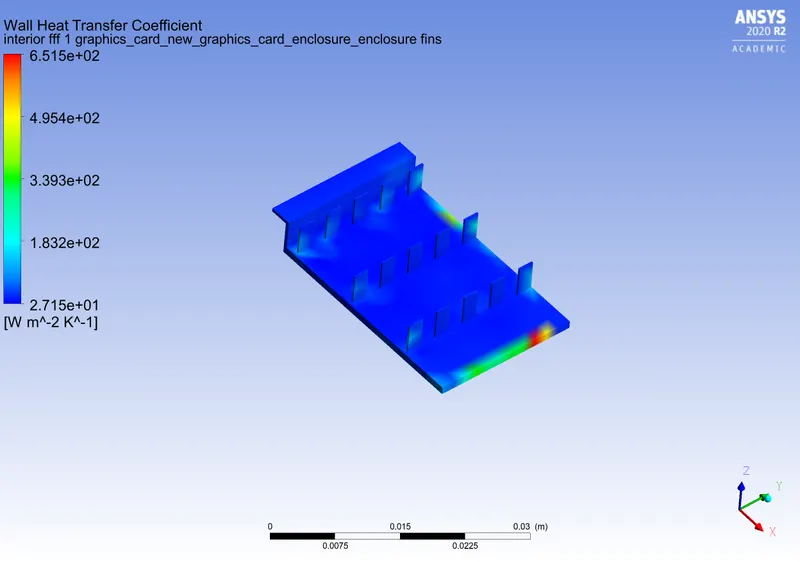
Wall heat transfer coefficient.
CASE 3.
For velocity 5m/s.
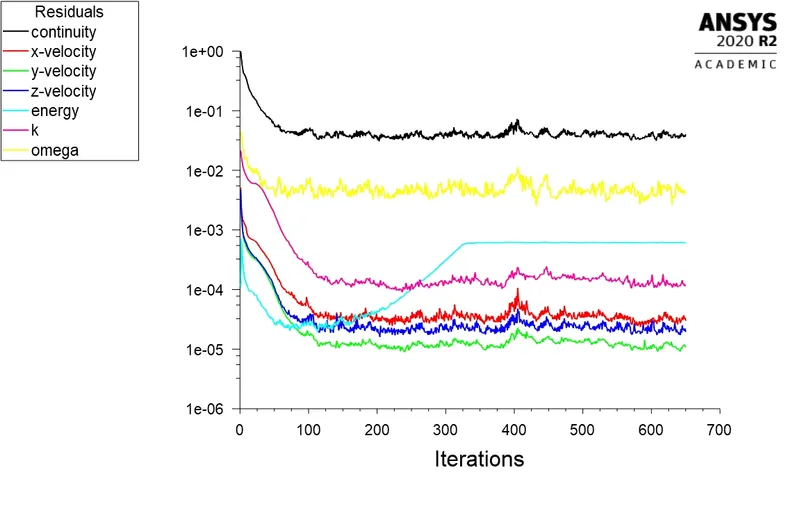
Residuals.
In the graph, we can observe that the resolution has converged after 300 iterations.
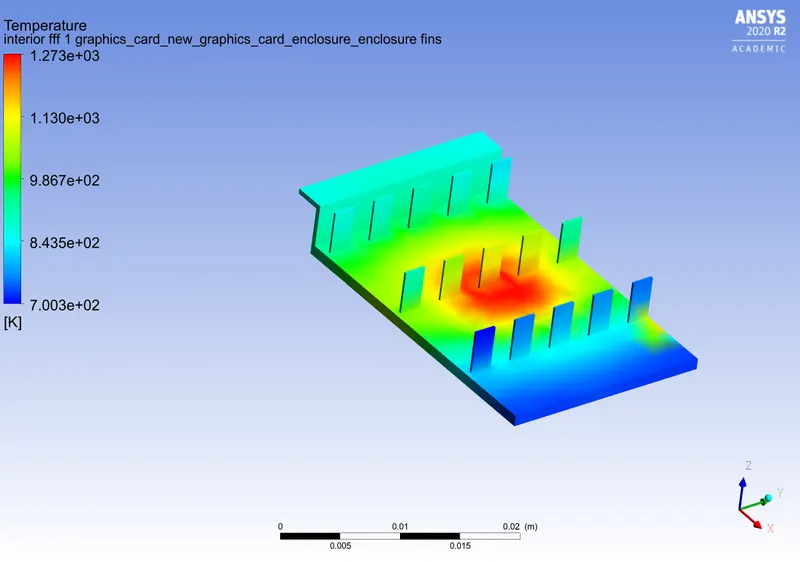
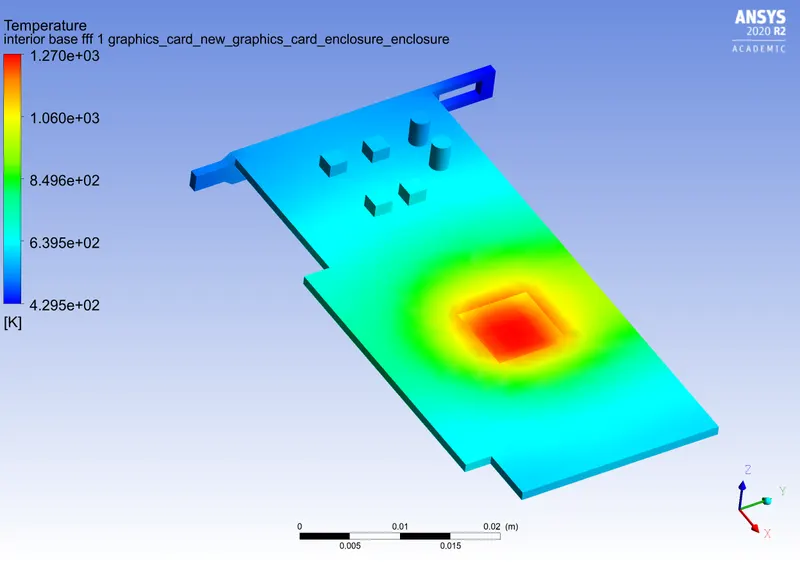
Temperature Hotspot at base and fins.
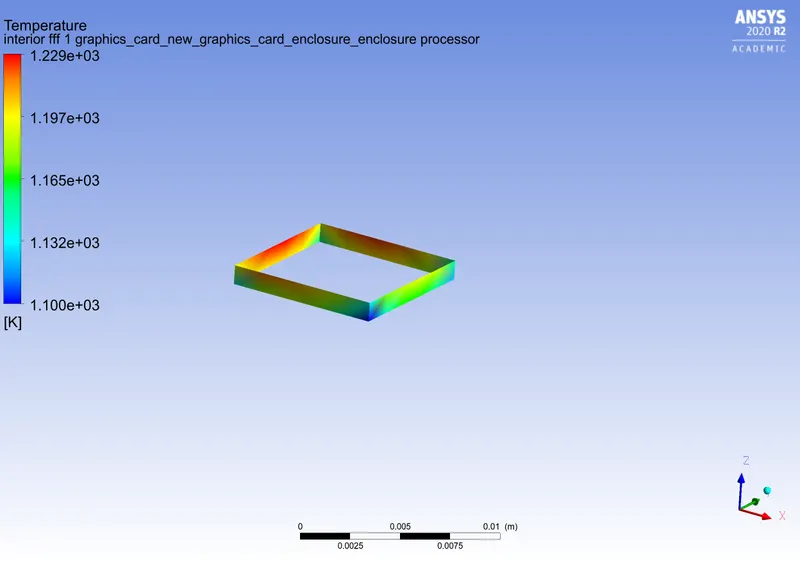
Temperature at processor.
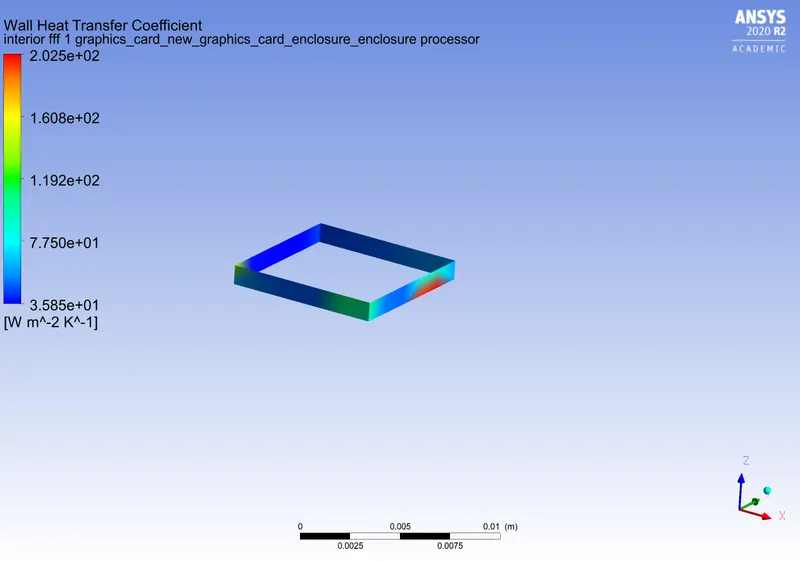
Wall heat transfer coefficient.
| Mesh | Fluid flow velocity(m/s) | Maximum temperature(K) | Maximum Wall heat transfer coefficient(W/m^2) |
| Coarse mesh | 1 | 2092 | 80 |
| Refined mesh | 1 | 2076 | 190 |
| Refined mesh | 3 | 1421 | 196 |
| Refined mesh | 5 | 1229 | 202 |
From the above table, we can observe that the temperature produced by the processor is decreasing as the fluid flow velocity is increased this is because the heat is carried away by air and also we can observe that the Wall heat transfer coefficient is increasing as the temperature decreases and velocity increases and in the Refined mesh simulation we can get more accurate results.
Conclusion.
- The refined mesh provides more accurate results compared to the coarse mesh. This accuracy can be increased by increasing the number of mesh elements.
- The temperature of the graphic card assembly decreases with the increase in fluid flow velocity because as the velocity of flow increases, more heat is carried away by it, hence cooling the graphic card.
- The highest wall heat transfer coefficient was obtained near the processor walls. This region is not affected by the fluid flow, since these walls are in contact with each other and there is no space for air to flow in between them. In the regions which experience fluid flow, the wall heat transfer coefficient increases with the increase in fluid flow velocity.
- The processor is the potential hotspot of the graphic card assembly since it is the only heat generating part of the entire assembly. The temperature and wall heat transfer coefficients of the processor and other parts are influenced by the heat generated by the processor. Also, the heat generated by the processor depends on its workload. Higher the workload, the higher the heat generated by the processor.