Week-6 Calculate the Stretch Ratio by comparing the ELFORM (-2,-1,1,2) with Ogden_Material Model.
Aim:
Create a 10x10x10mm solid mesh and run a pure tensile run on it with stretch ratio of 5. Compare different element formulations of solids 1,-1,2,-2 and plot engineering stress vs stretch values. with a gven material card which is hyperelastic (rubber)
Explanation:
- Since this simulation is happening at a really slow pace (quasi static) the inertial effects can be neglected we can consider implicit for the analysis.
- Since this a hyperelastic material even though we are running it in implicit , we need steps and iterations to achieve the equilibruim.
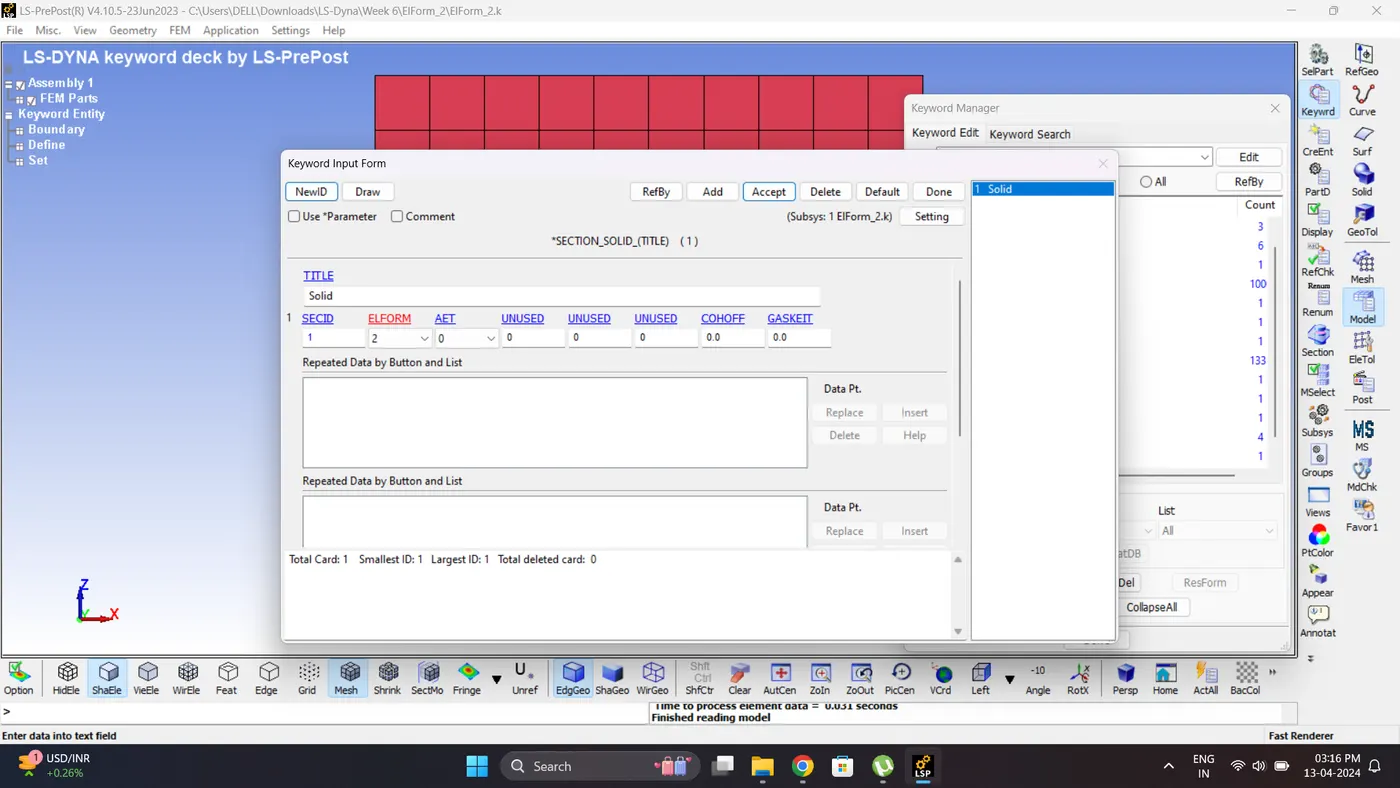
- Element formulations used are 1,-1,2,-2 for solids.
- ELFORM 1 - underintegrated constant stress ; needs hourglass stabilisation; efficient and accurate
- ELFORM 2 - Reduced integrated ; no hour glass stabilisation needed; slower than ELFORM 1; shear locking can occur
- ELFORM(-1 )- Similiar to ELFORM 2 , but shearlocking is accounted for; efficient formulation (CPU time)
- ELFORM (-2) - Similiar to -1 , more accurate, more computational cost.
Procedure:
Case 1:
1. Import the .k file. Go to File - Import - LS-DYNA Keyword File.
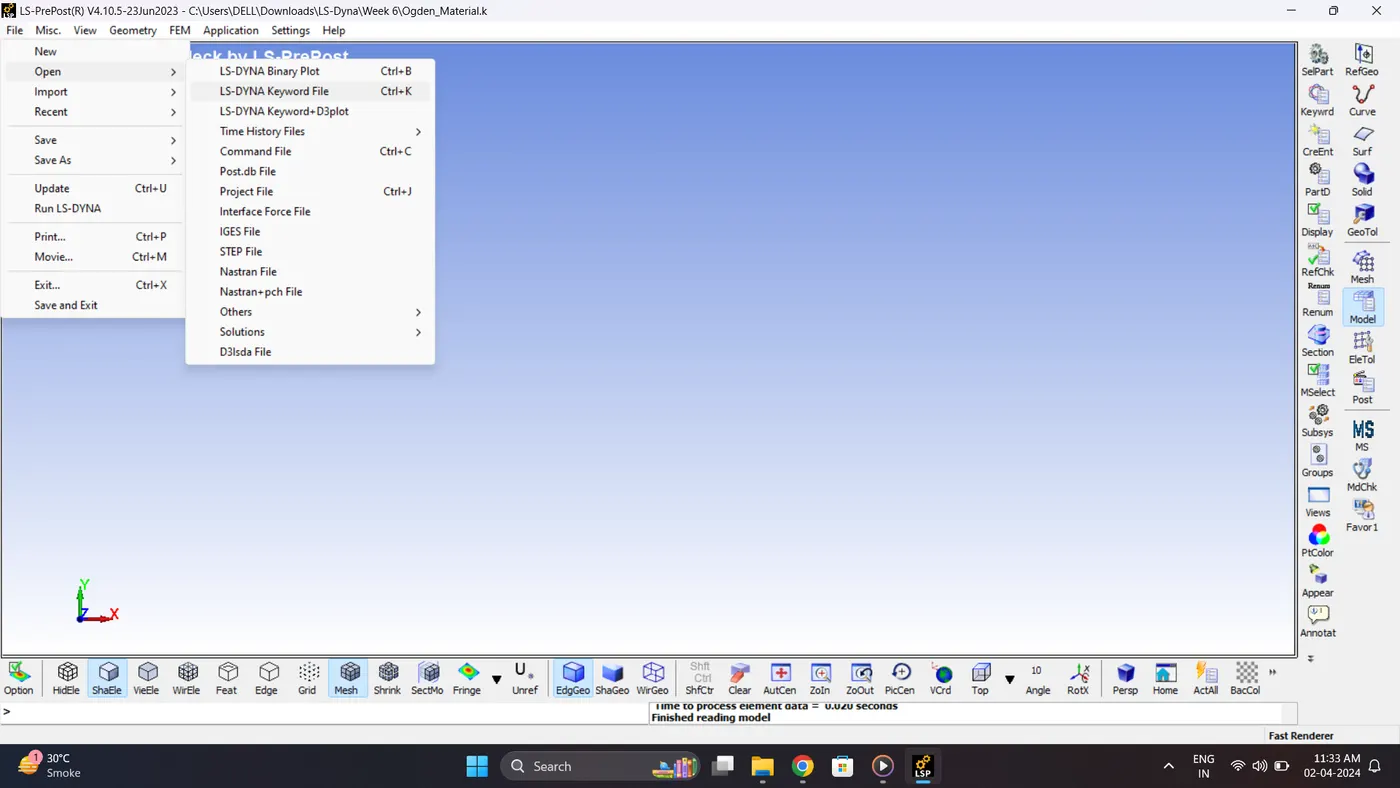
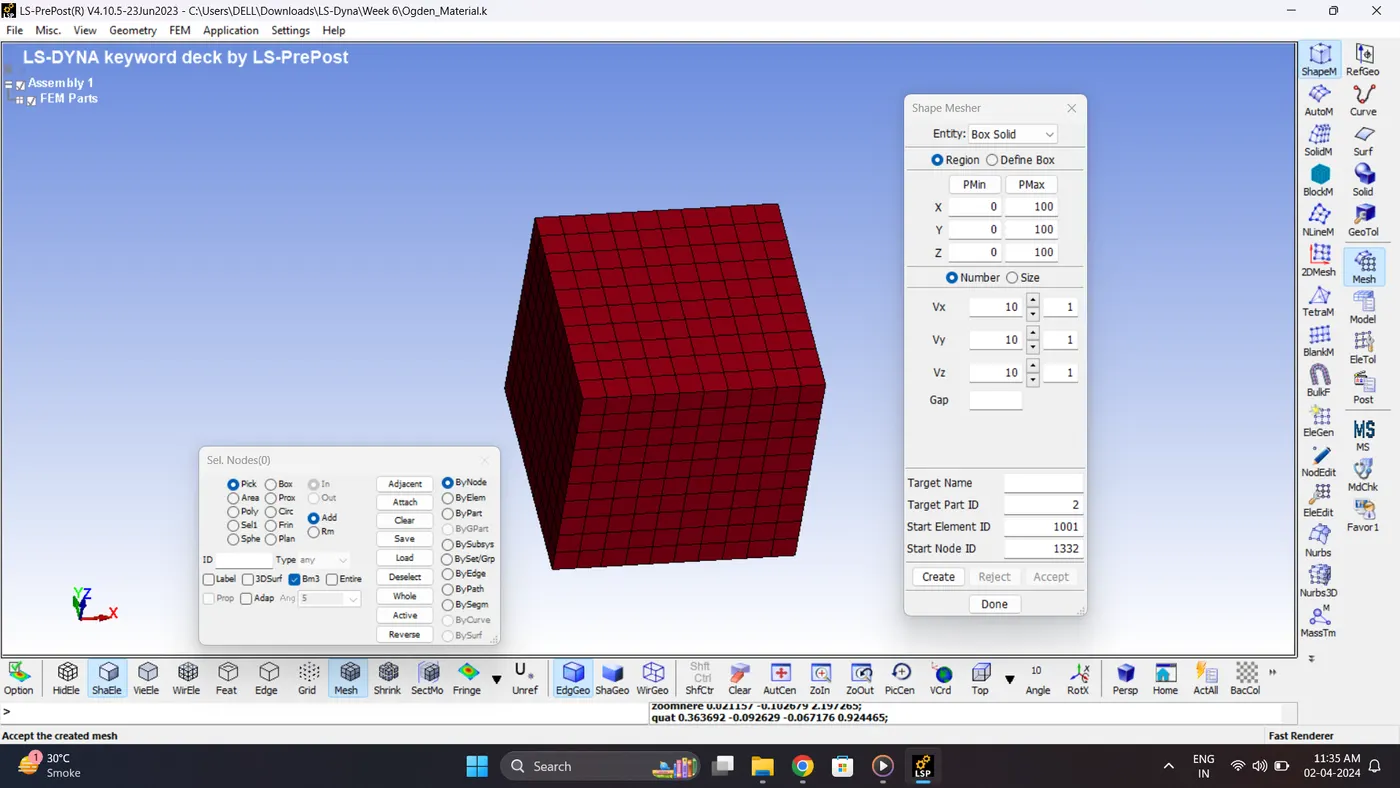
2. Create the cube of size 10mm X 10mm X 10mm.
Go to Mesh - Shape Mesher - Give dimension - Click create.
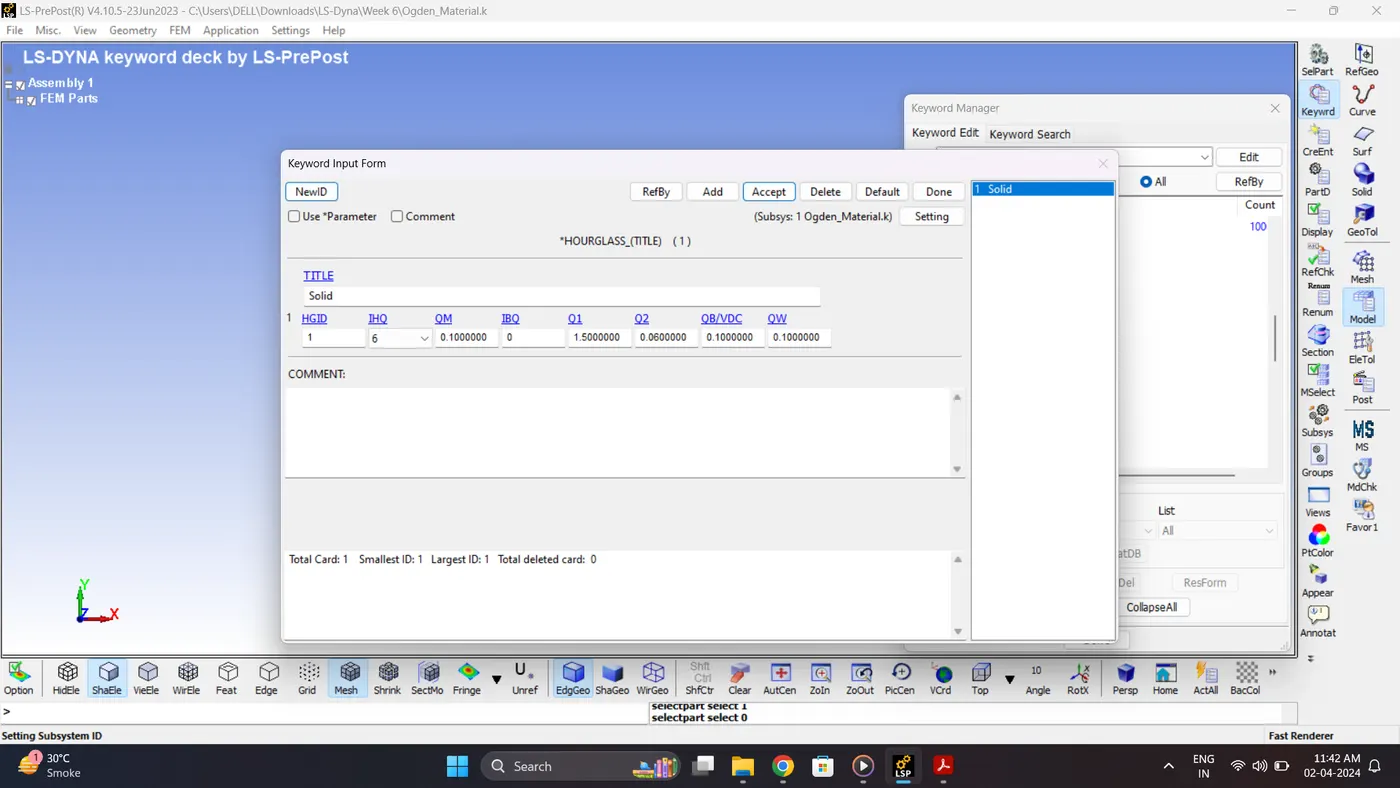
3. Create a Hourglass control card. Go to Model - Keyword Manger - Hourglass.
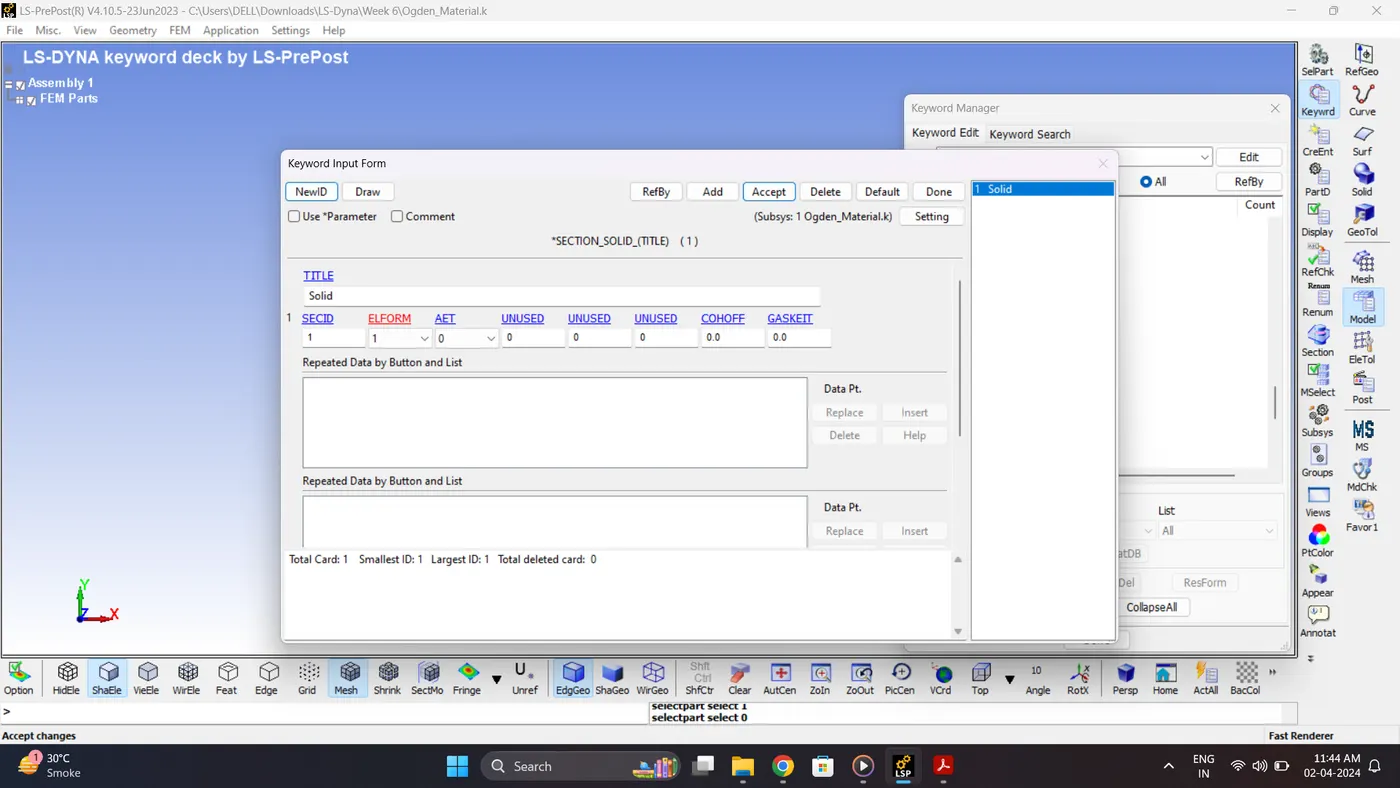
4. Create a section for solid. Go to Model - Keyword Manger - Section - Solid.
5. Check materail card. Go to Model - Keyword Manger - MAT.
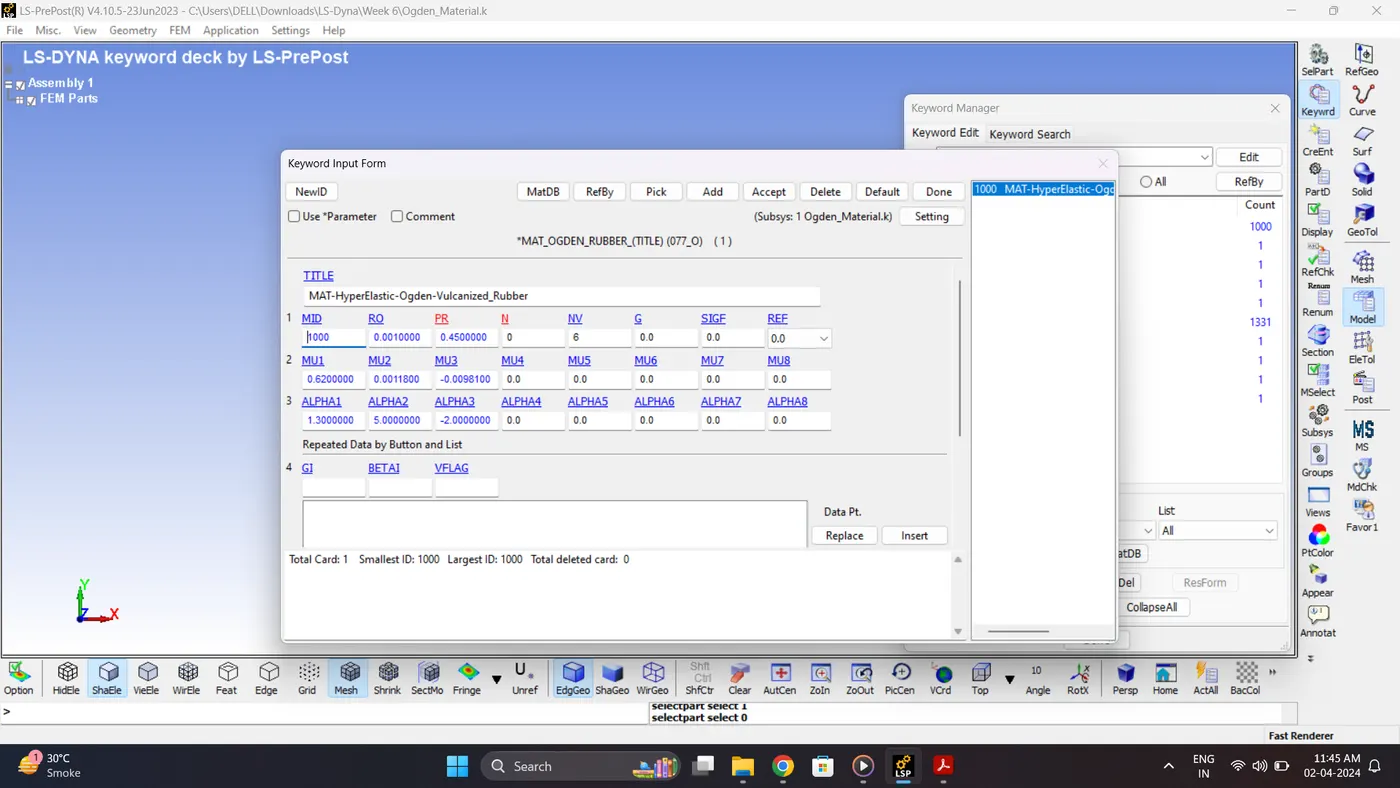
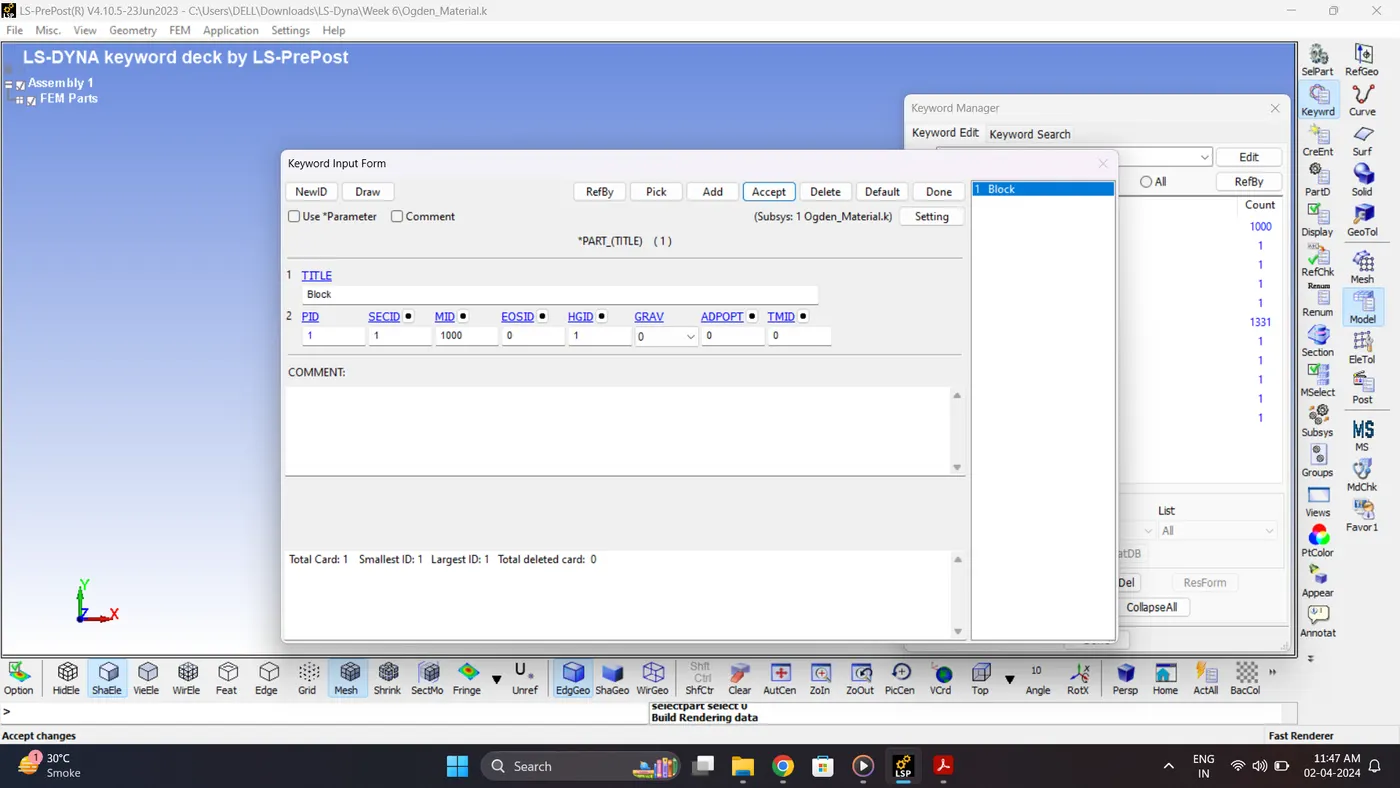
6. Assign section, Material, Hourglass to Part Block.
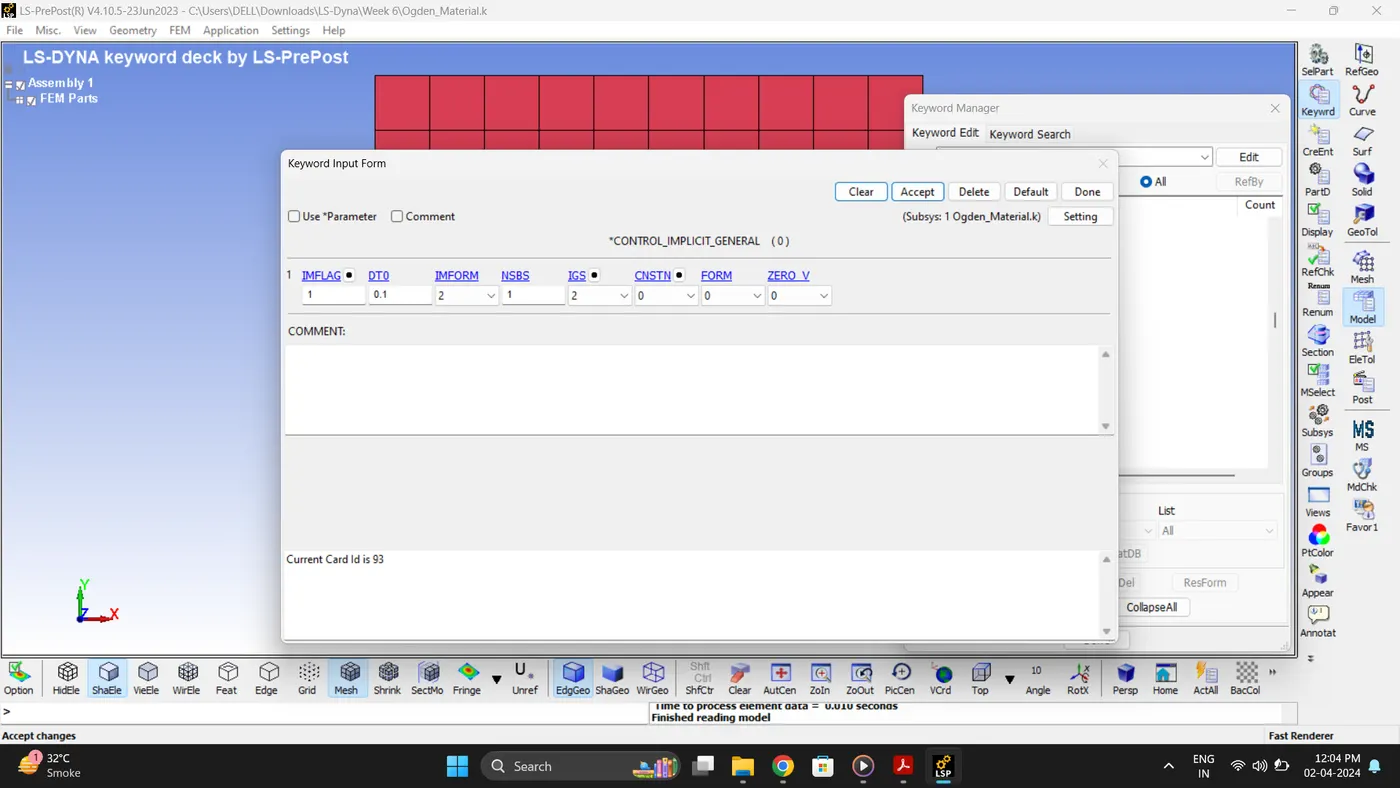
7. Create a Control Termination, Implicit General and Implicit Auto card. Go to Model - Keyword Manager - Control.
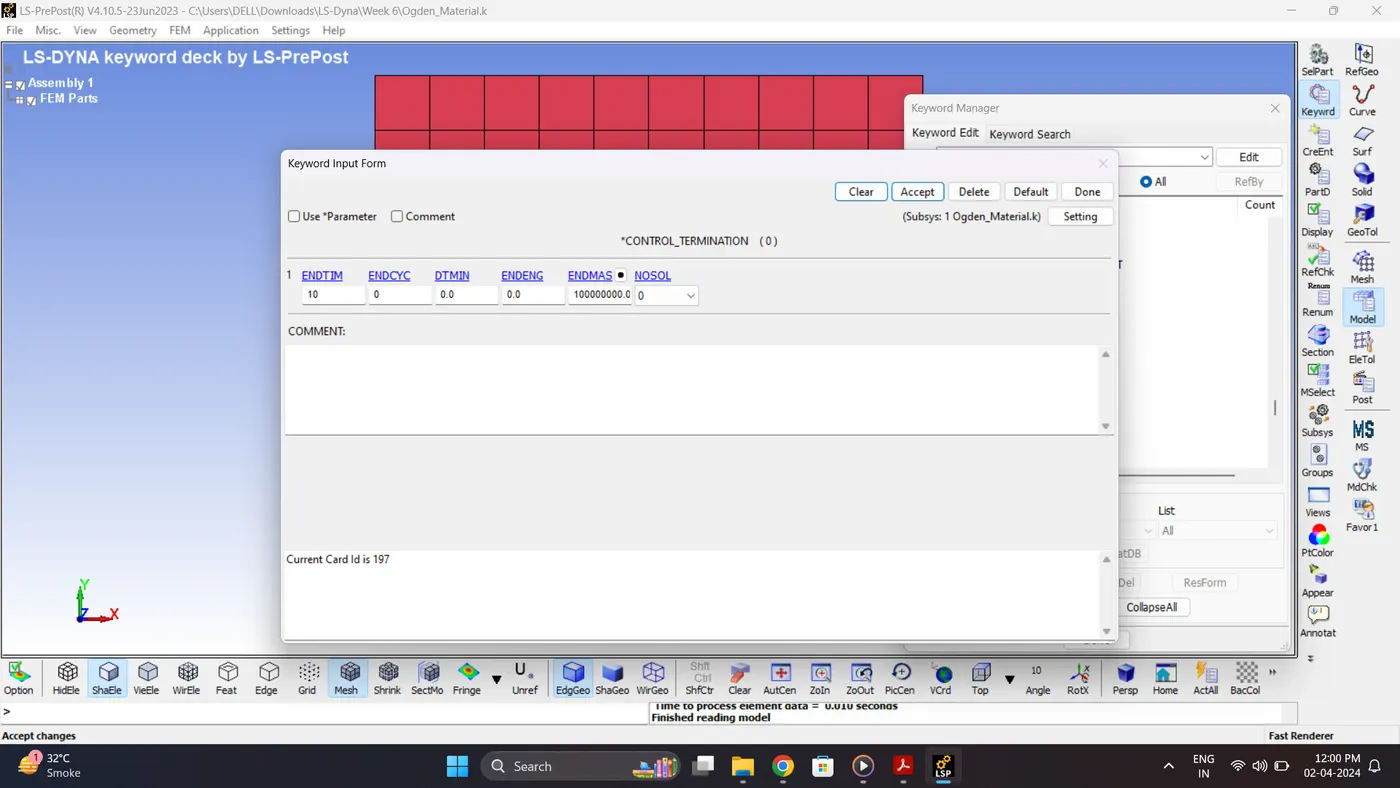
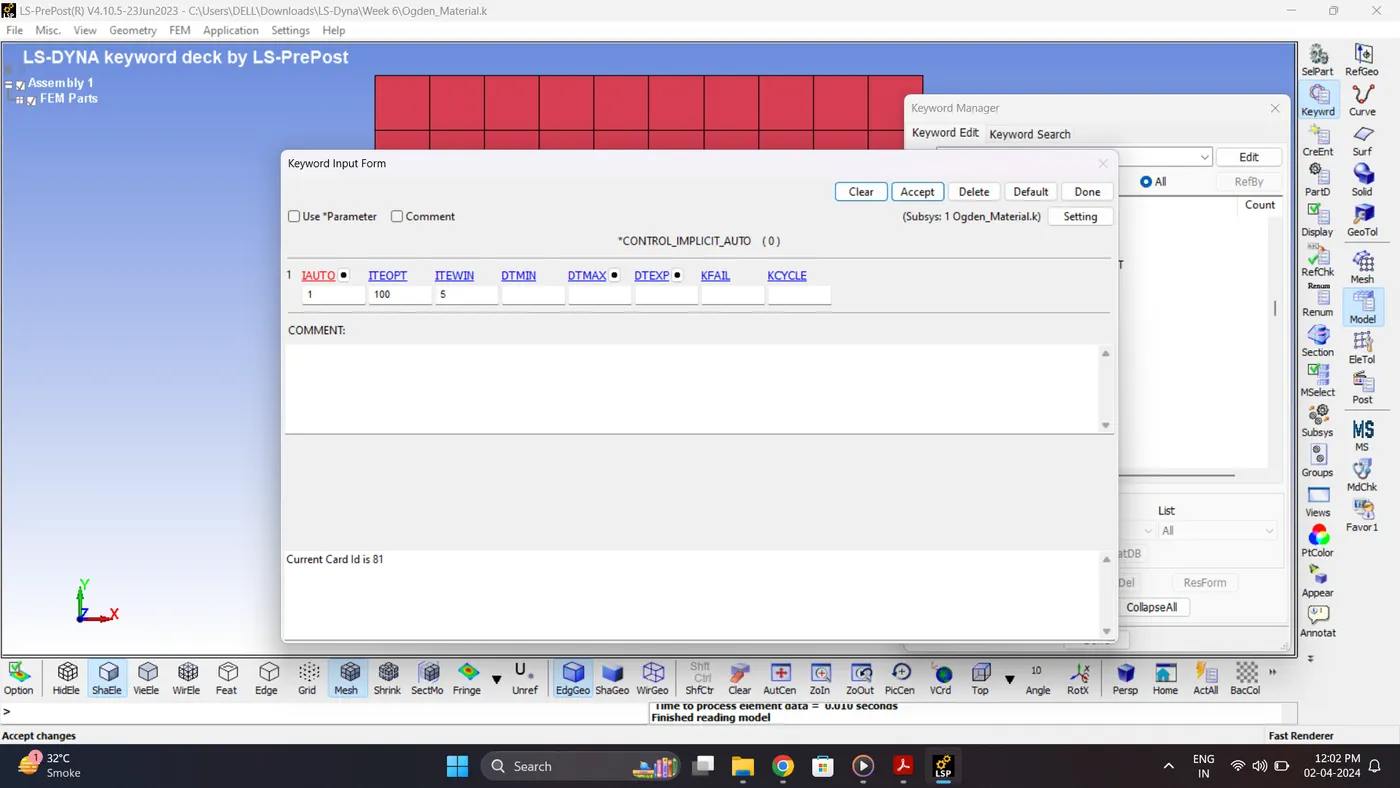
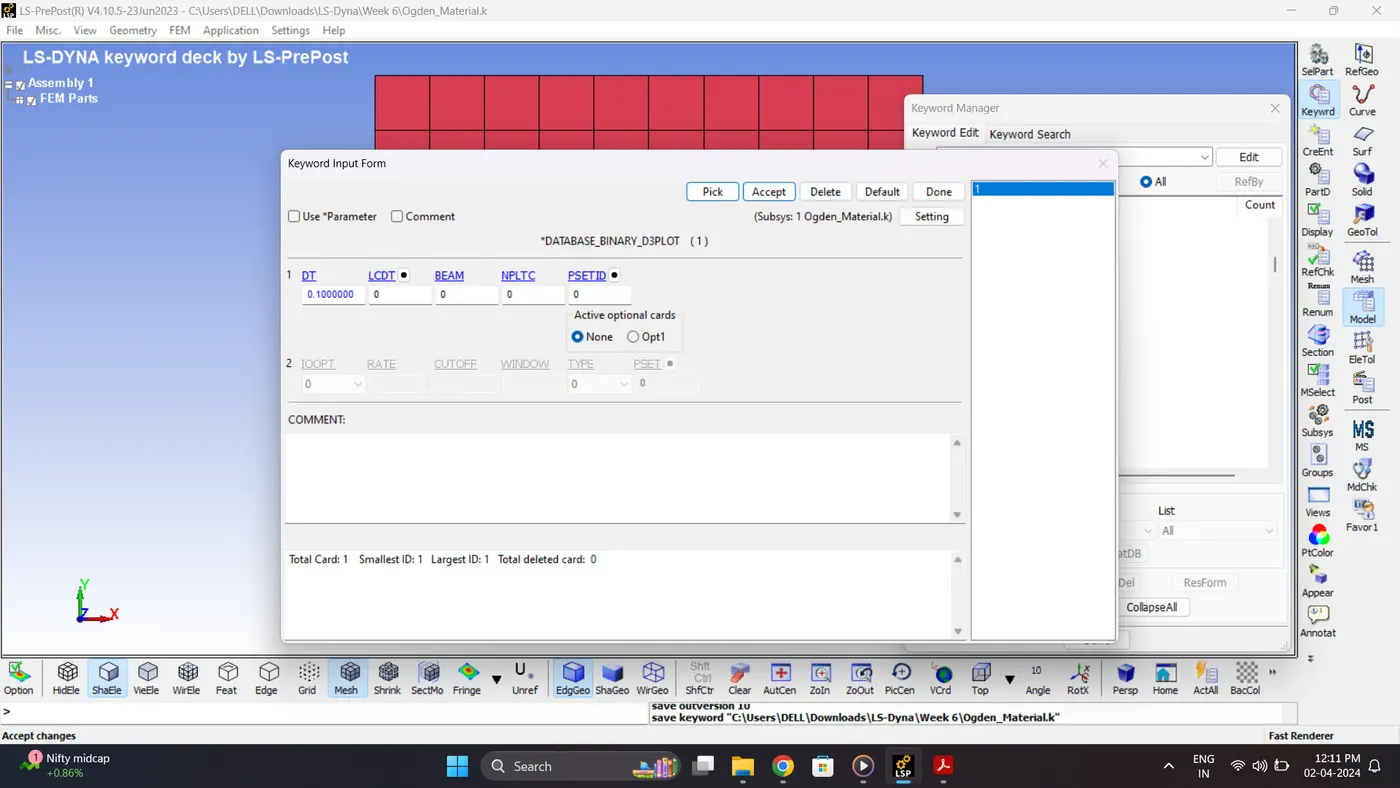
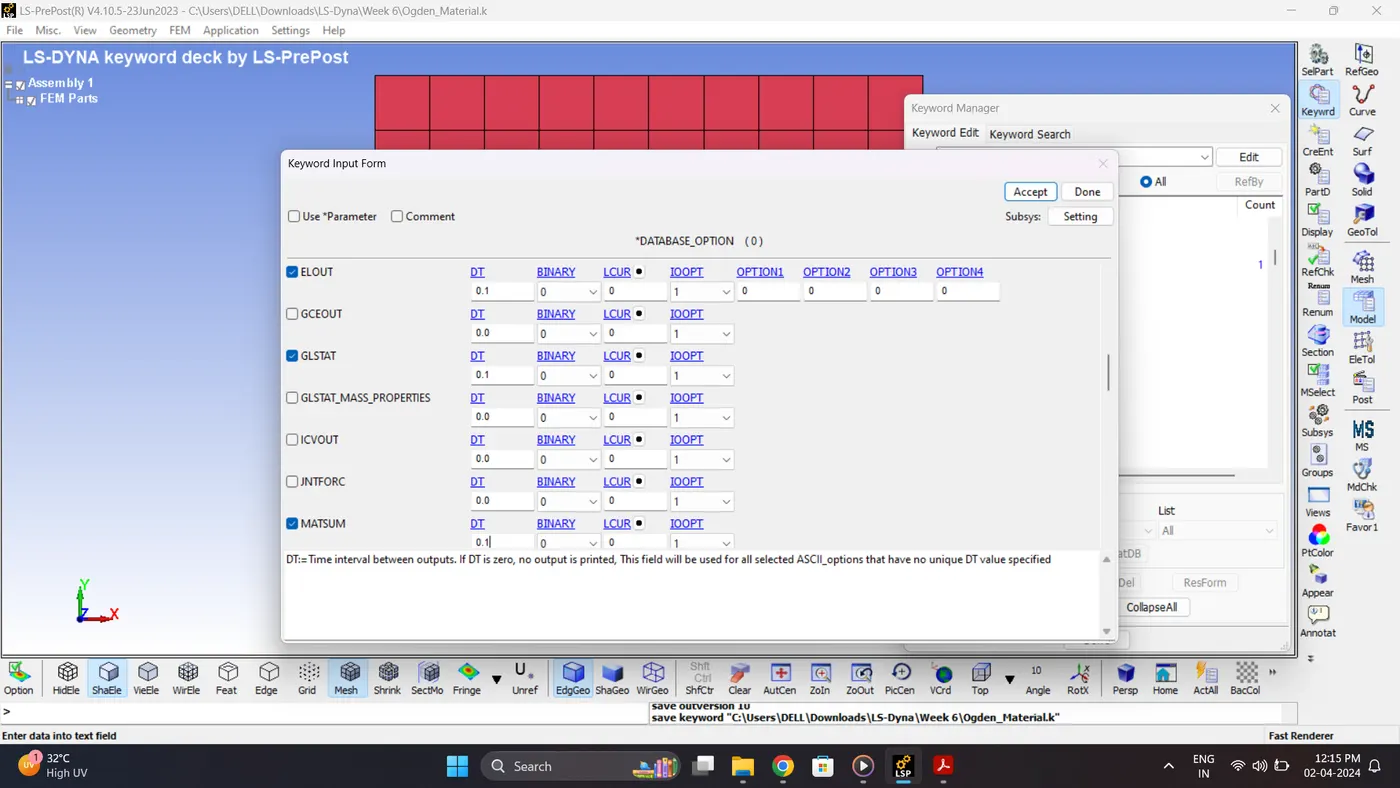
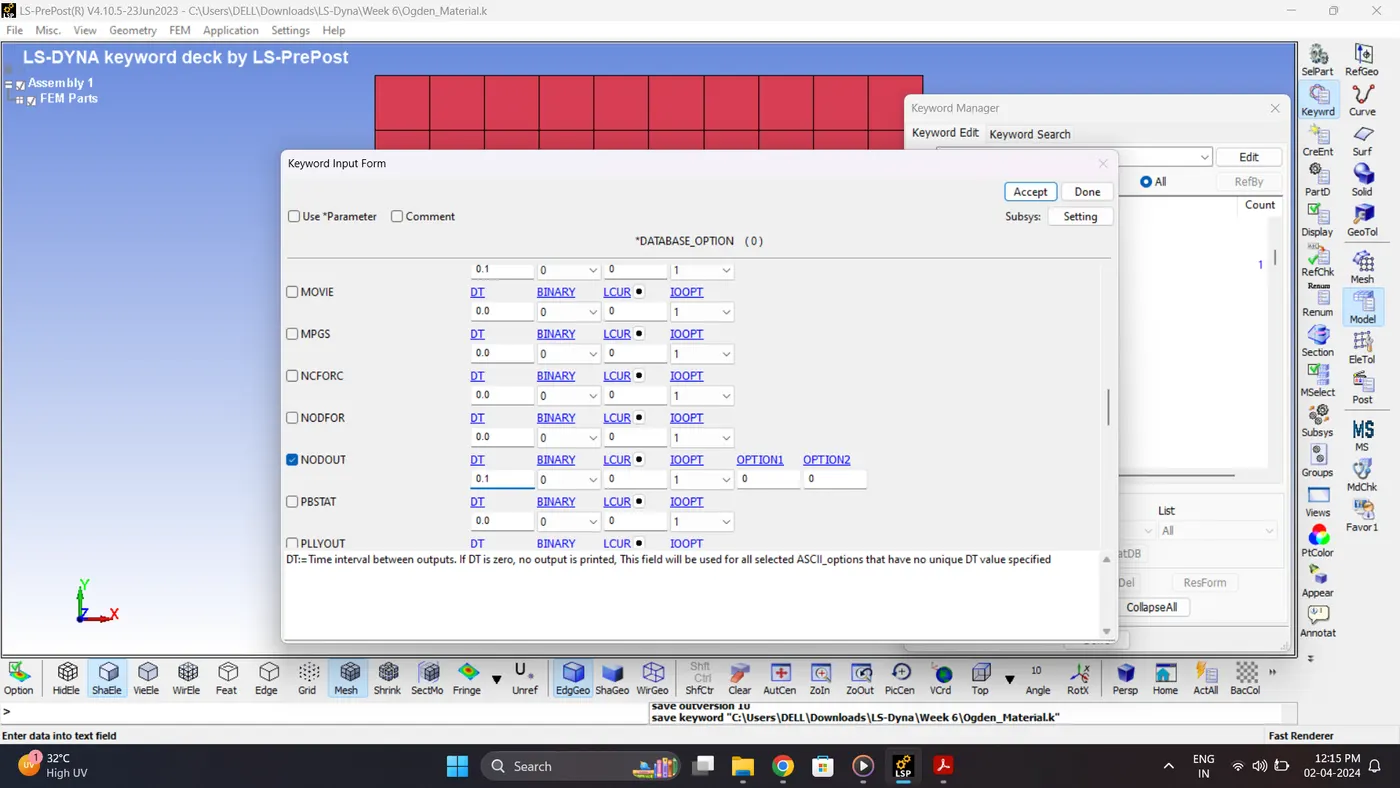
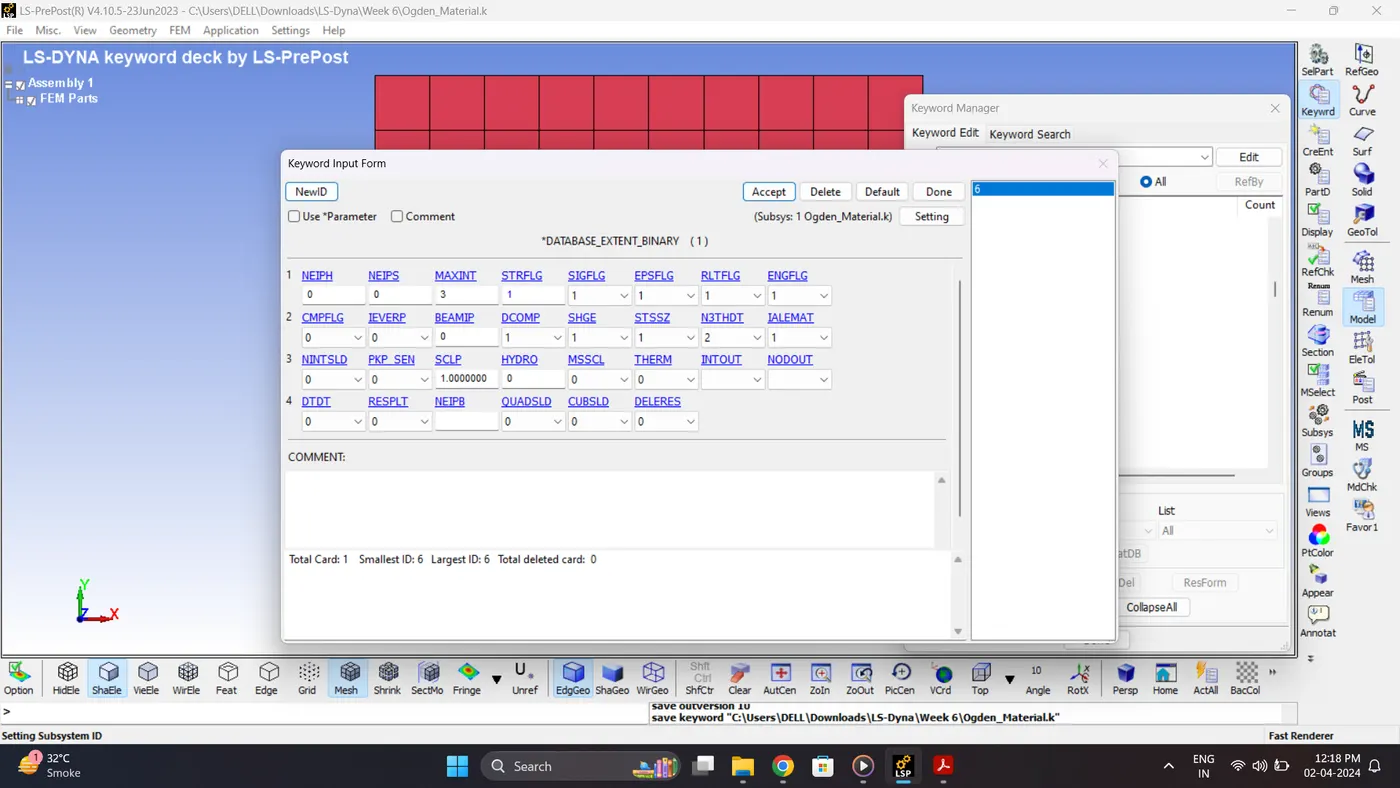
8. Create a Output request card. Go to Model - Keyword Manager - Database - ASCII_option / D3Plot / Extent Binary.
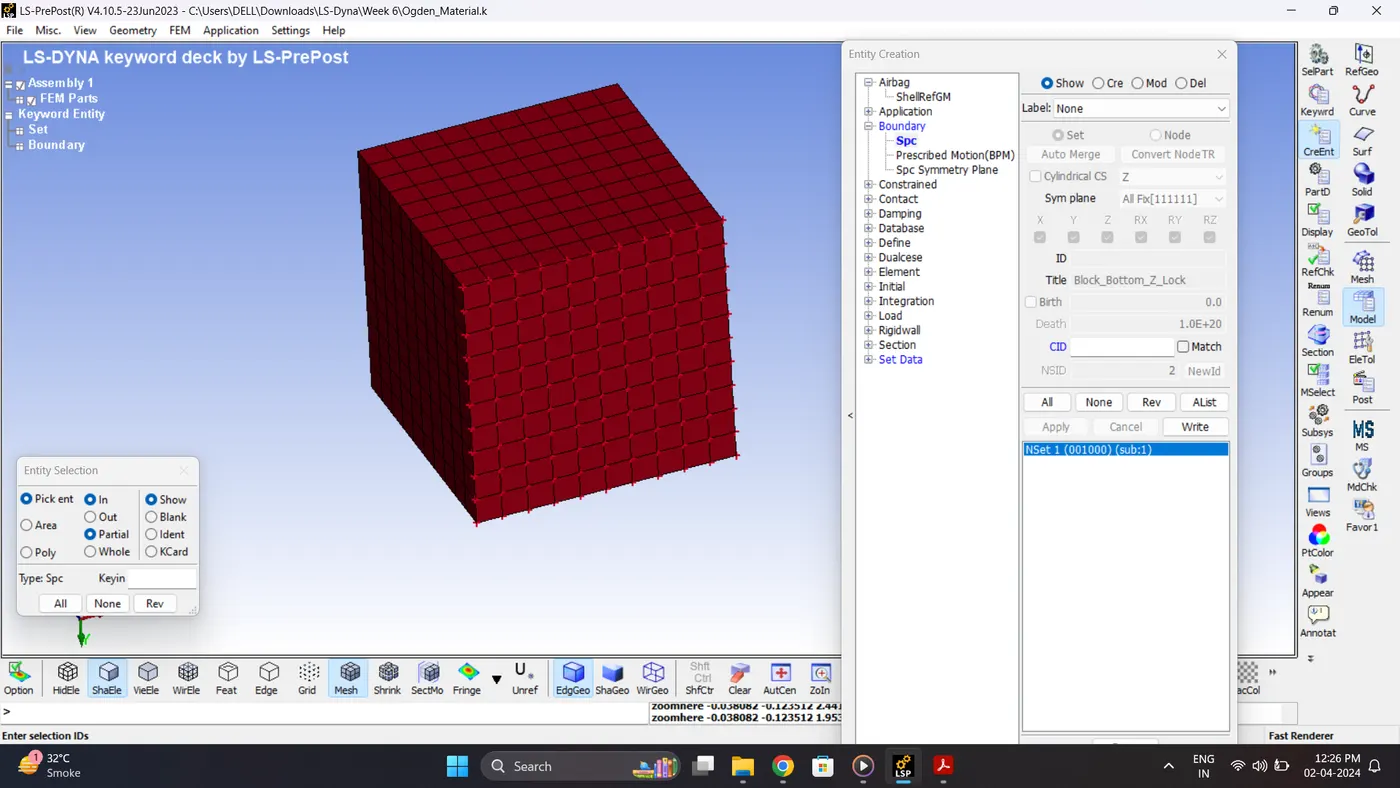
9. Create a SPC Boundary conditions to lock Z DOF of Bottom Nodes. Go to Model - Create Entity - Boundary - SPC.
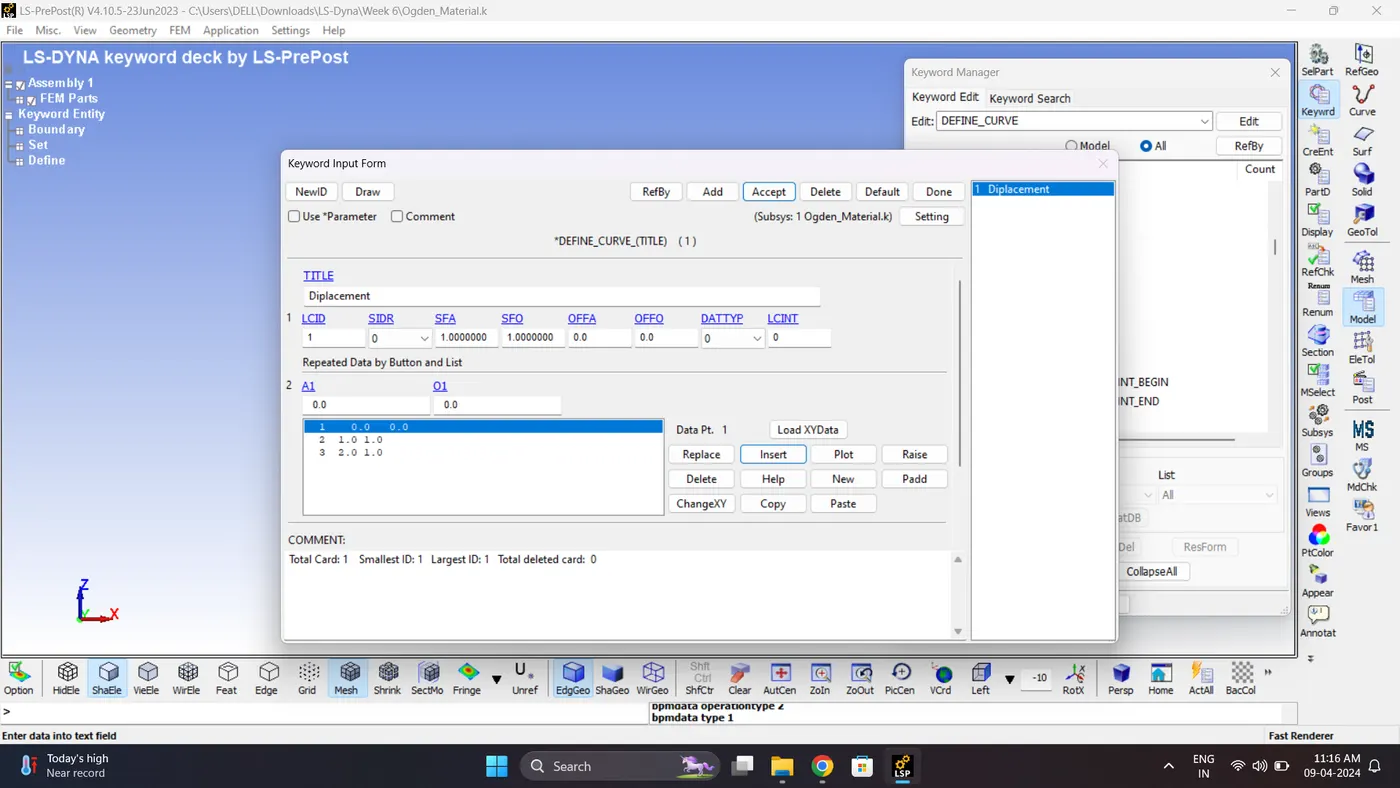
10. Create Curve for the displacement and Node set.
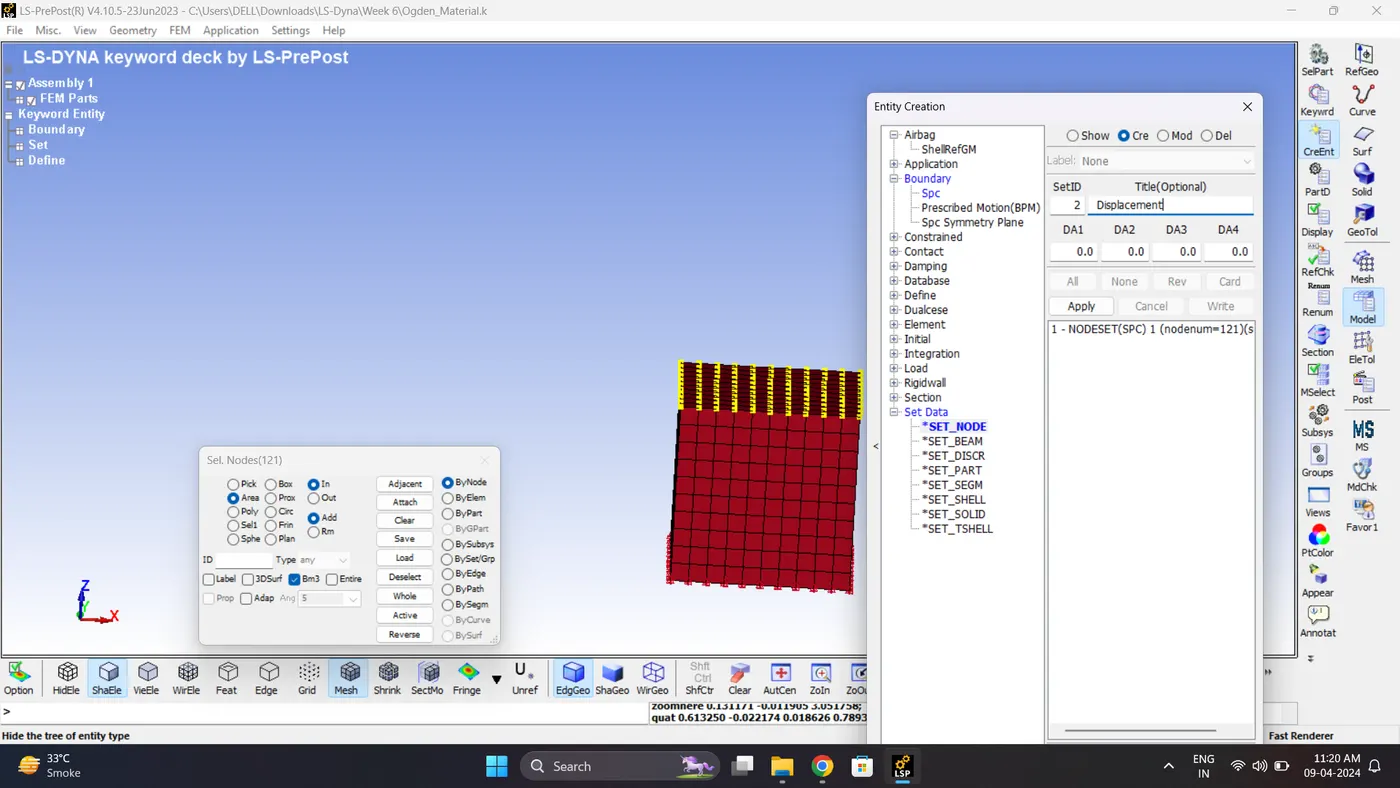
11. Create Prescribed motion.
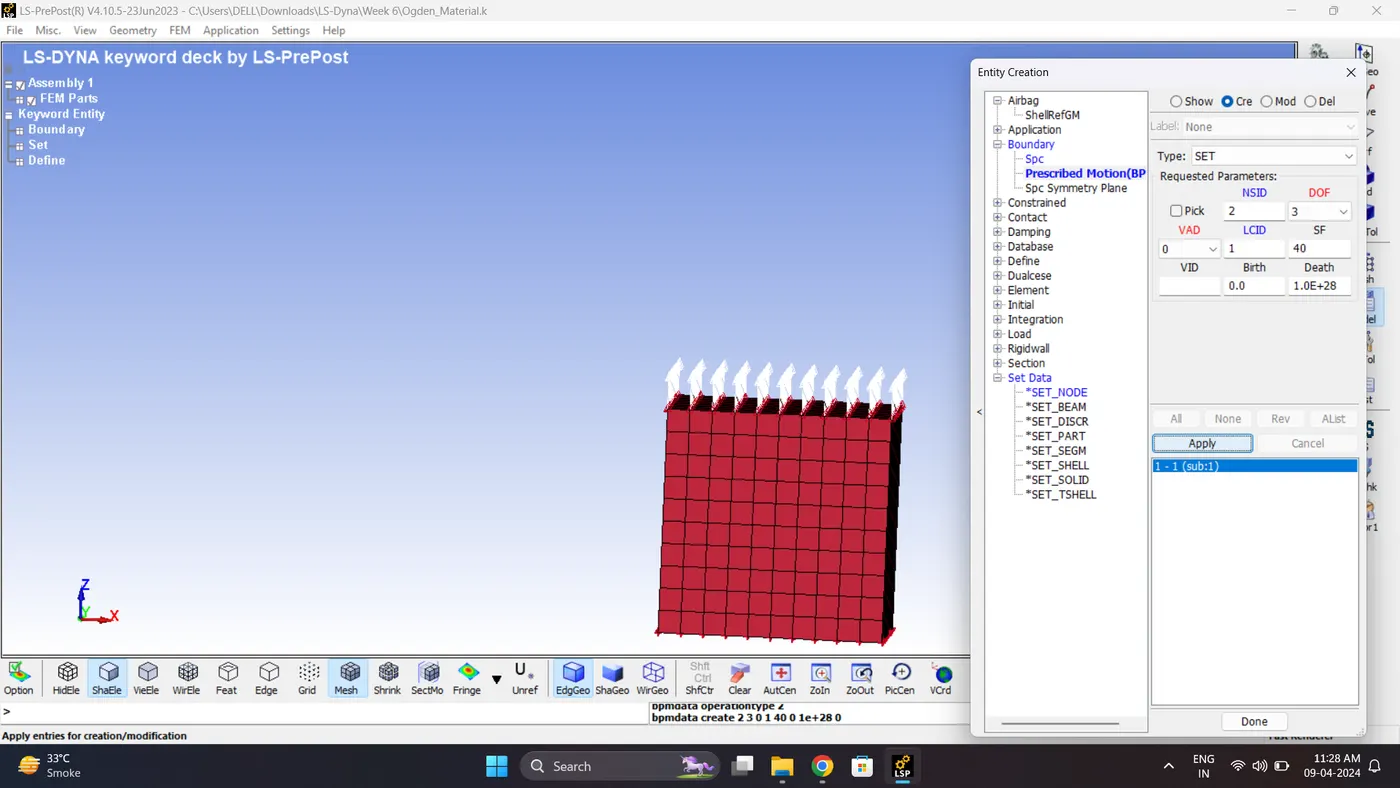
12. Run the Model Checker.
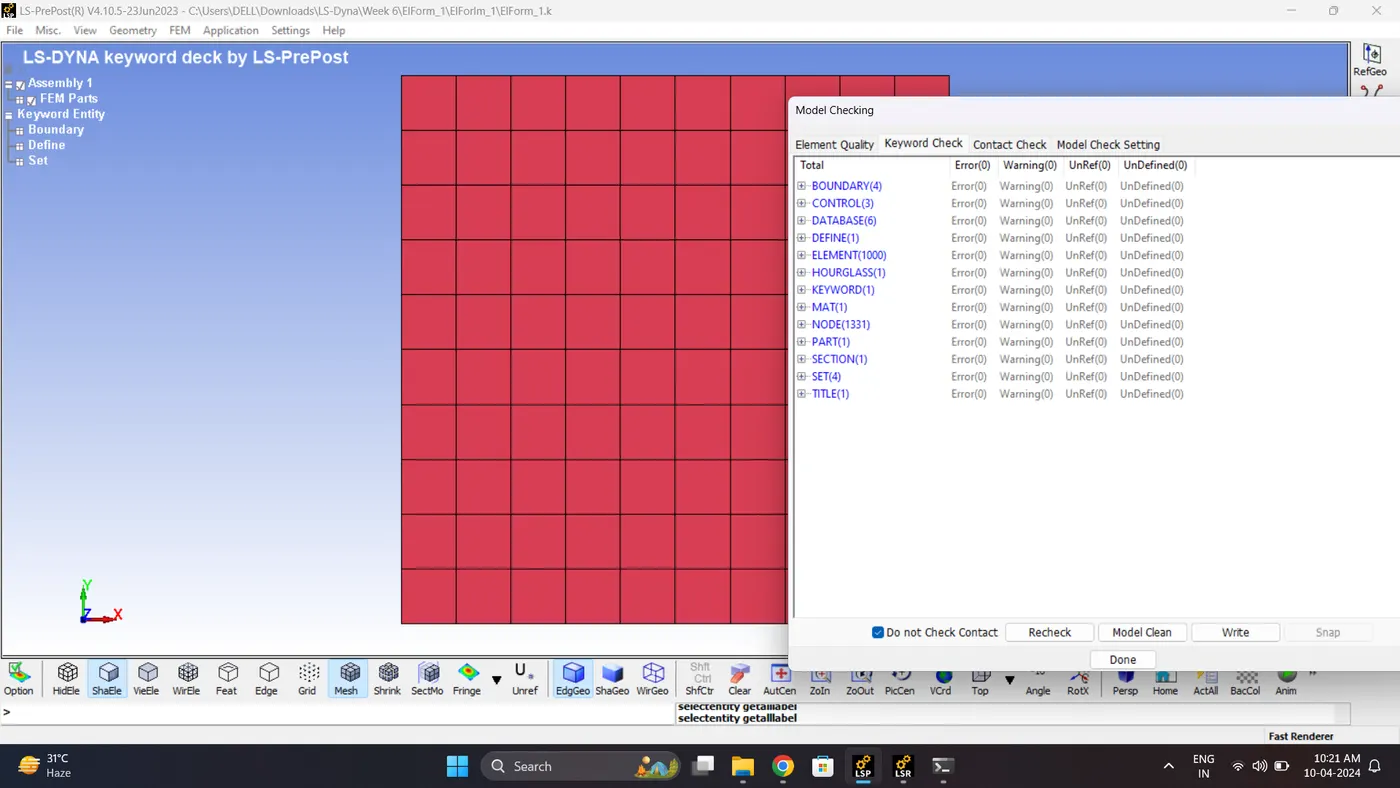
13. Save the File and Run the Simulation. Open LS_Run - Select File - Click Add job to local queue.
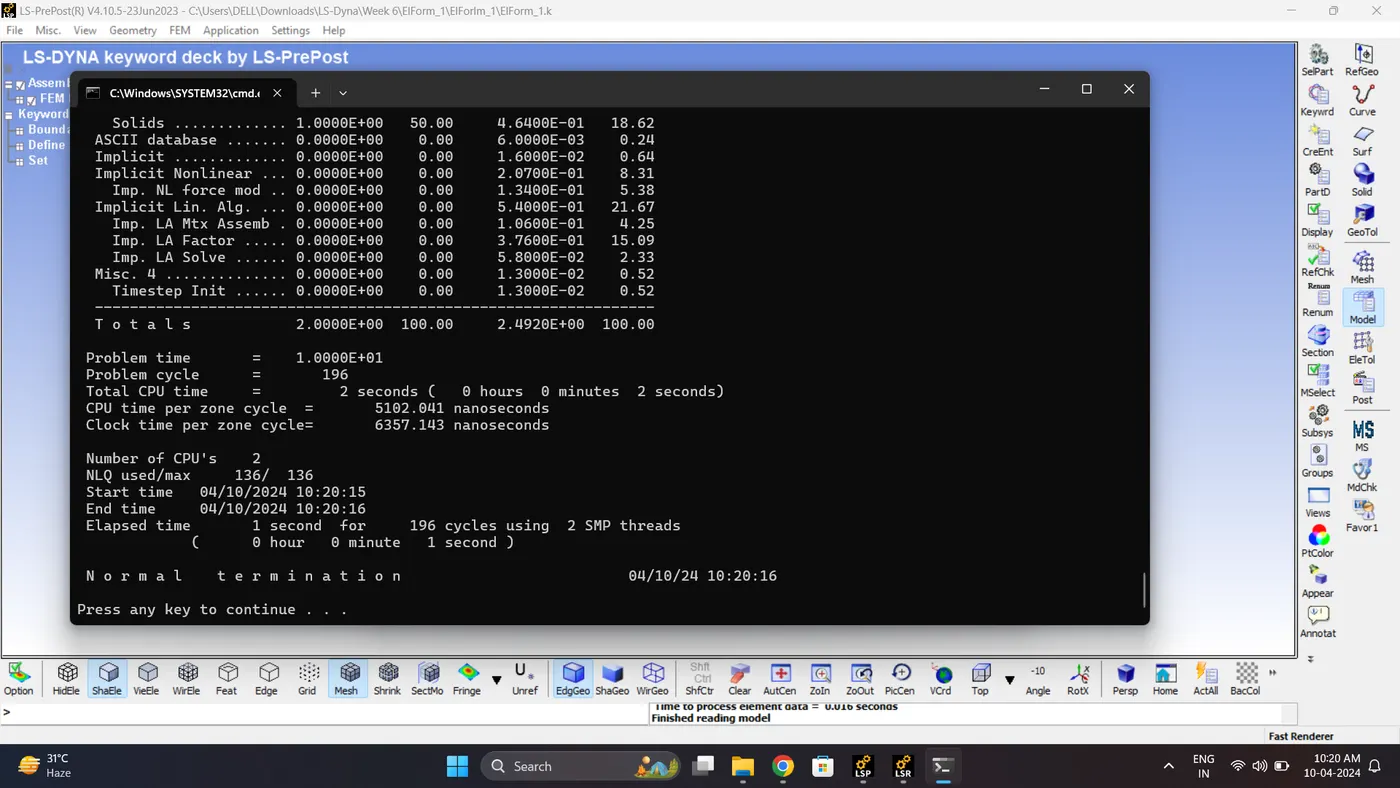
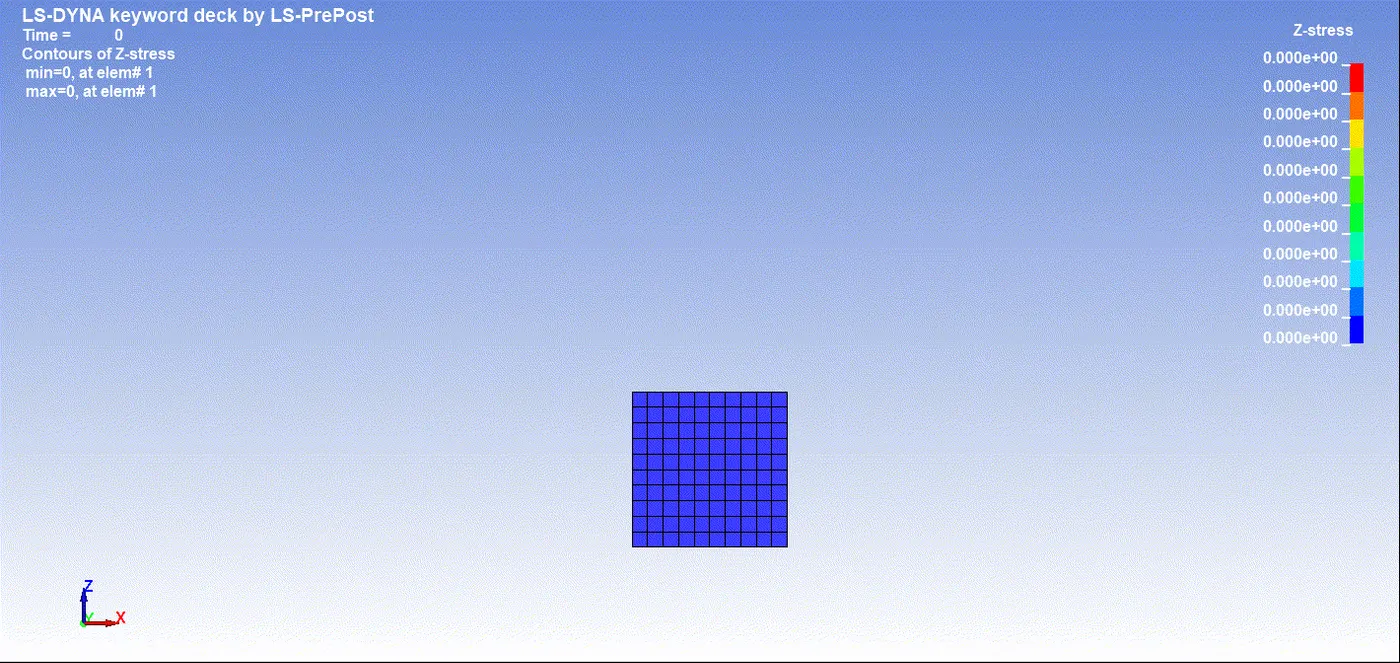
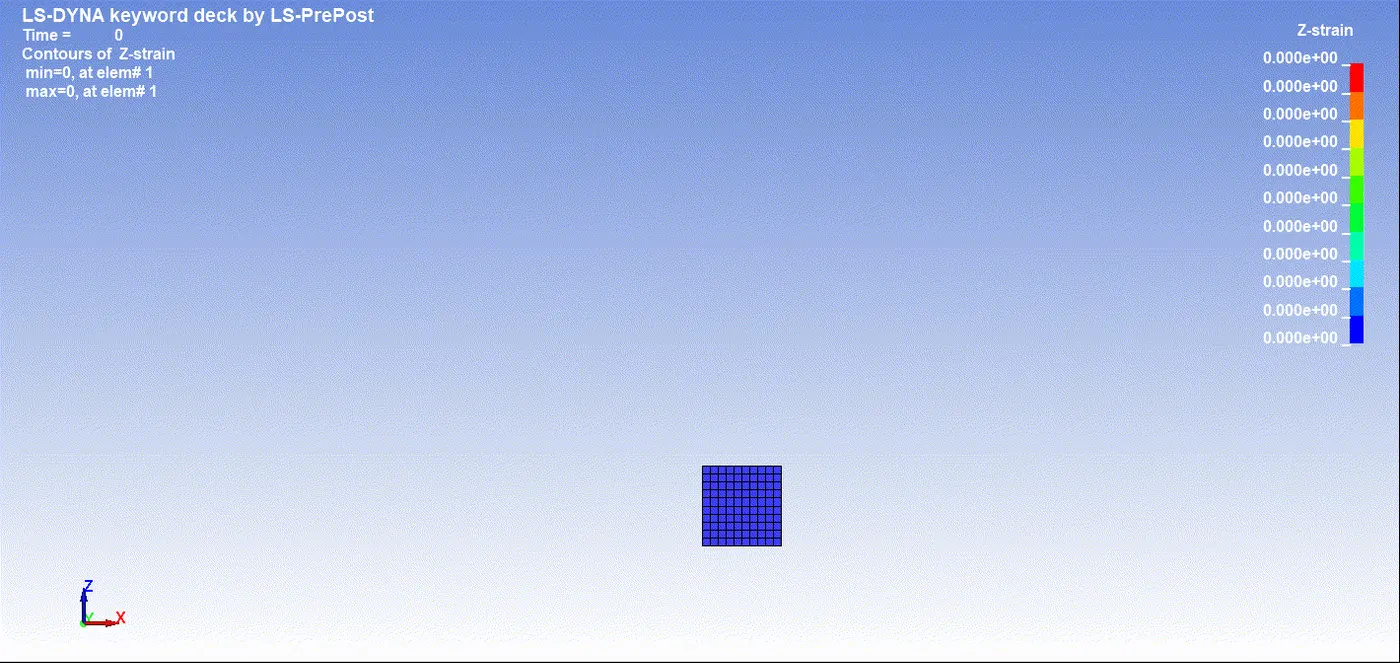
14. Open the Keyword and D3_plot in Ls-PrePost. Play the simulation and contour the Z stress & Z Strain.
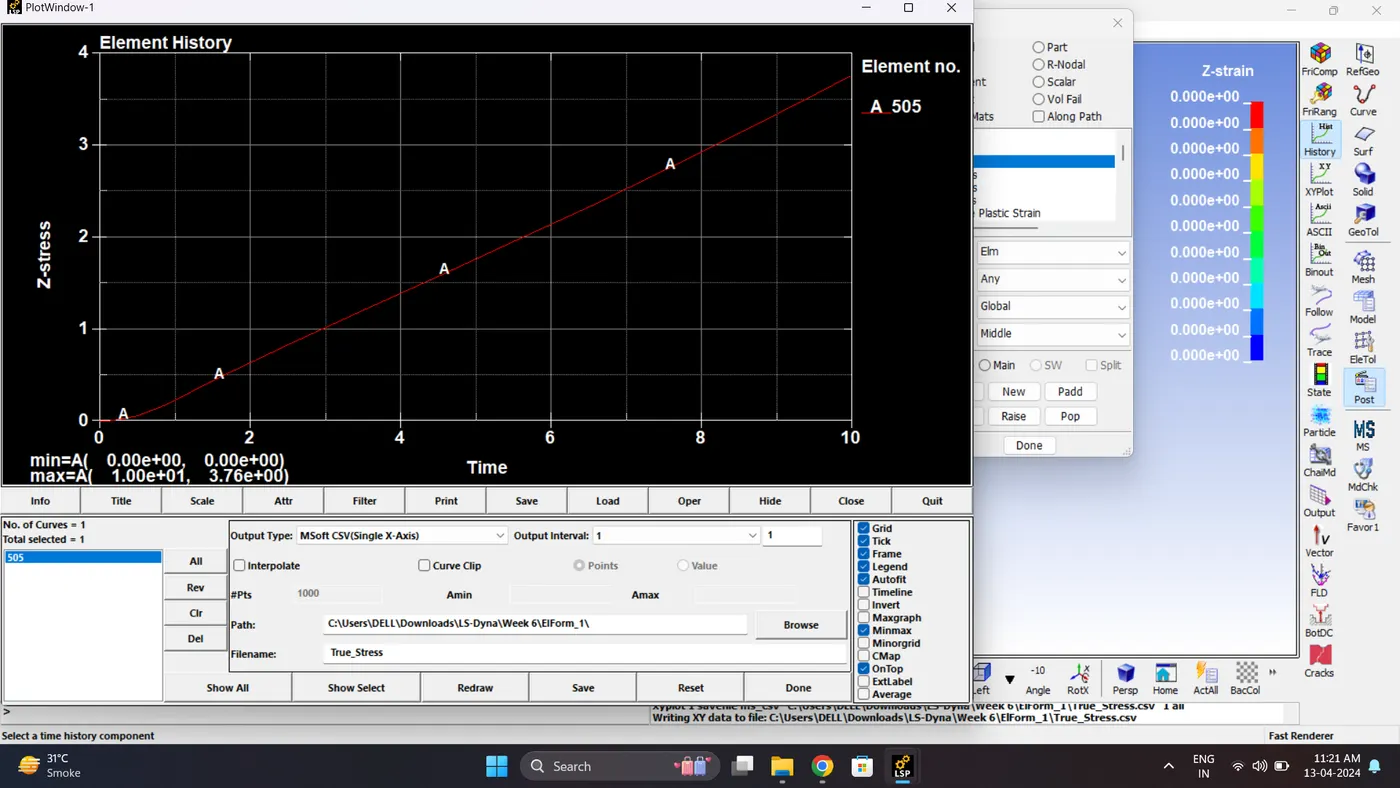
Maximum Stress = 3.76422 gm/mm*ms^2.
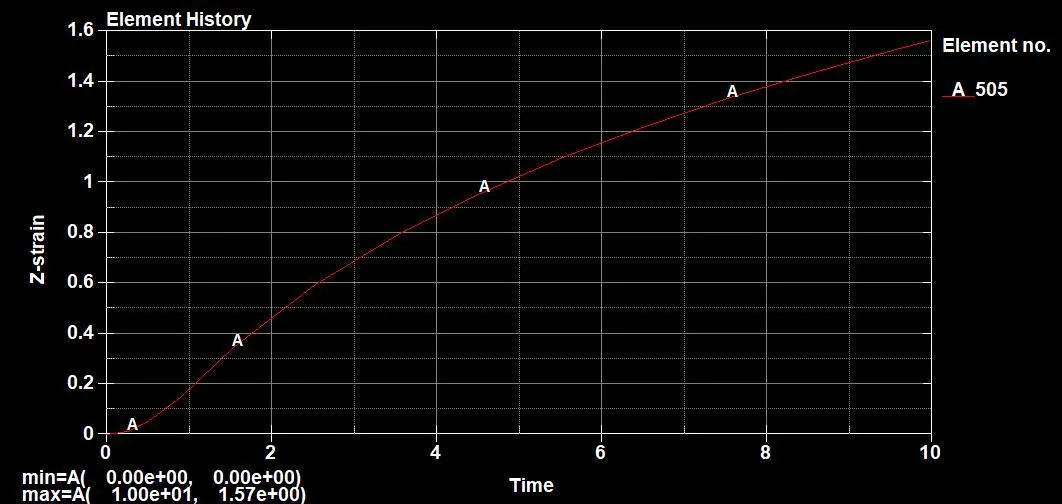
Maximum Strain = 1.56583
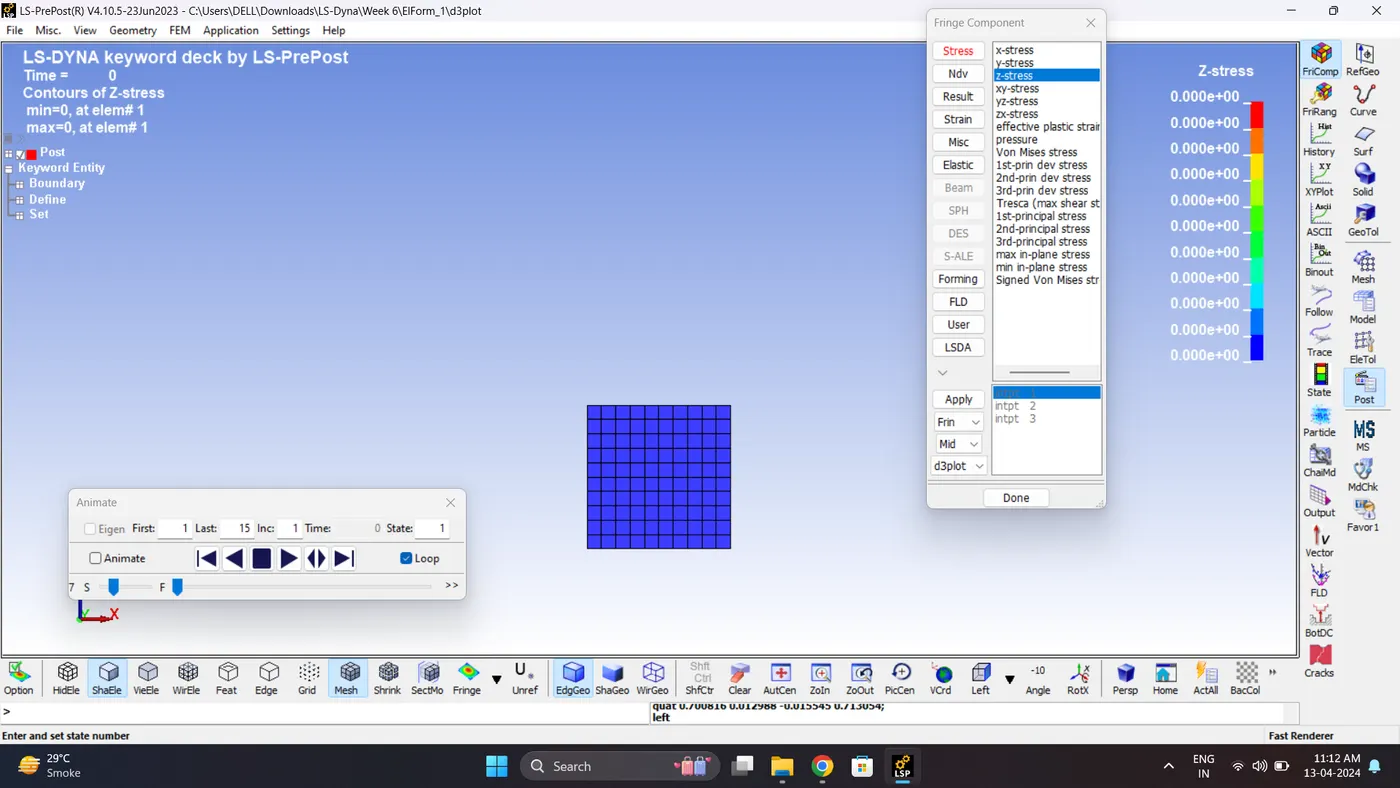
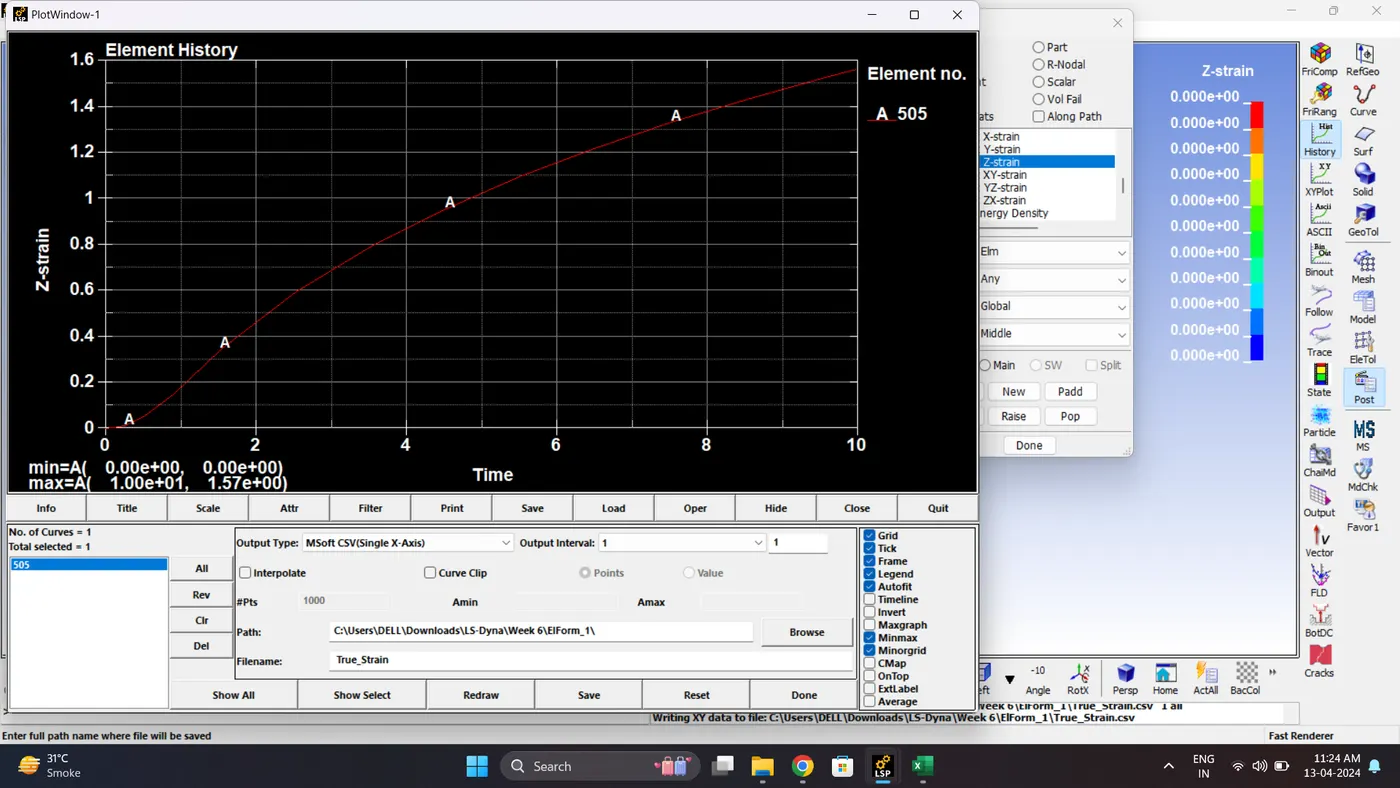
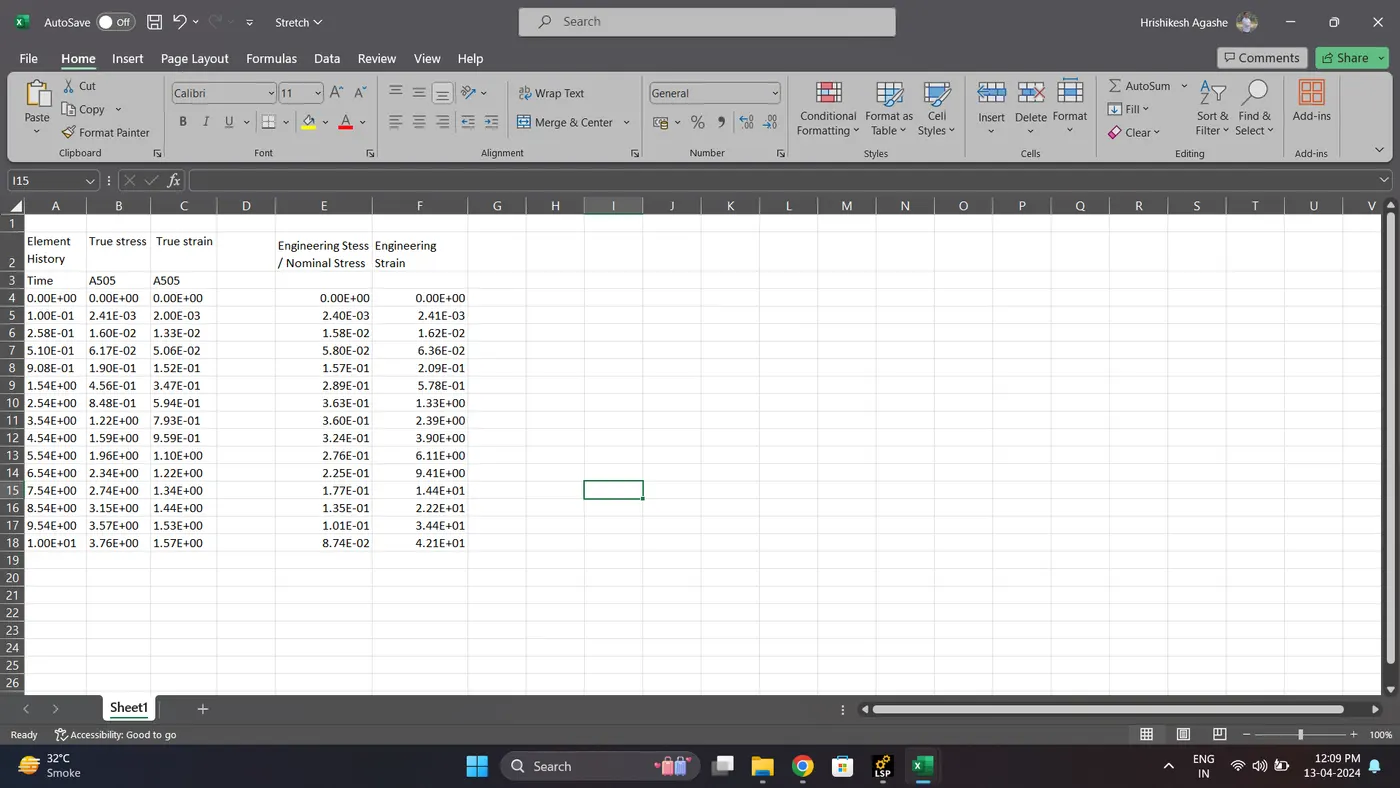
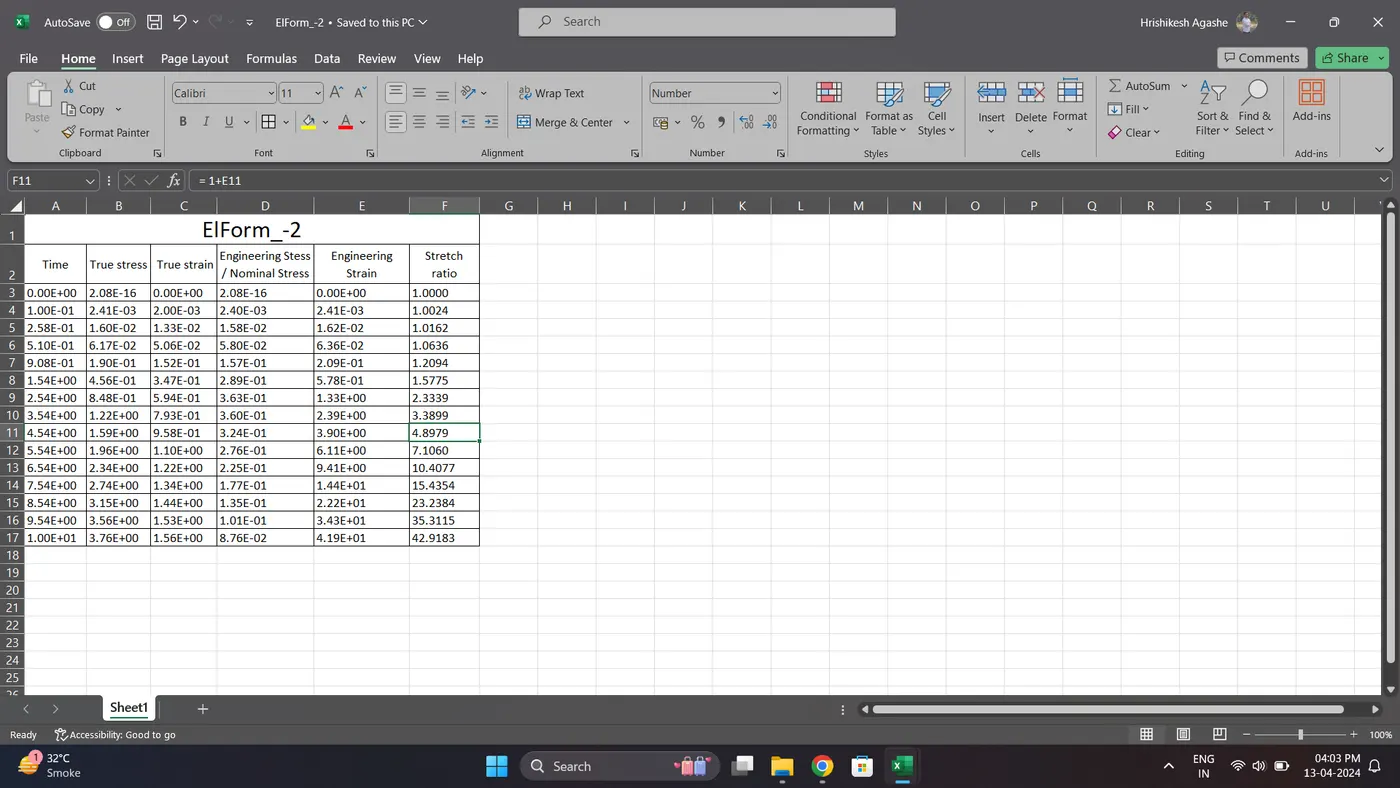
15. Plot the graph for True stress and True strain.
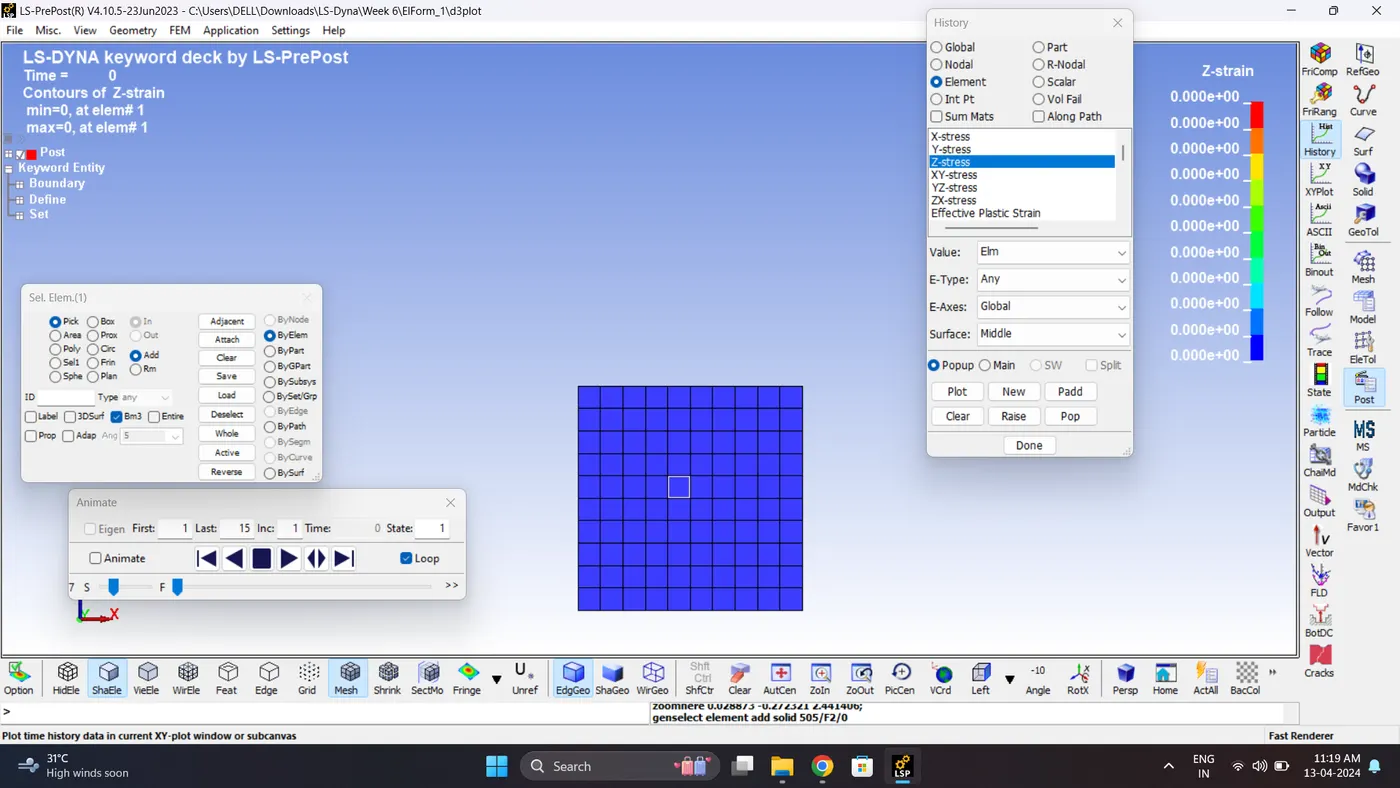
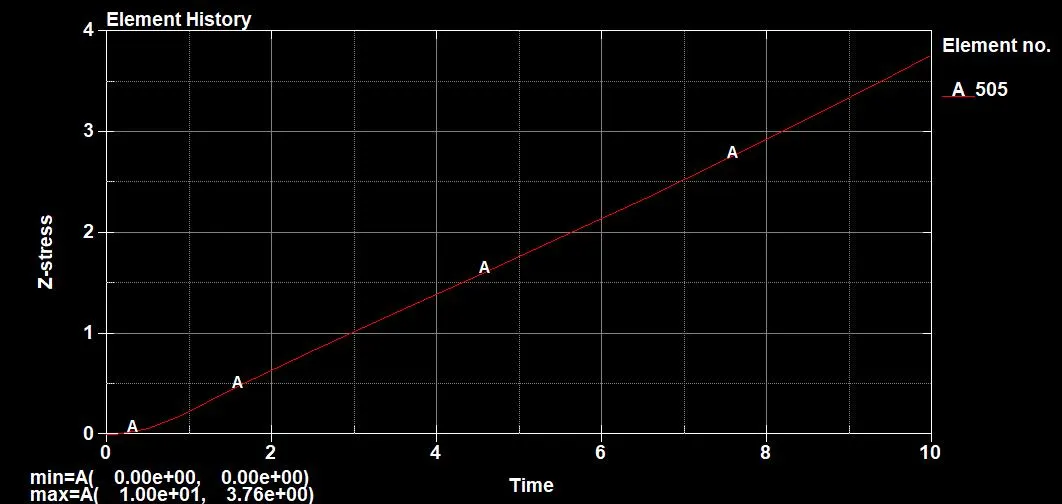
Go to Post - History - Element - Select middle element - Plot Z Strees & Z Strain.
Save the file as Msoft_CSV(Single Axis). From this we get the true stress and True Stain Data in Excel.
16. Now get move those data in one excel file.
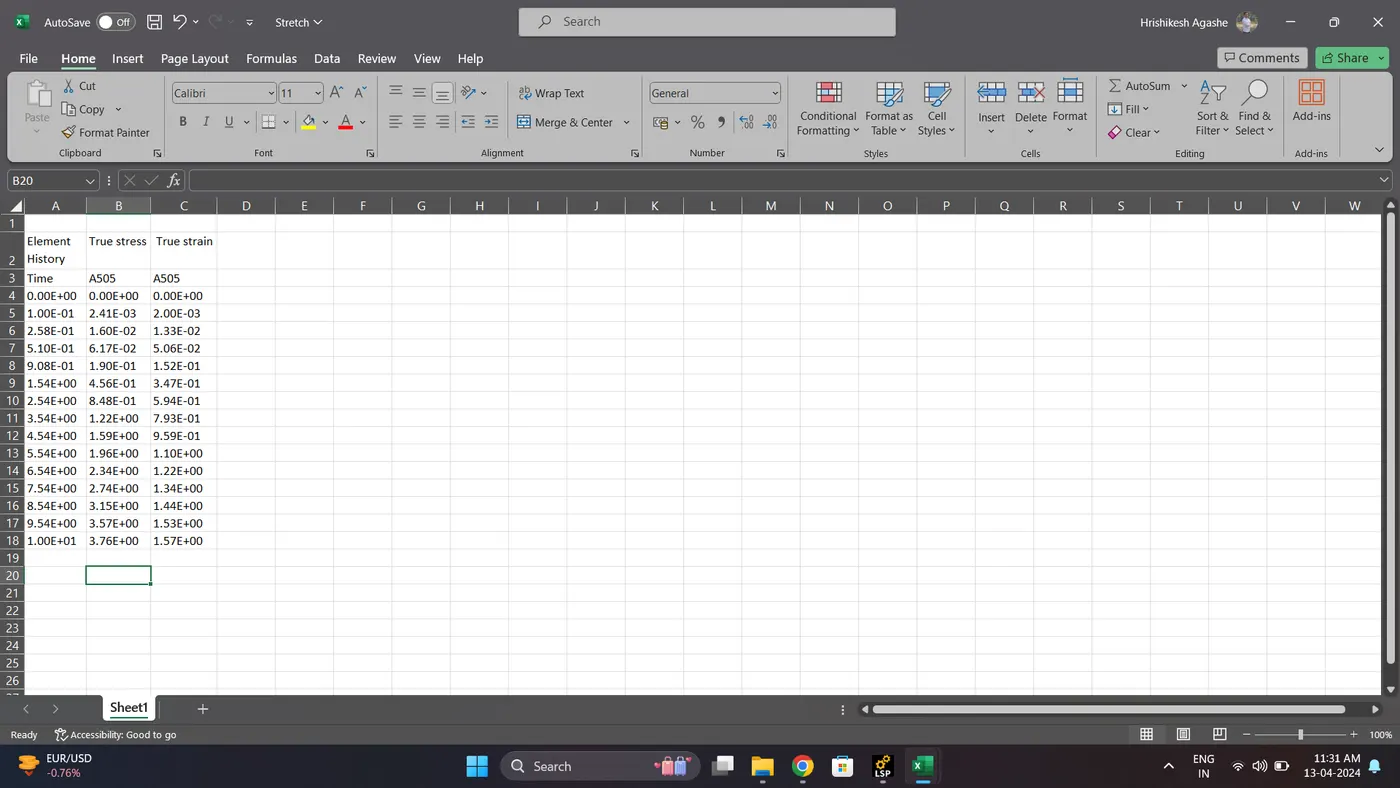
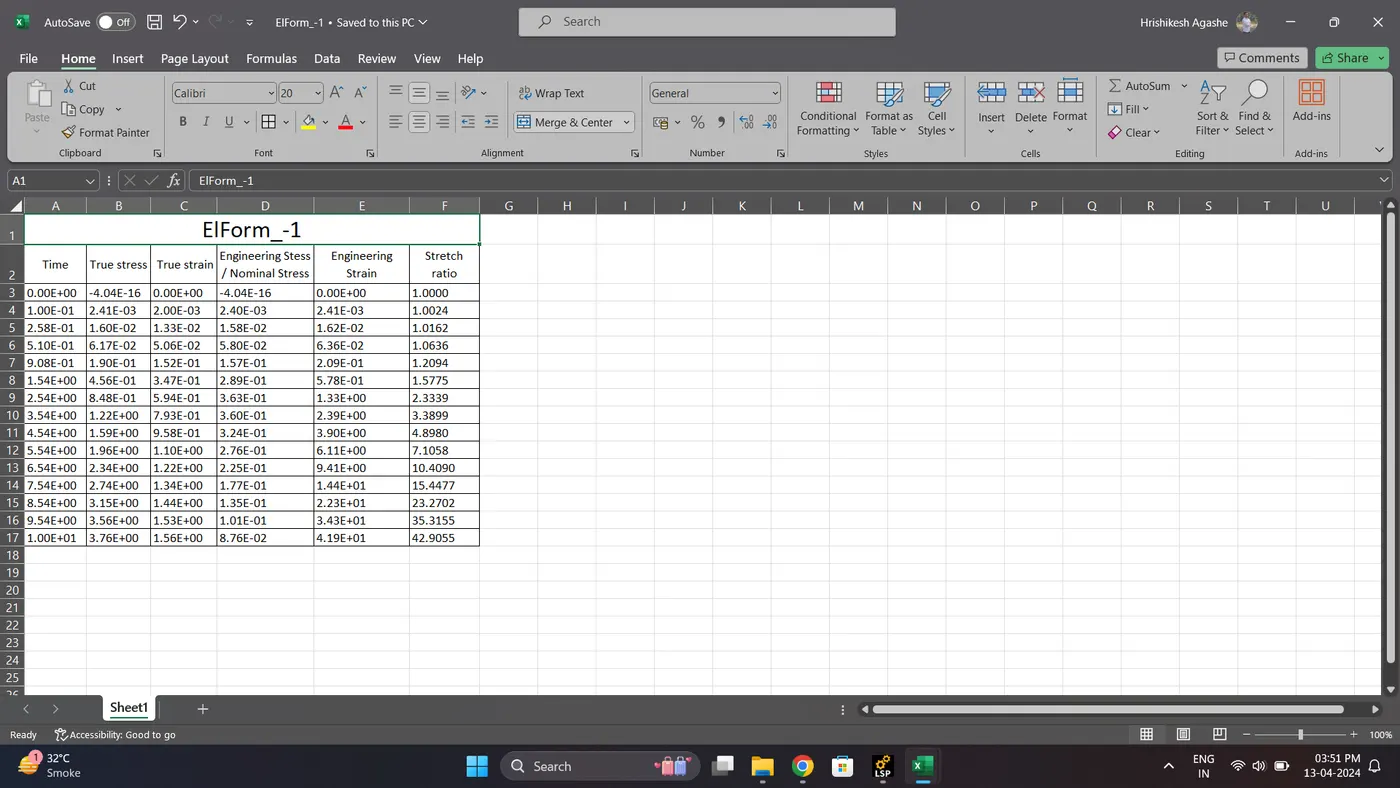
17. Now convert the true stress and true strain data into engineering stress and engineering strain.
For conversion use below formula.
True stress = (engineering stress) * exp(true strain)
True stress = (engineering stress) * (1 + engineering strain)
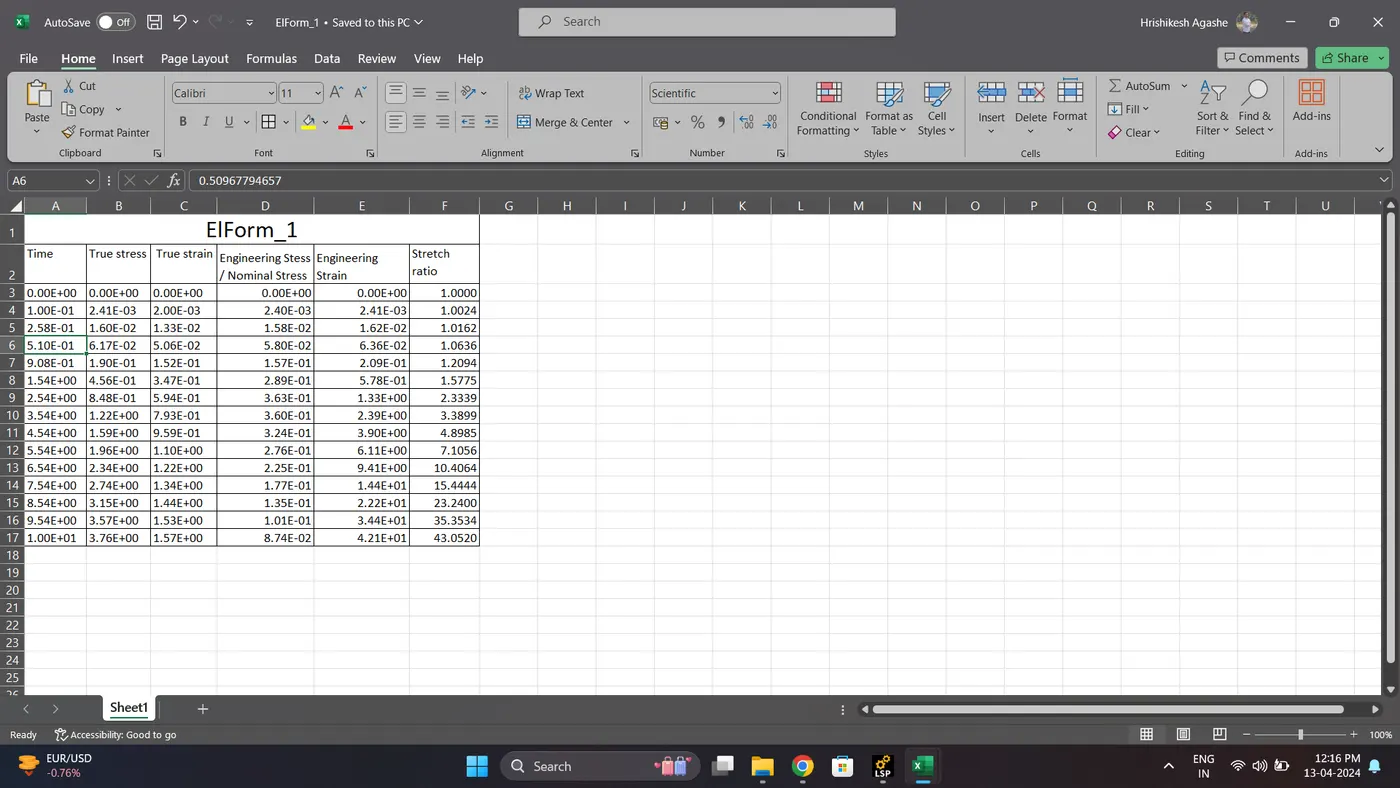
18. Now calculatue stretch using below formula.
Stretch ratio = (1 + engineering strain)
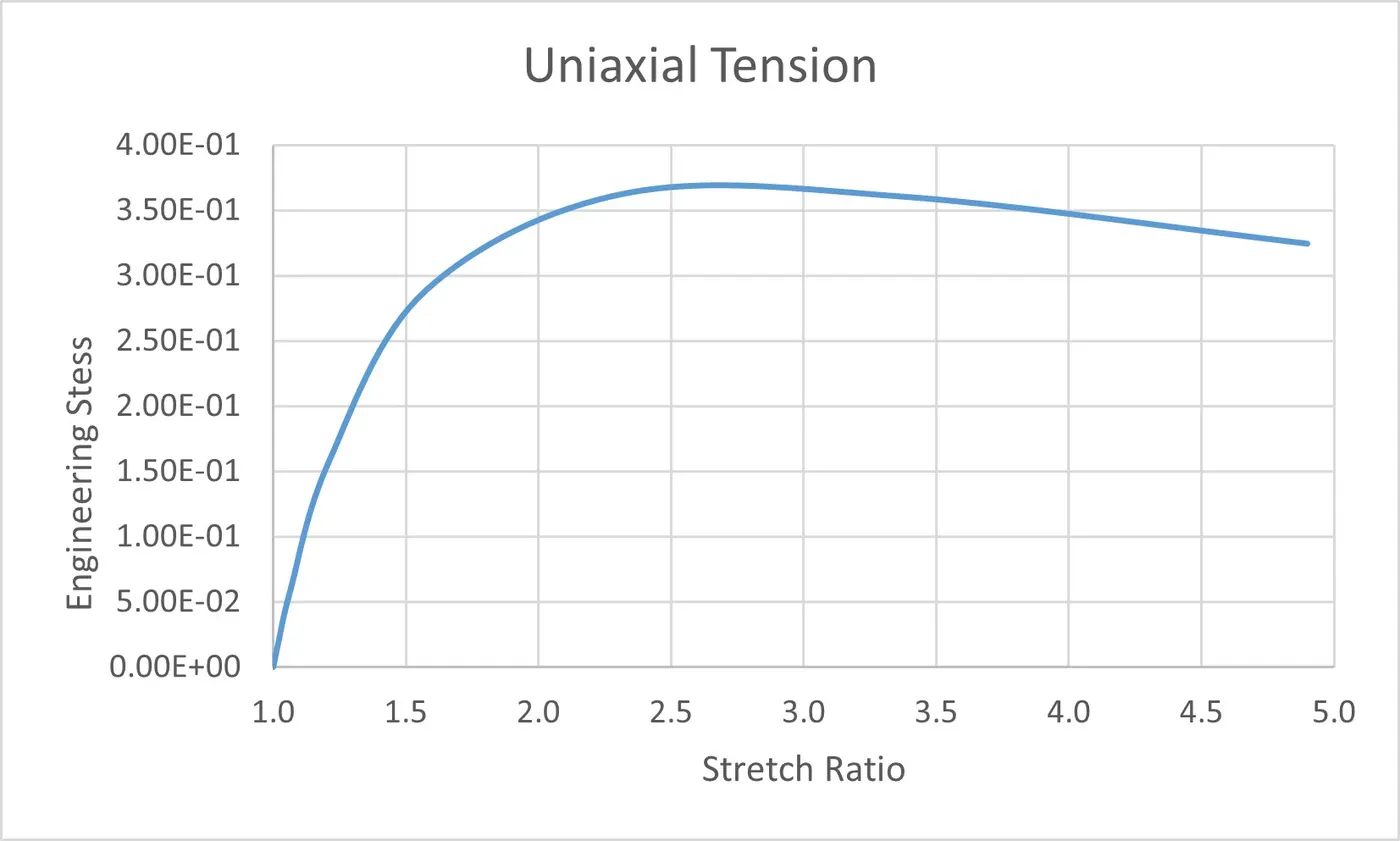
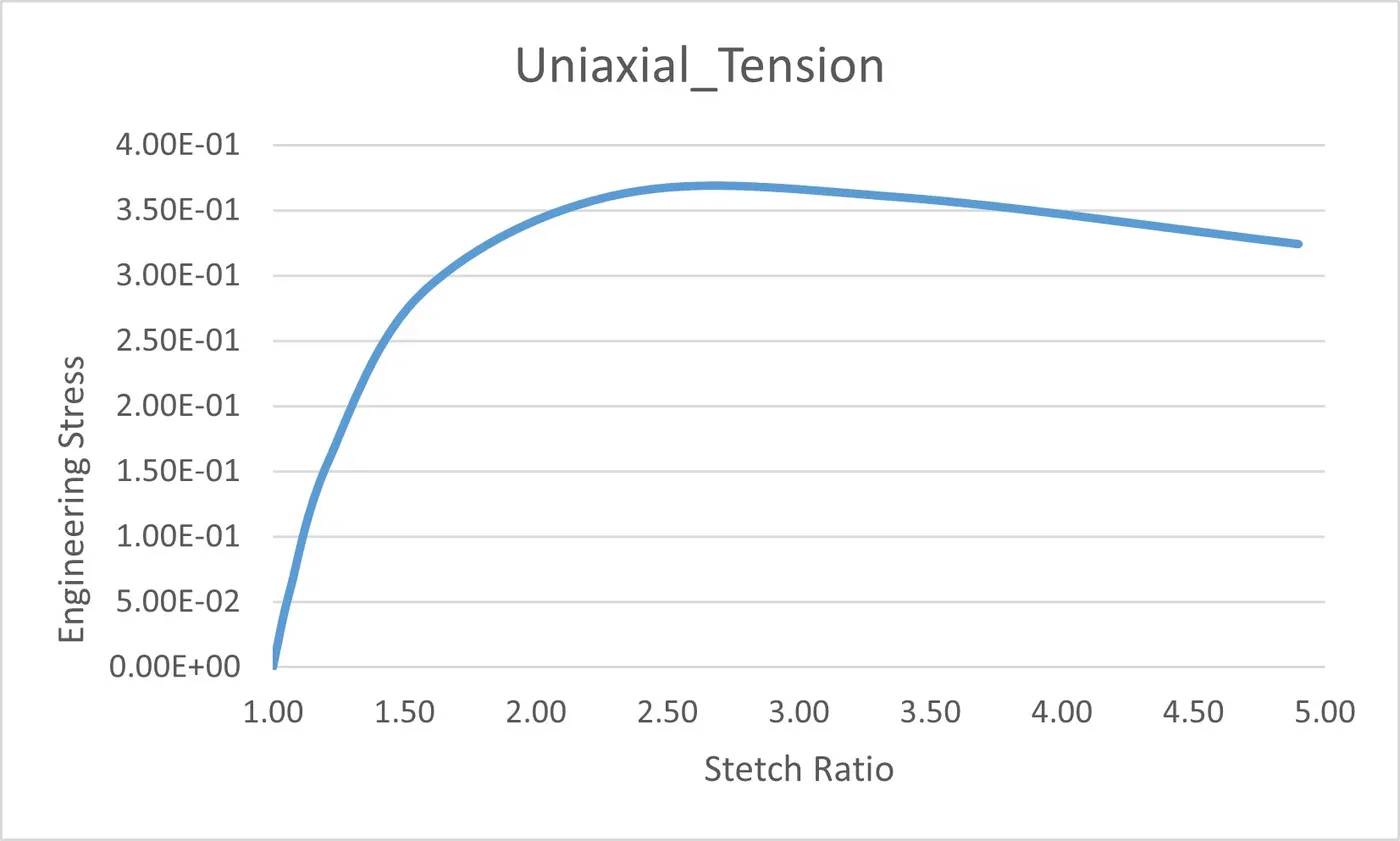
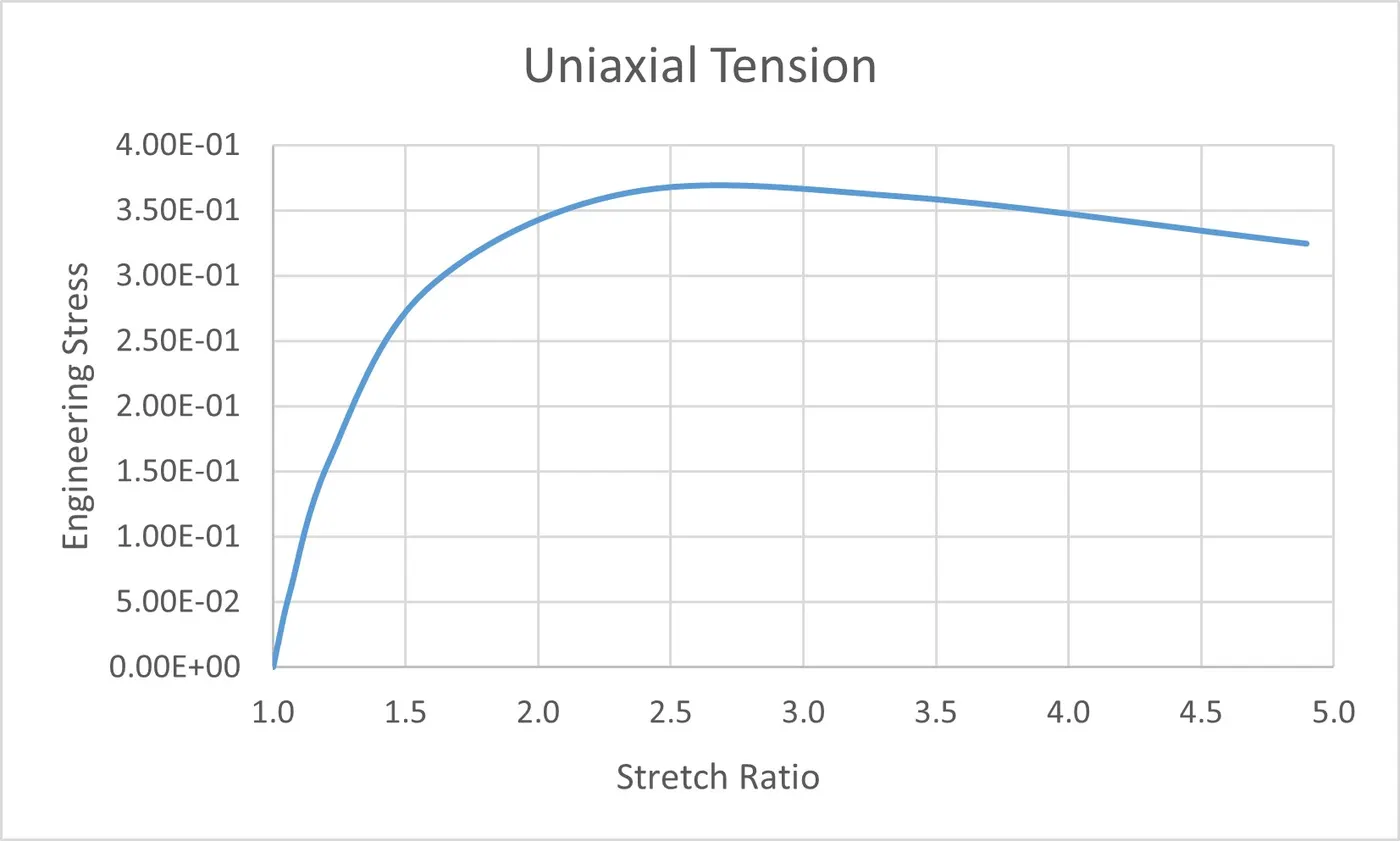
19. Plot the Engineering stress vs Stretch ratio graph using excel data.
Case 2:
1. Change the element formulation 2 and run the simulation.
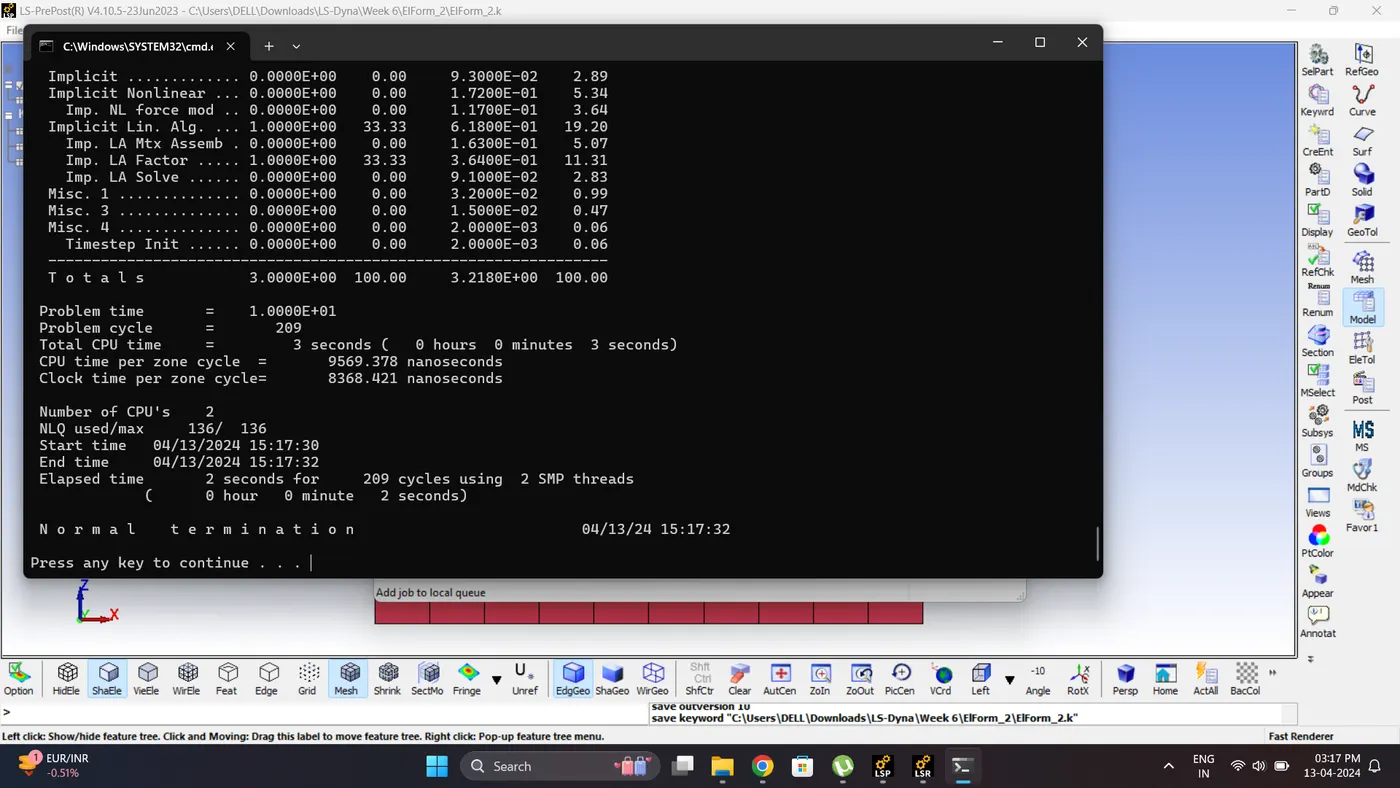
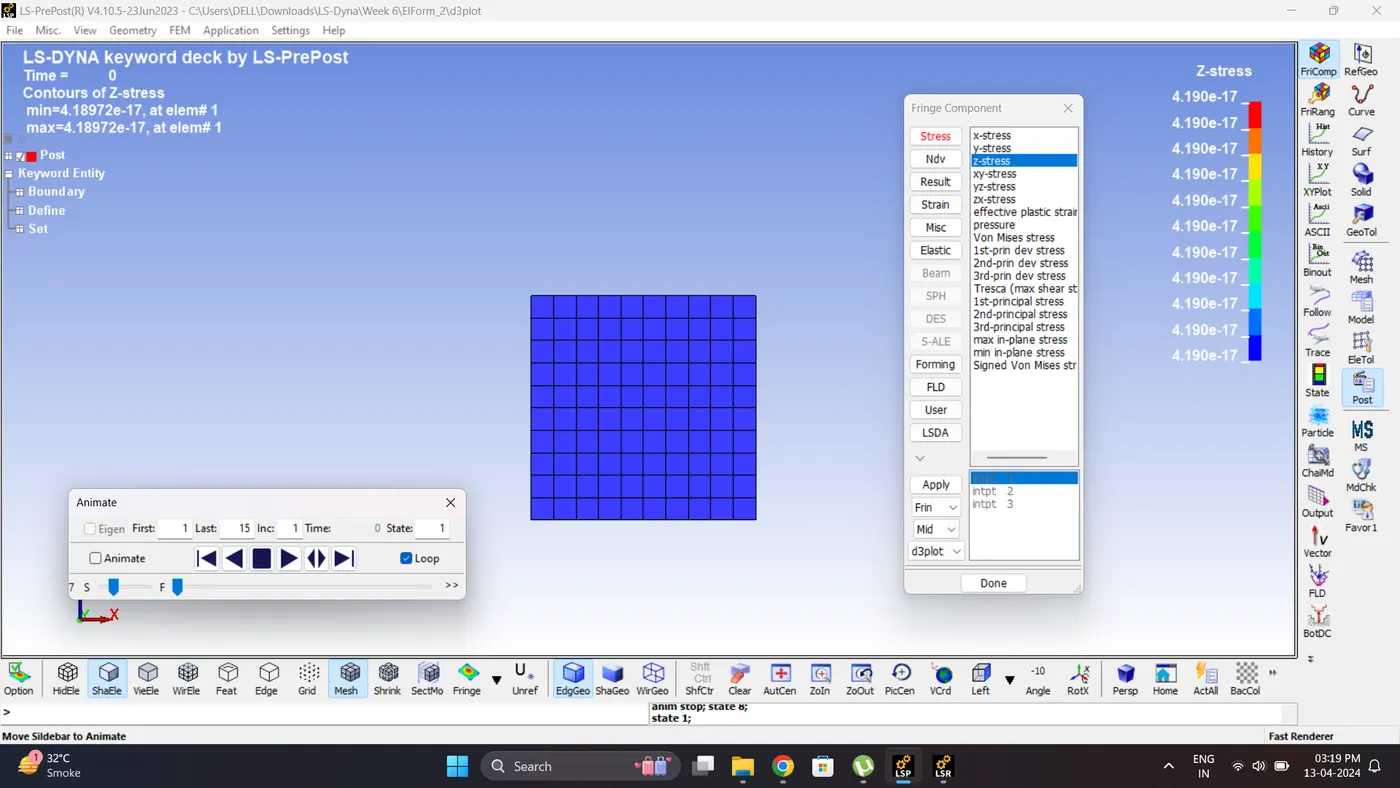
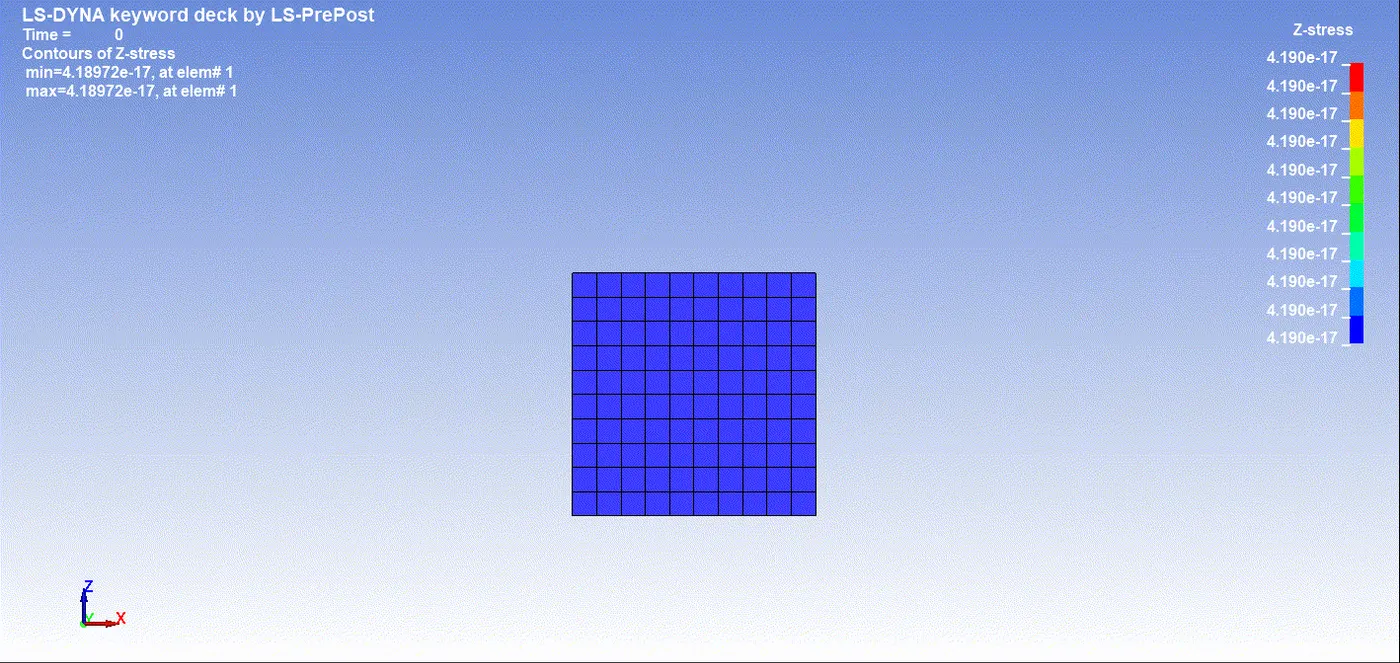
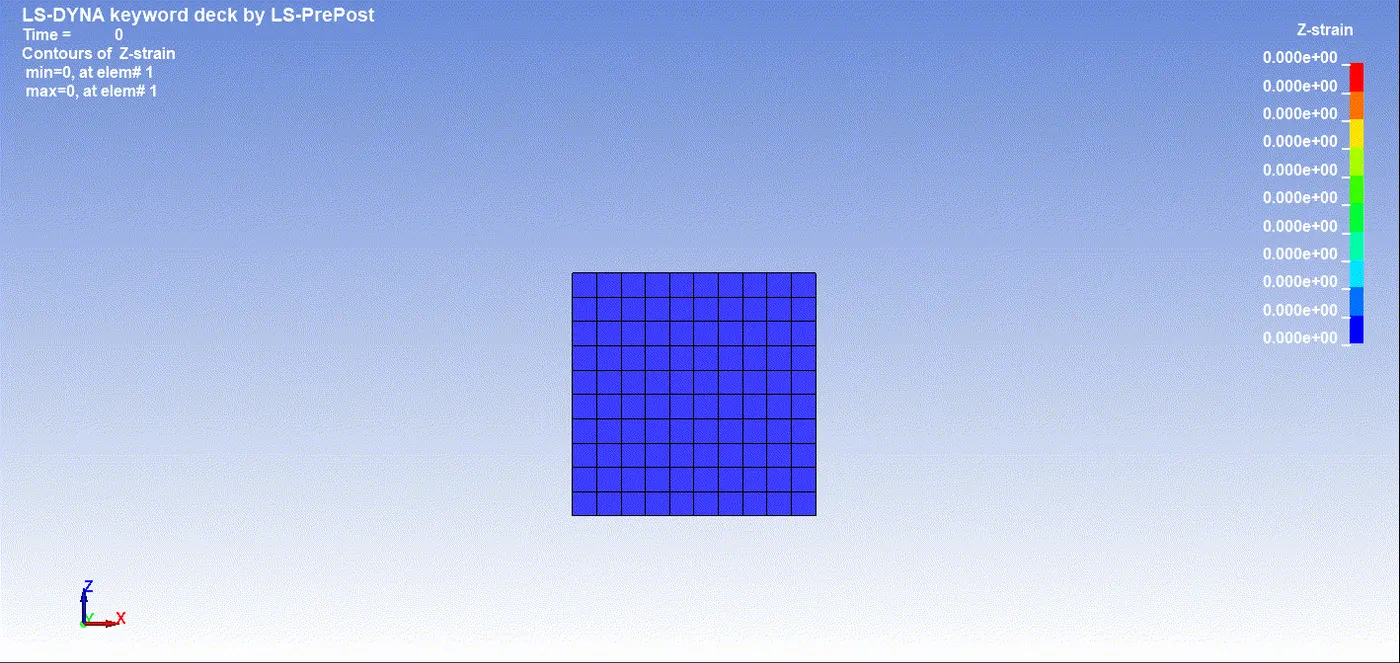
2. Open the Keyword and D3_plot in Ls-PrePost. Play the simulation and contour the Z stress & Z Strain.
Maximum Stress = 3.76732 gm/mm*ms^2.
Maximum Strain = 1.56653
3. Plot the graph for True stress and True strain.
Go to Post - History - Element - Select middle element - Plot Z Strees & Z Strain.
Save the file as Msoft_CSV(Single Axis). From this we get the true stress and True Stain Data in Excel.
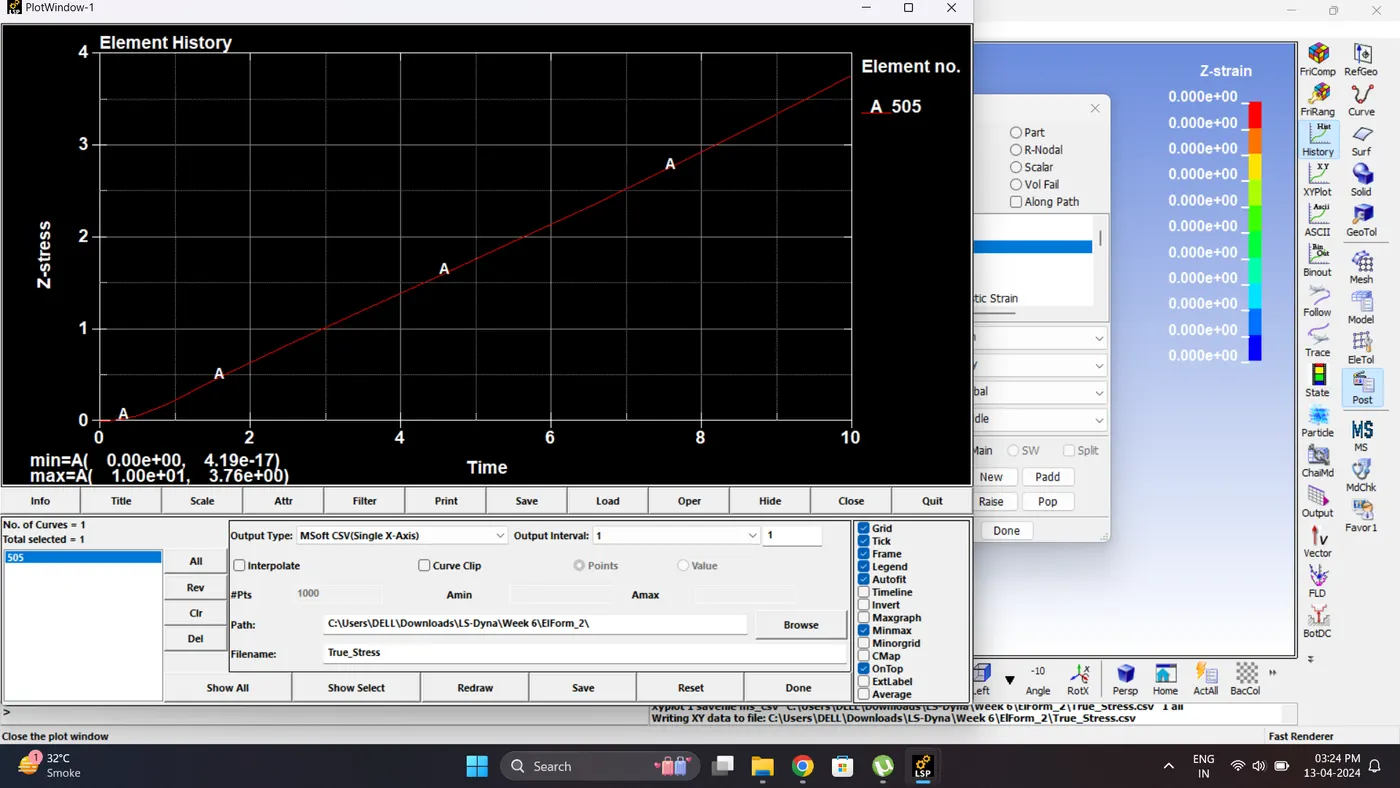
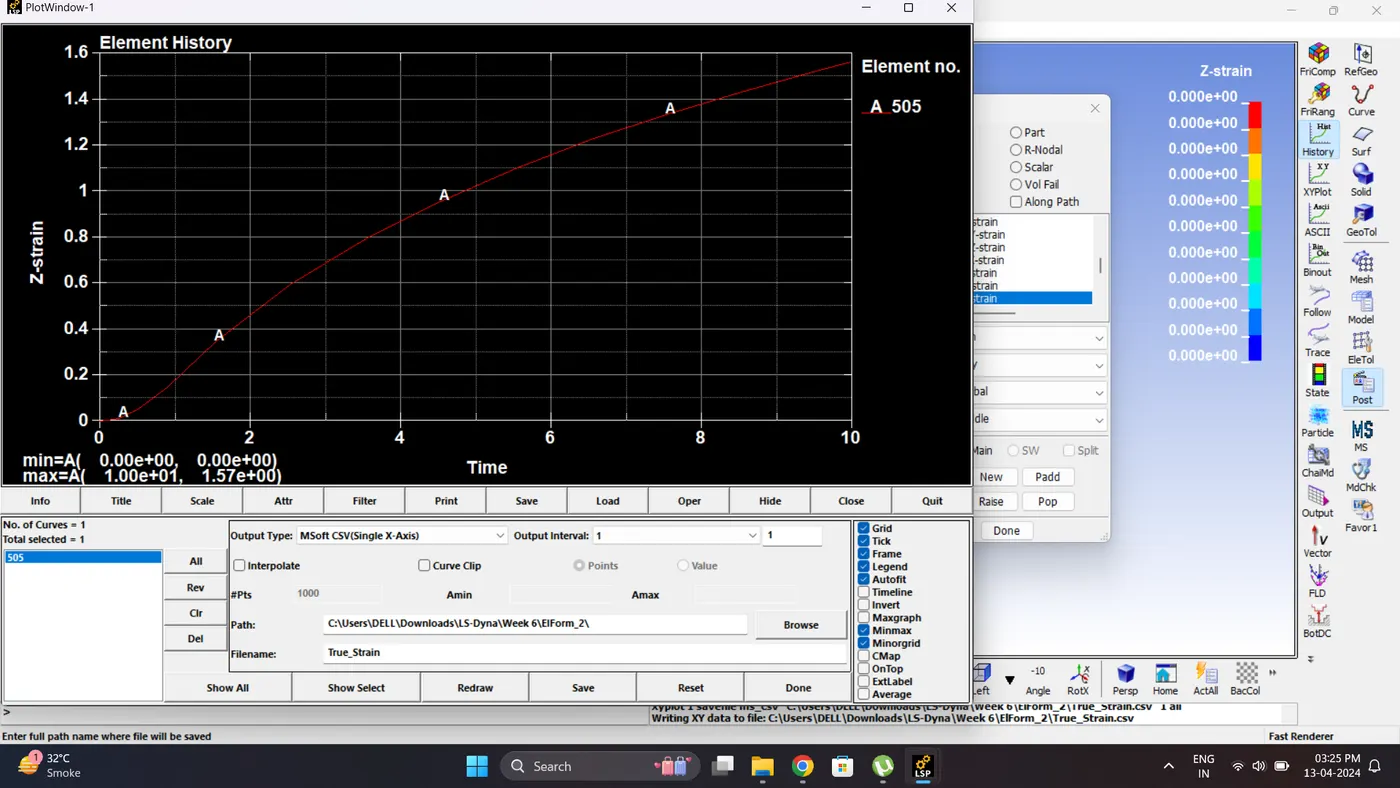
4. Repeat step 16 to 18 from case 1 and calculate engineering stress engineering strain and Stretch ratio.
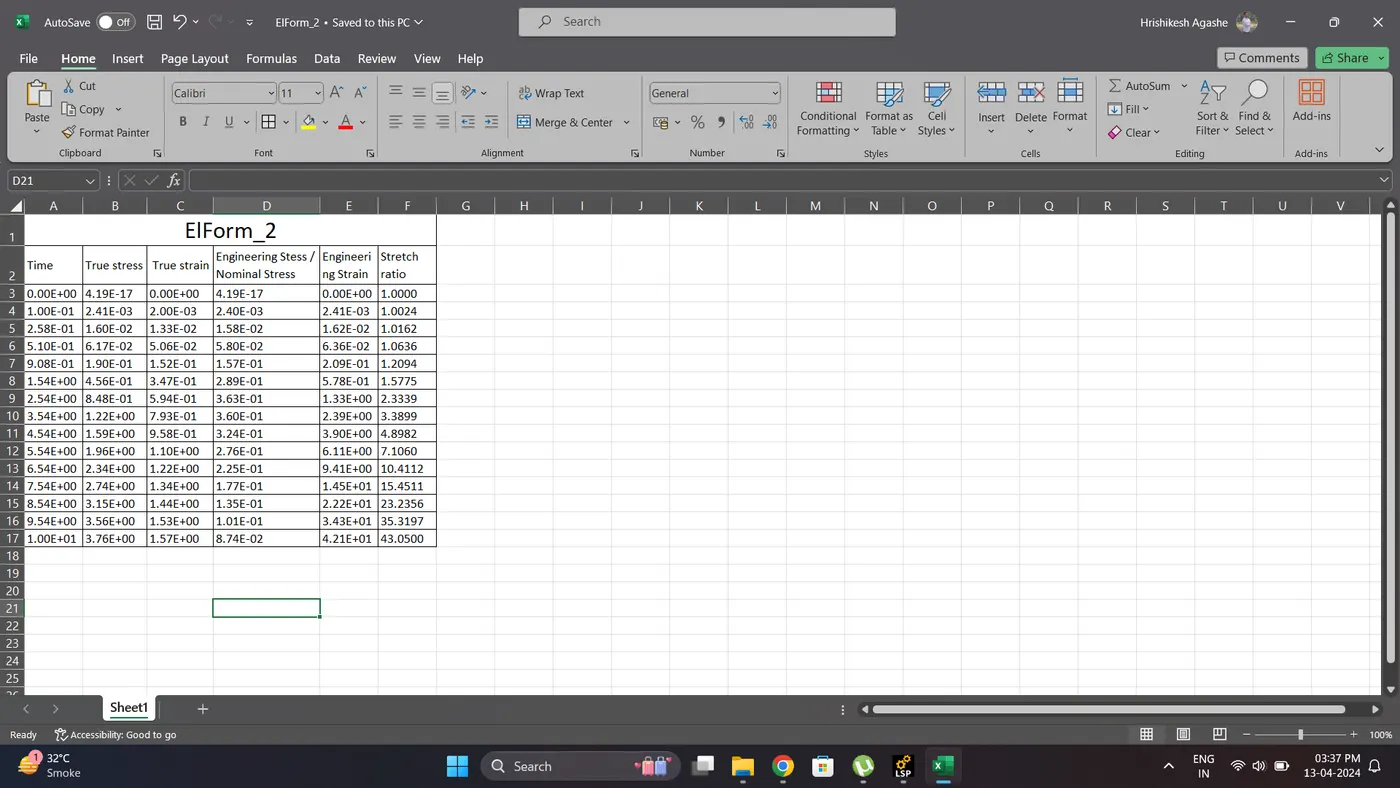
5. Plot the Engineering stress vs Stretch ratio graph using excel data.
Case 3:
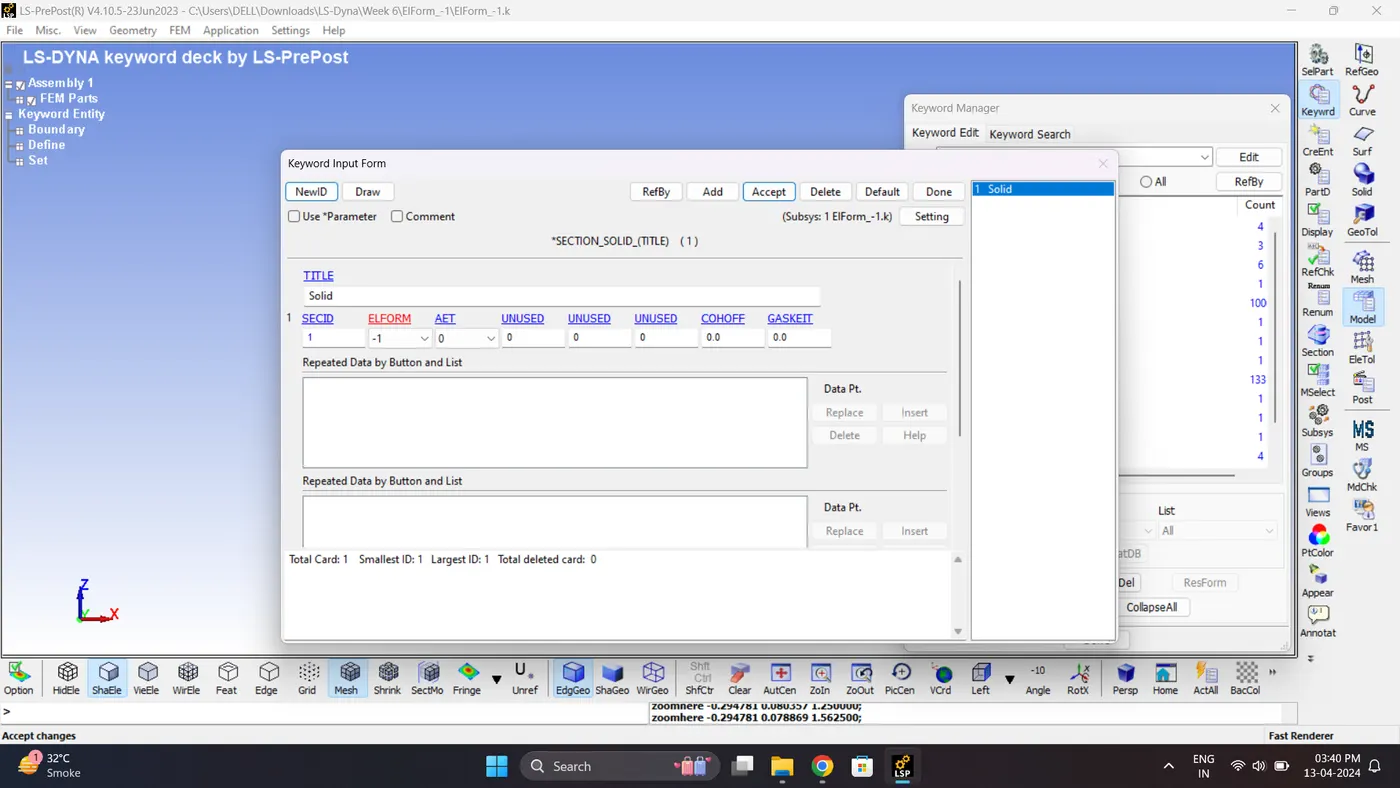
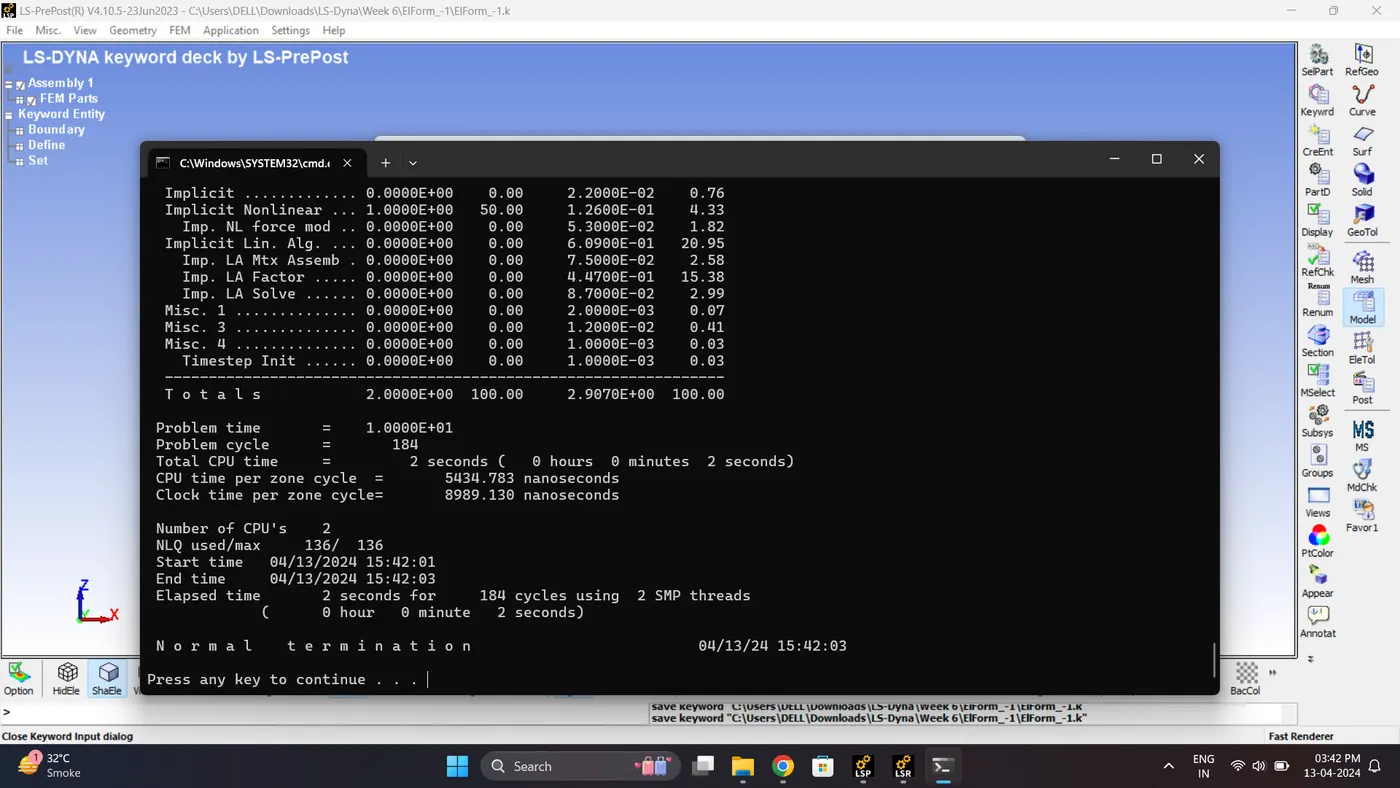
1. Change the element formulation -1 and run the simulation.
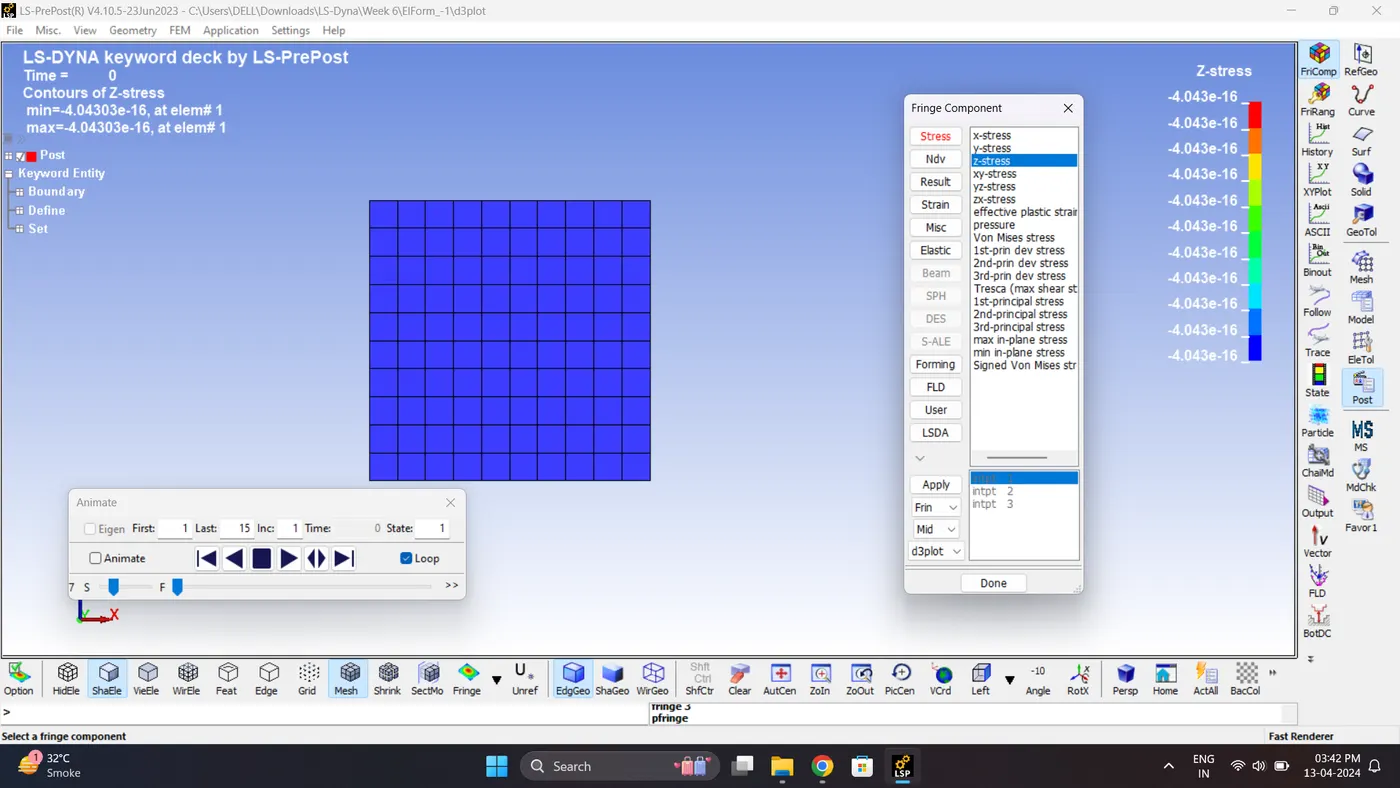
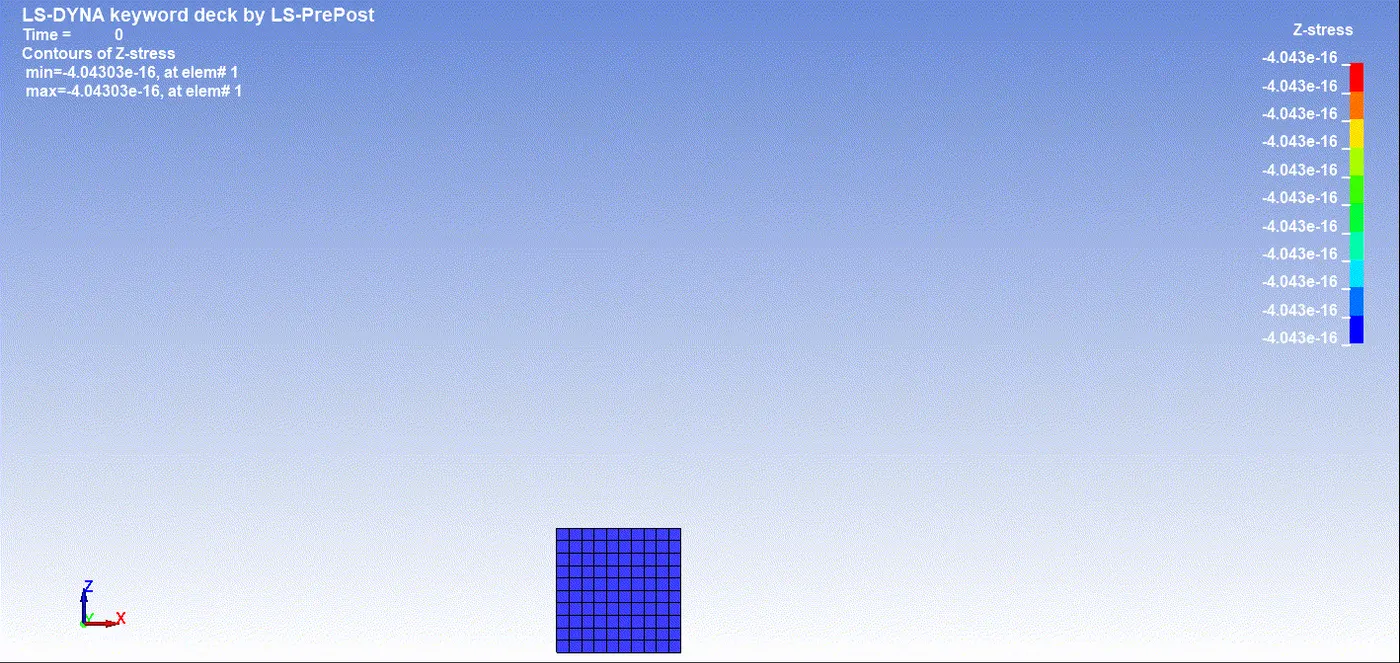
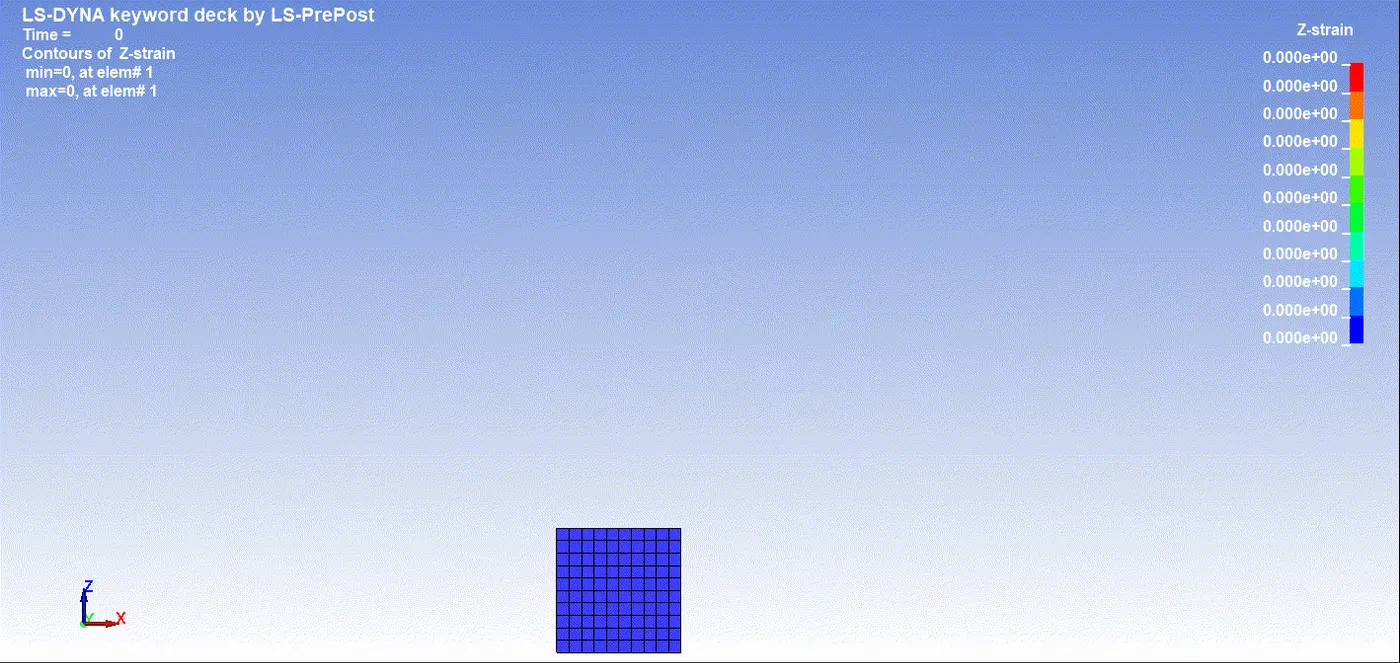
2. Open the Keyword and D3_plot in Ls-PrePost. Play the simulation and contour the Z stress & Z Strain.
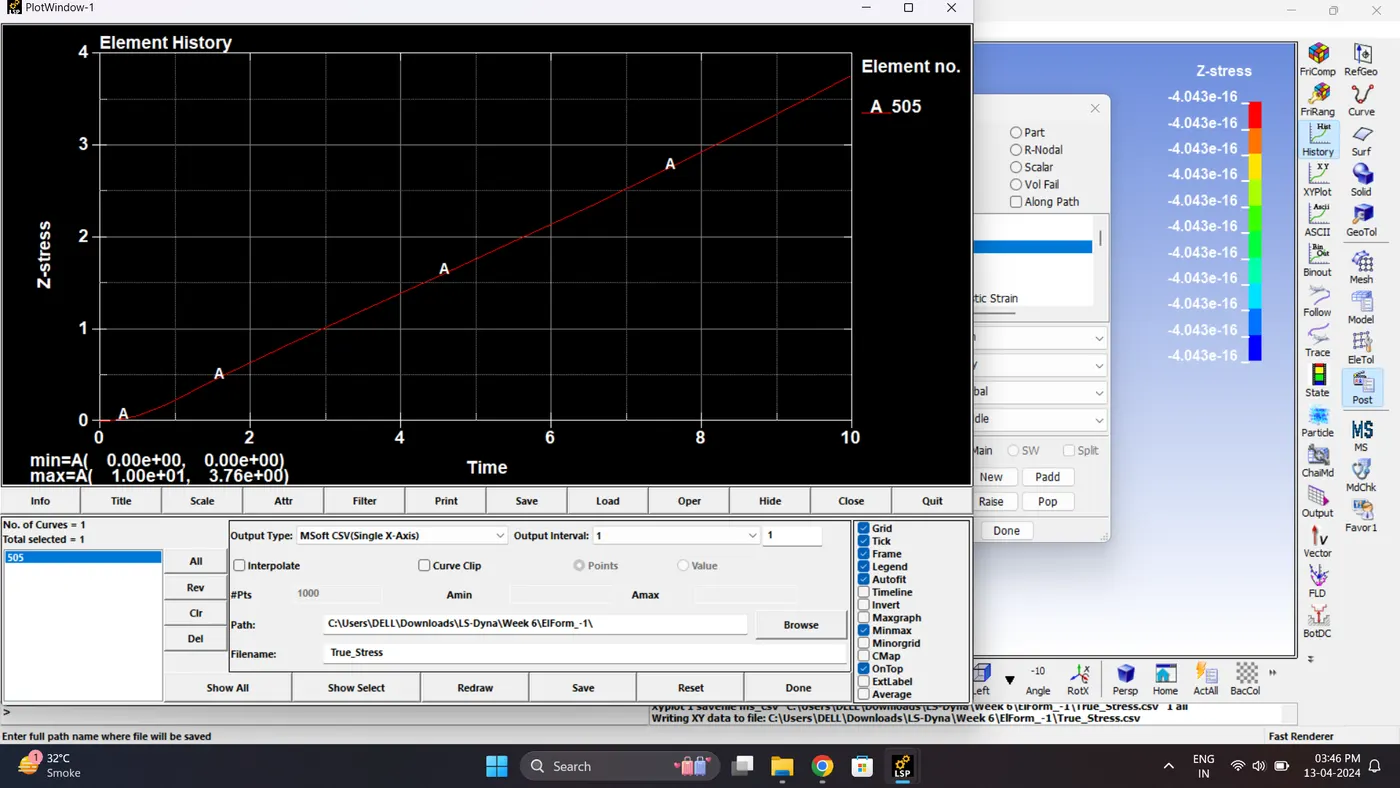
Maximum Stress = 3.76032 gm/mm*ms^2.
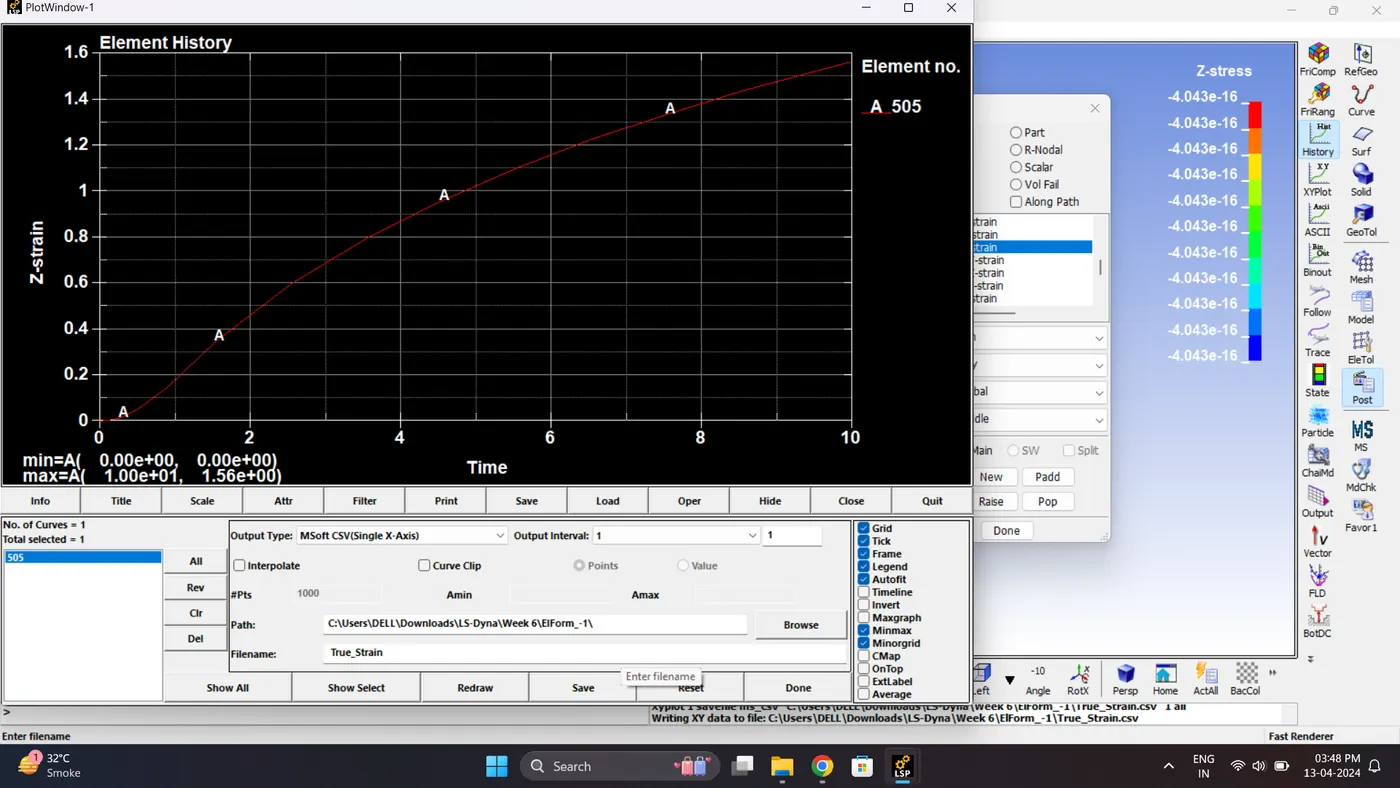
Maximum Strain = 1.56516
3. Plot the graph for True stress and True strain.
Go to Post - History - Element - Select middle element - Plot Z Strees & Z Strain.
Save the file as Msoft_CSV(Single Axis). From this we get the true stress and True Stain Data in Excel.
4. Repeat step 16 to 18 from case 1 and calculate engineering stress engineering strain and Stretch ratio.
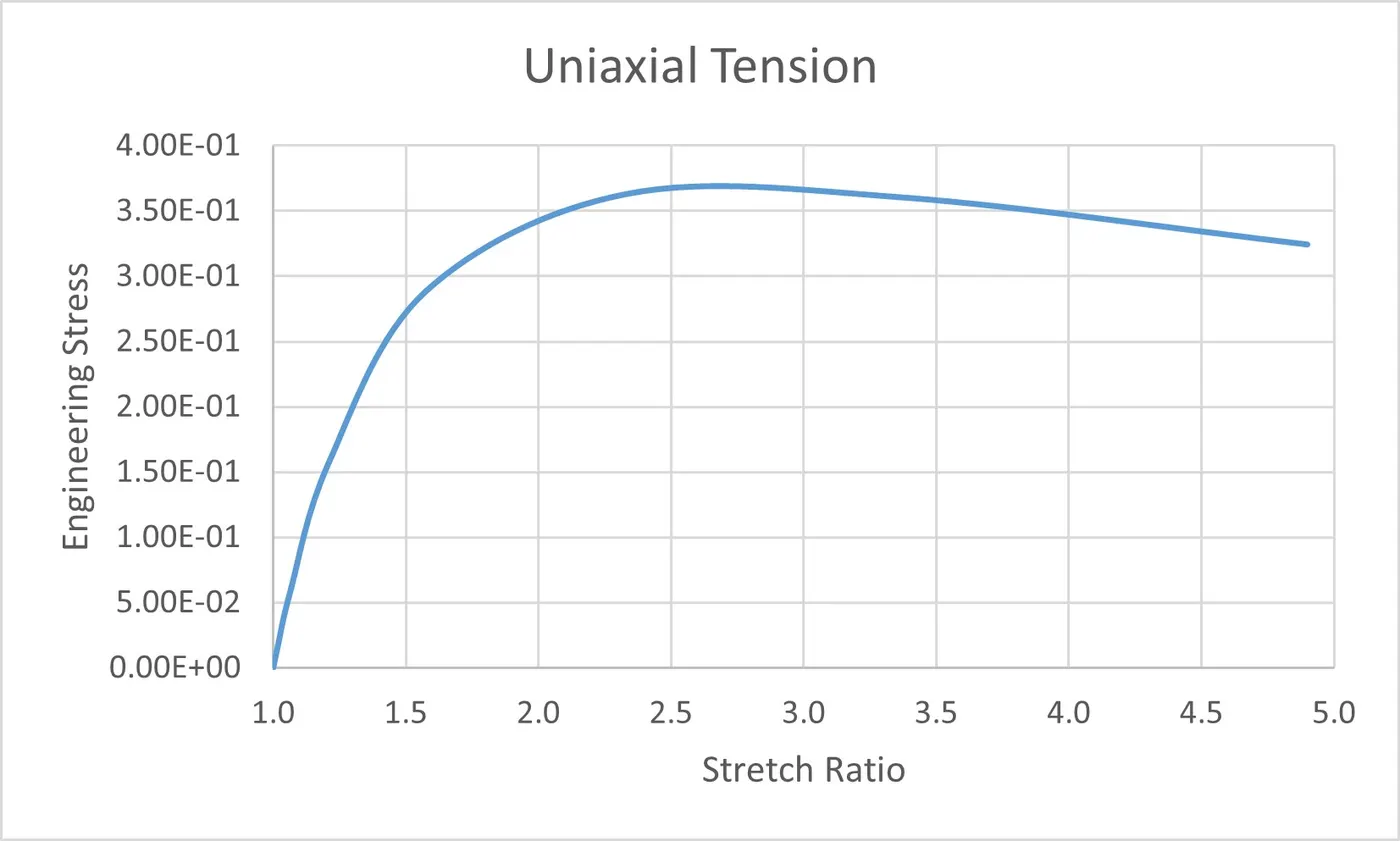
5. Plot the Engineering stress vs Stretch ratio graph using excel data.
Case 4:
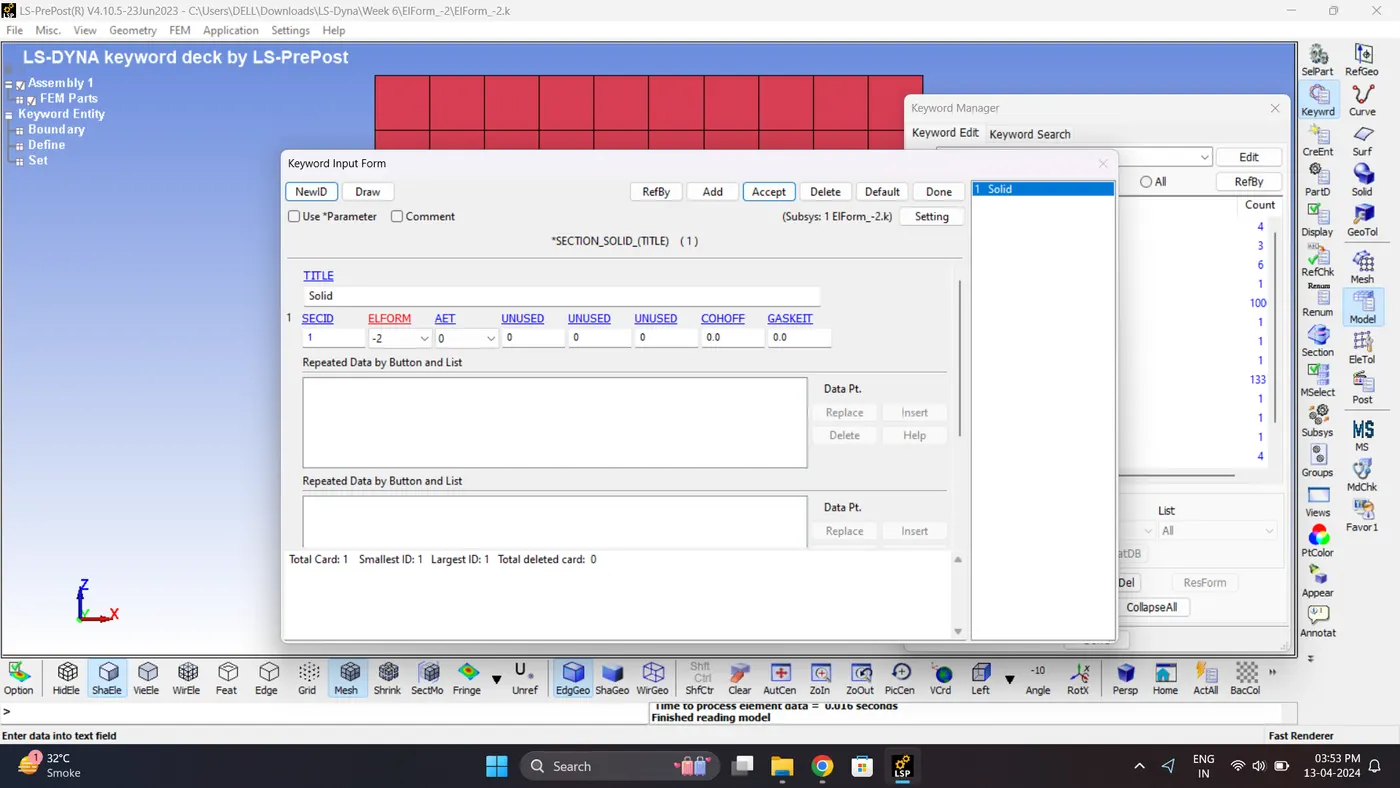
1. Change the element formulation -2 and run the simulation.
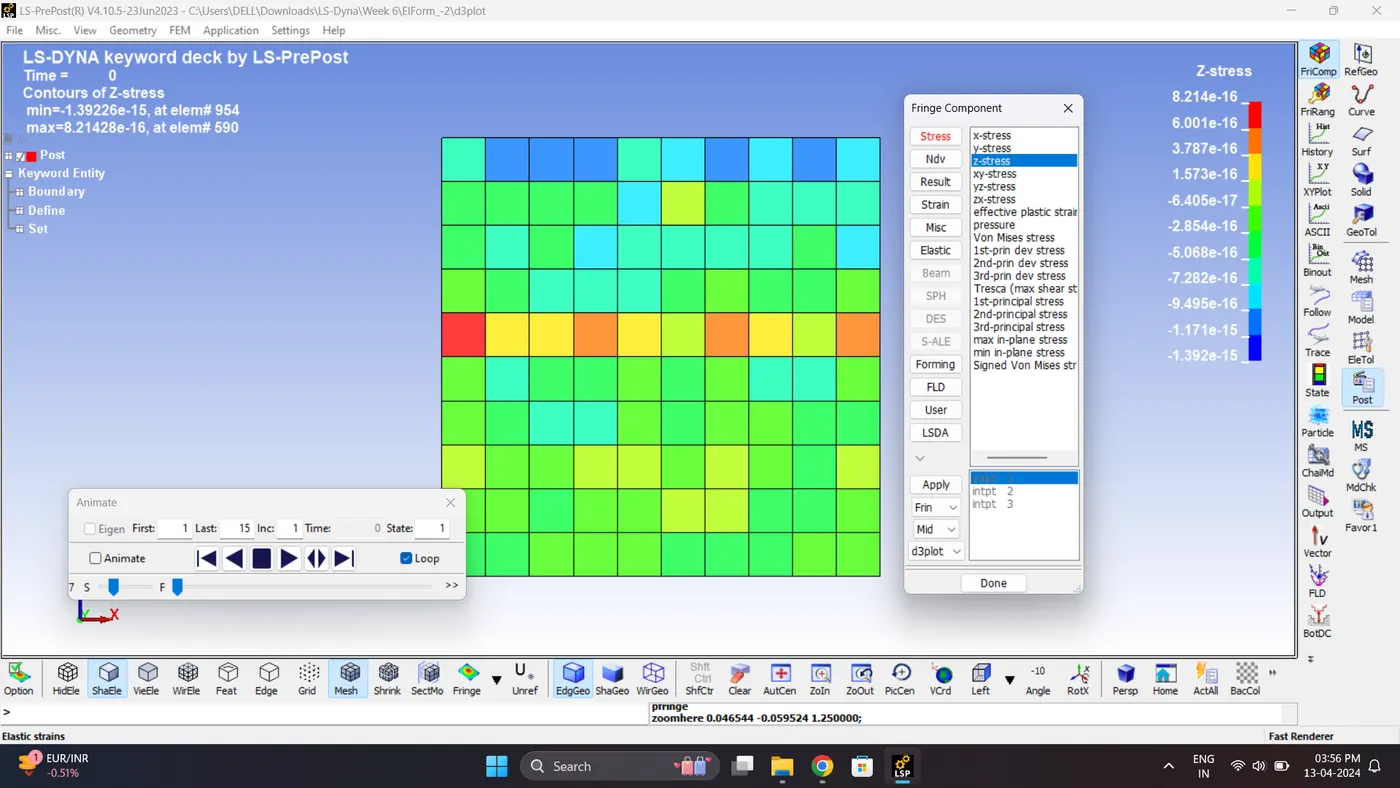
2. Open the Keyword and D3_plot in Ls-PrePost. Play the simulation and contour the Z stress & Z Strain.
Maximum Stress = 3.75991 gm/mm*ms^2.
Maximum Strain = 1.56504
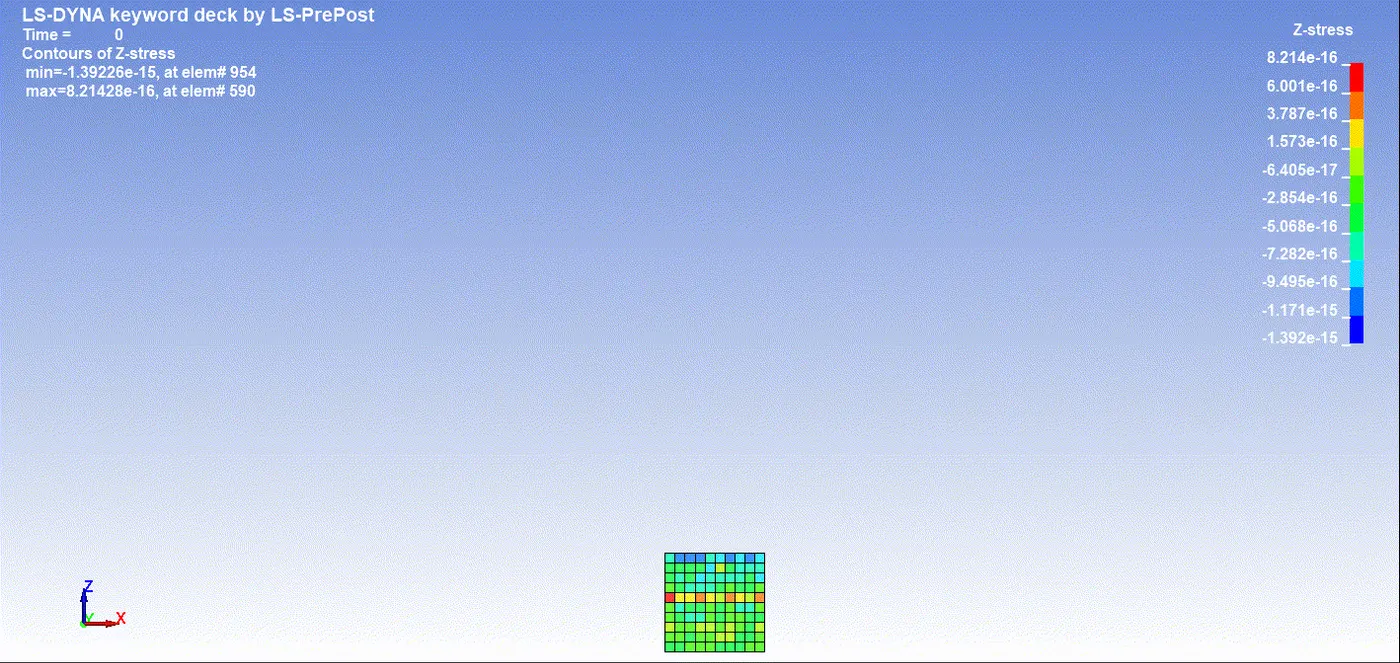
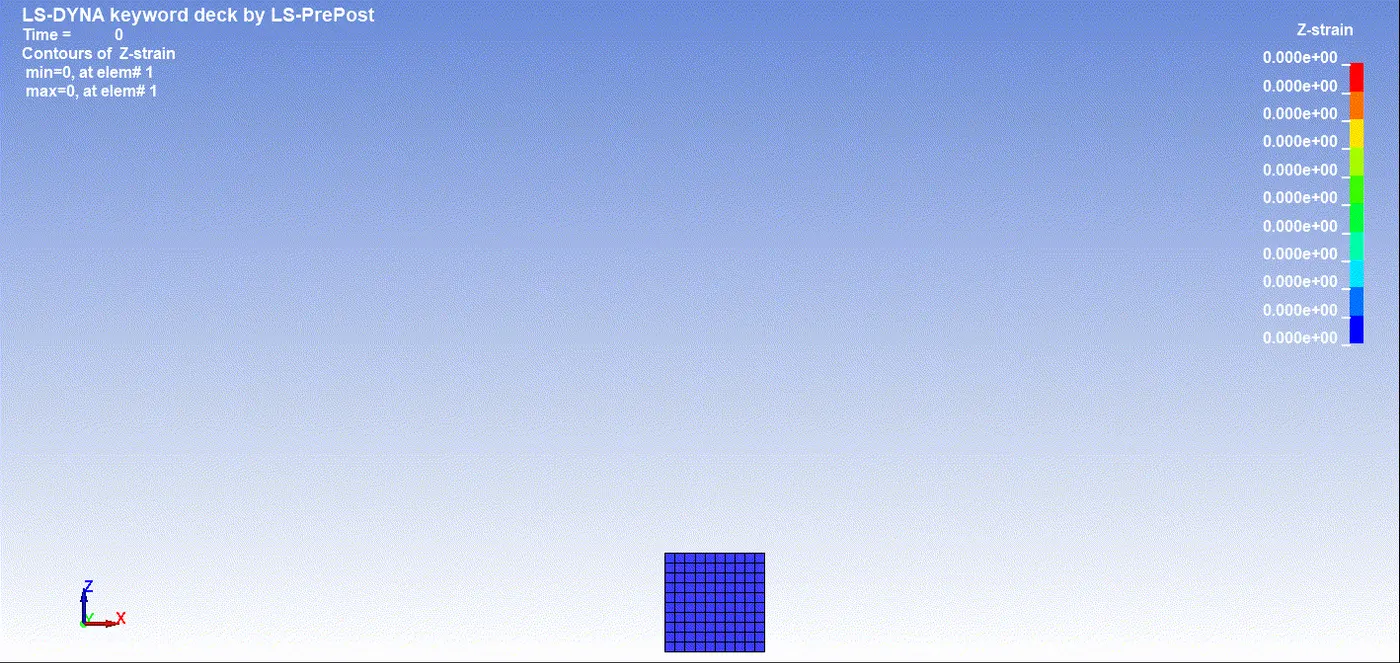
3. Plot the graph for True stress and True strain.
Go to Post - History - Element - Select middle element - Plot Z Strees & Z Strain.
Save the file as Msoft_CSV(Single Axis). From this we get the true stress and True Stain Data in Excel.
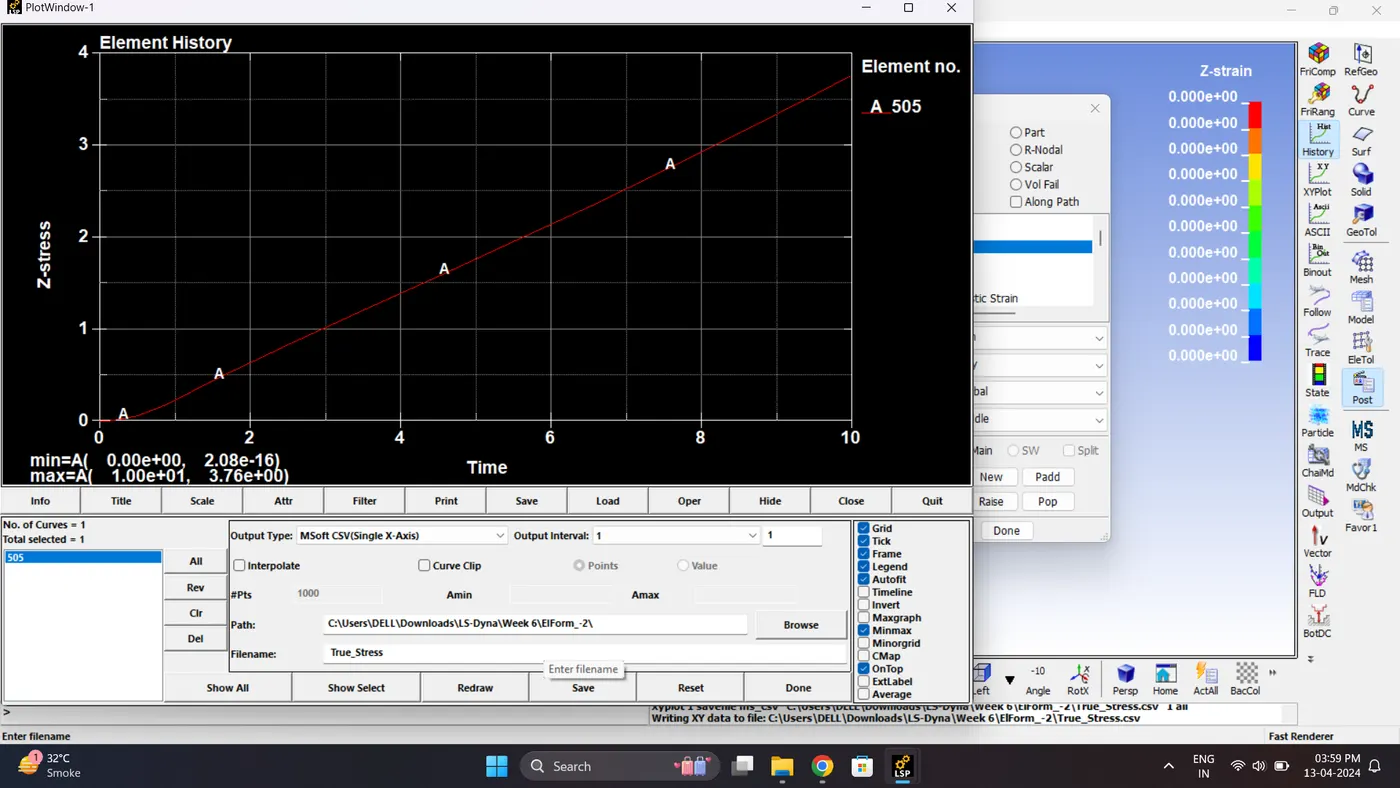
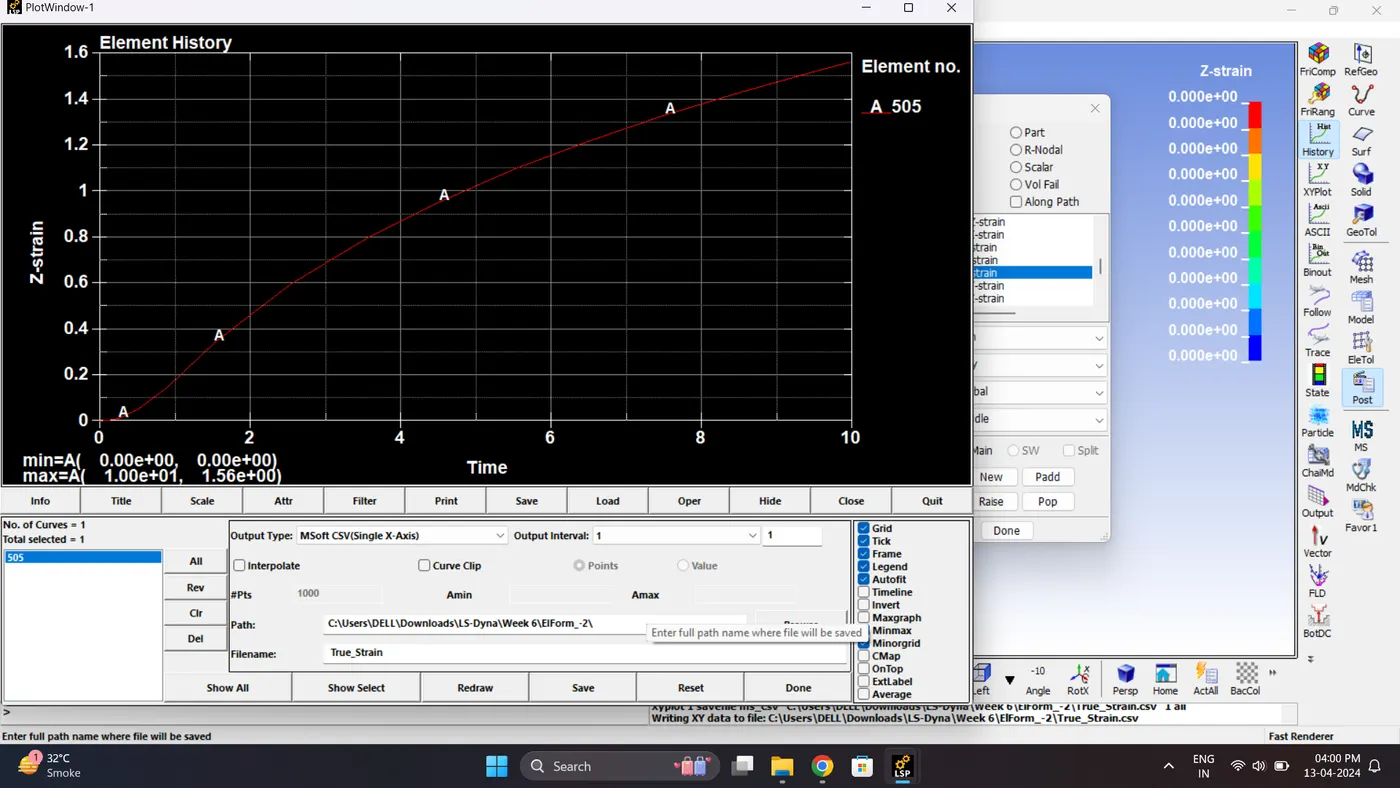
4. Repeat step 16 to 18 from case 1 and calculate engineering stress engineering strain and Stretch ratio.
5. Plot the Engineering stress vs Stretch ratio graph using excel data.
Comparison:
Stress
|
ElForm 1
|
ElForm 2
|
|
ElForm -1
|
ElForm -2
|
- Strain
|
ElForm 1
|
ElForm 2
|
|
ElForm -1
|
ElForm -2
|
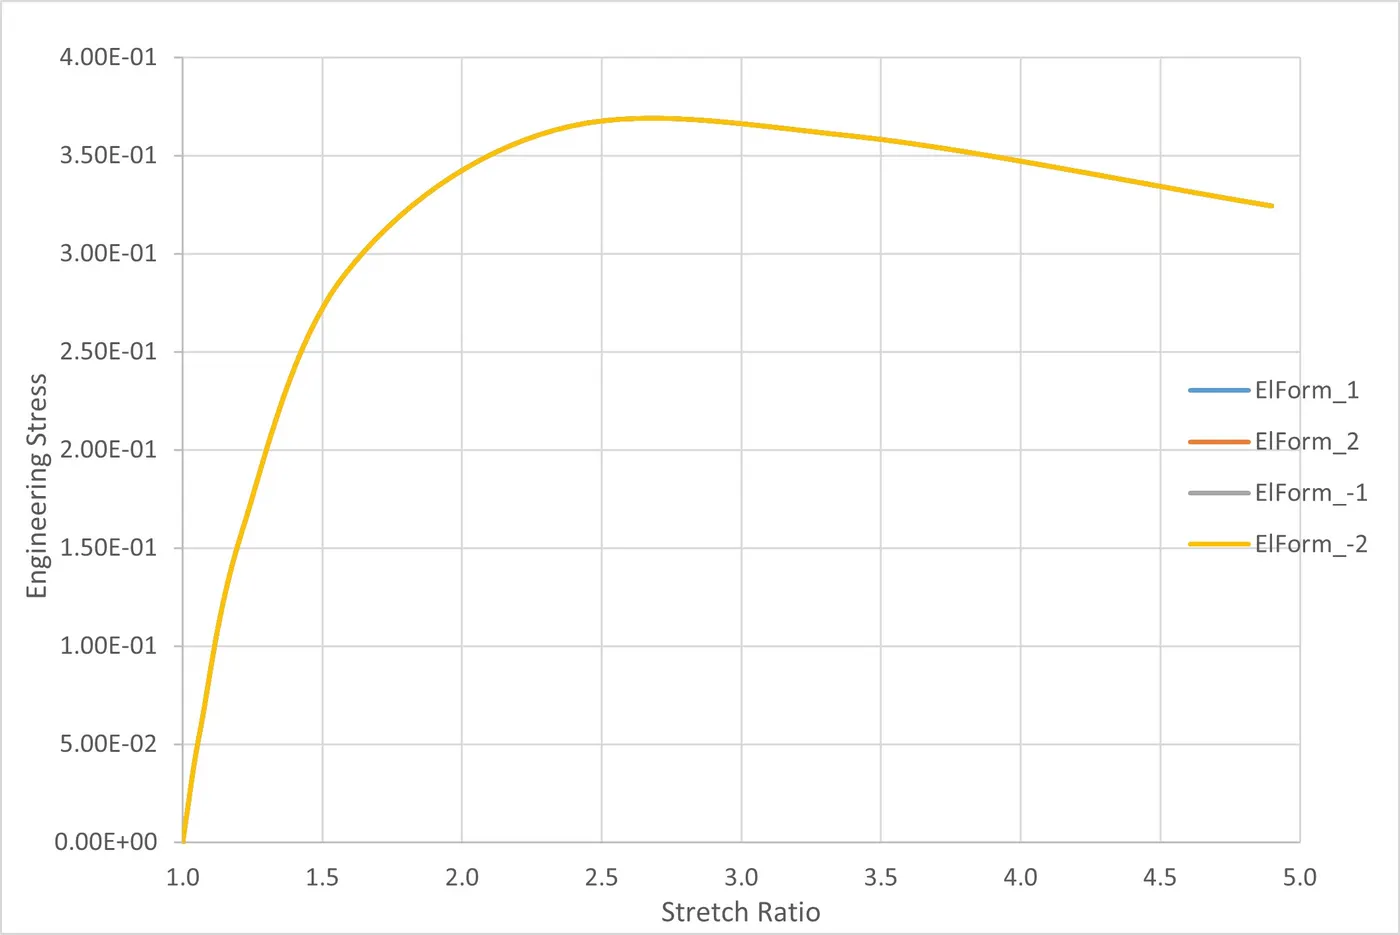
- Plots obtained from the simulation results, we can observe the Stress and Strain results are almost same for different solid element formulations.
- We can observe same stretch ratio for all different element formulations.
- But we can see the distribution of stress over the length of the cube is in different manner while stretching. This is due to different behavior of element formulations.
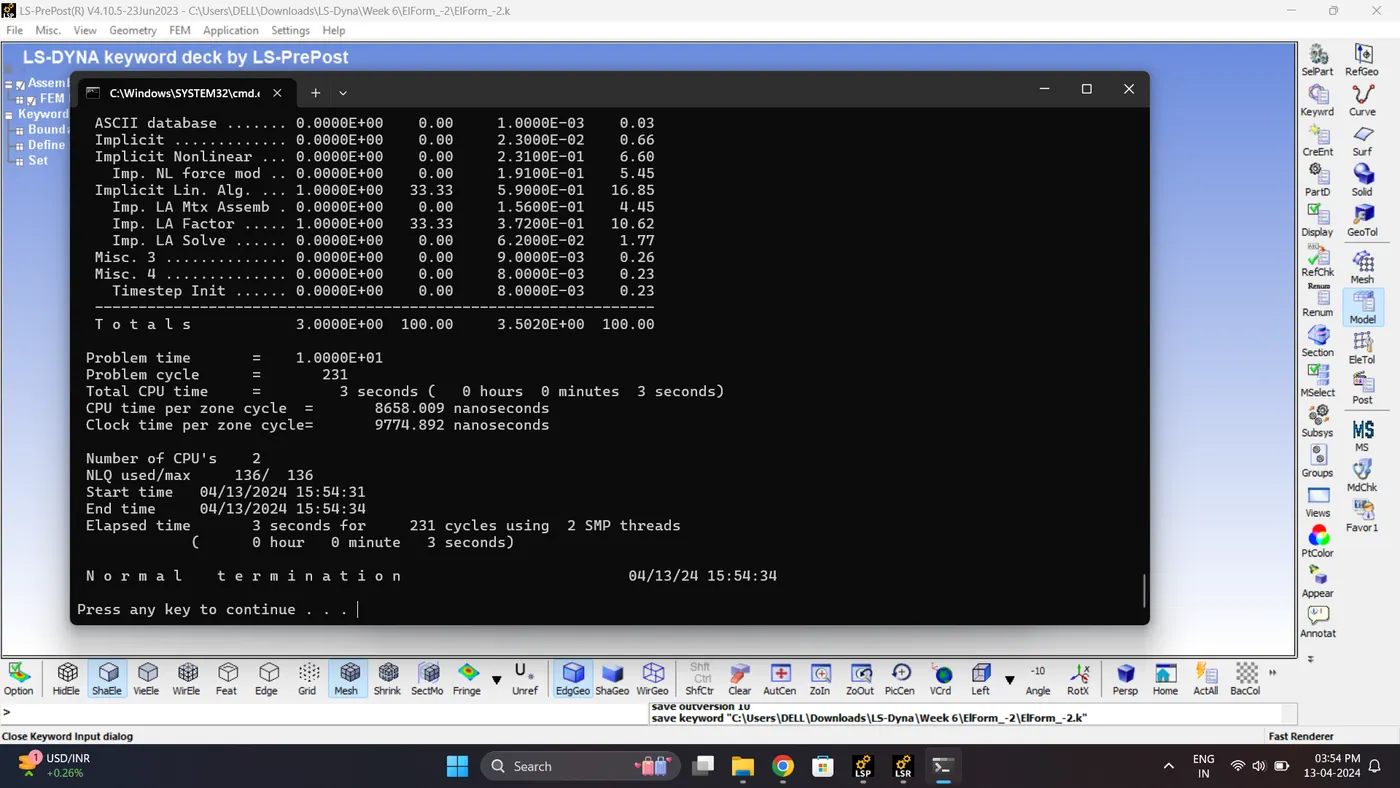
- From above Snaps, we can observe different cycles and computational time for different element formulation.
- We can see that in case of element formulation -2, it is taking highest time for computation.
Conclusion:
- Comparing the plot of Stress vs Stretch ratio for various element formulation, there is no significant difference in either the number of load steps required for convergence or variation in the results.
- Elform 1 : Constant stress solid element. It is efficient and accurate. Works well with severe deformation but needs hourglass stabilization.
- Elform 2: 8 point hexahedron. It is slower than Elform 1, becomes stiff in case of poor aspect ratio, may result in shear locking and unstable in large deformation but doesn’t need hourglass stabilization.
- Elform -1: 8 point hexahedron intended for elements with poor aspect ratios. It is identical with type 2, but accounted for poor aspect ratio in order to reduce shear locking.
- Elform -2: 8 point hexahedron intended for elements with poor aspect ratios. It is identical with type 2, but accounted for poor aspect ratio in order to reduce shear locking but with higher computational cost than elform -1.
- Though there is change in the way of calculation for different element formulation, the stress and strain values in the above plots are identical because of the simple model with elements having good aspect ratio that is there is no much variation in the values and taken for convergence are comparable