Simulation of Sphere pressing on a plate using Ansys-Workbench
AIM: The aim of this simulation is to perform the analysis to simulate a sphere pressing on a plate with a Non-linear material and capture the Plastic Deformation.
OBJECTIVE:
- Performing analysis to simulate a sphere pressing on a plate. We will be using Structural Steel for the Ball and Non-Linear Structural Steel for the Plate.
PROCEDURE:
Once we open the Workbench project we need to upload the 3-D model in Iges or Step file into the Geometry model.
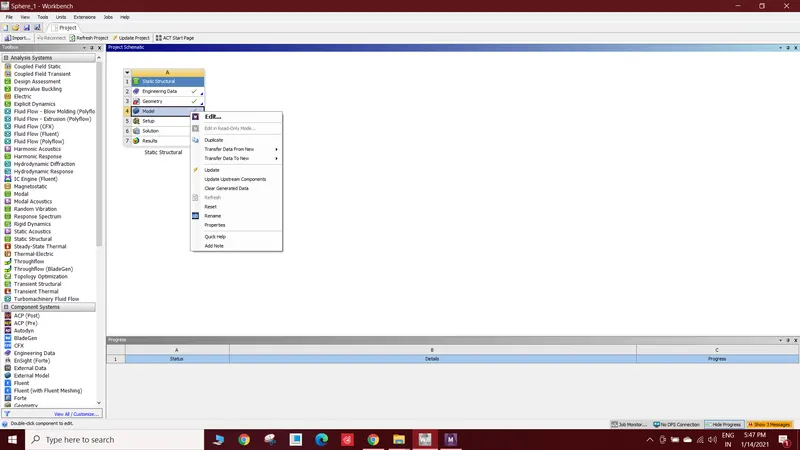
Once we upload the model it is recommended to open the model once in Space claim and then open the Mechanical Model. We can select the Material we need from the Engineering Data. The Plate will be Non-Linear Structural Steel and Ball Linear Structural Steel.
In the below image you can see the Material properties.
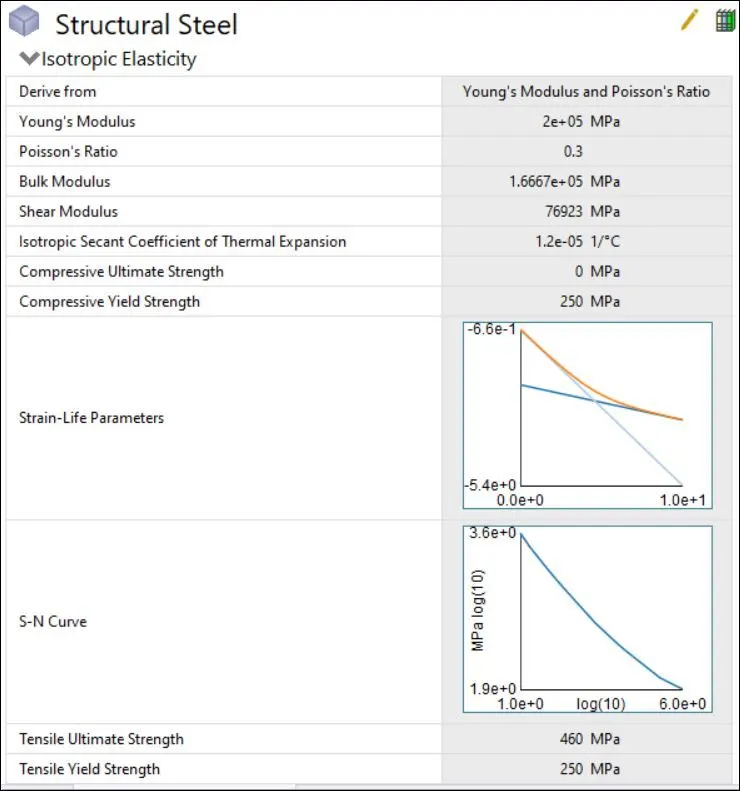
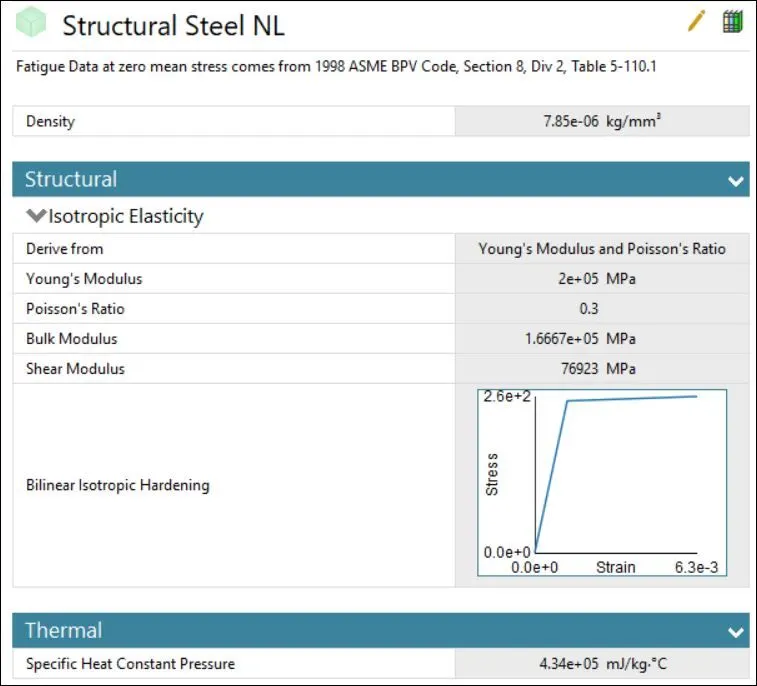
Since this is a Symmetric Model inorder to reduce the computational time we will be using only a Quater of the model. Using the Symmetry Region command we can view the result the same as the Whole model.
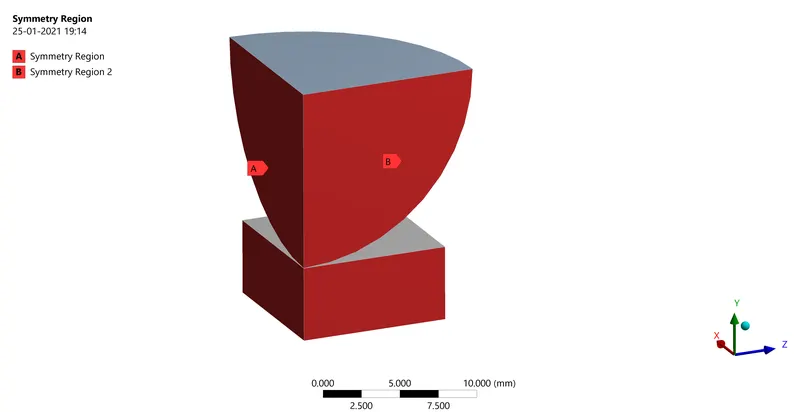
The Symmetrical surfaces in the Model are selected and given the Symmetric command.
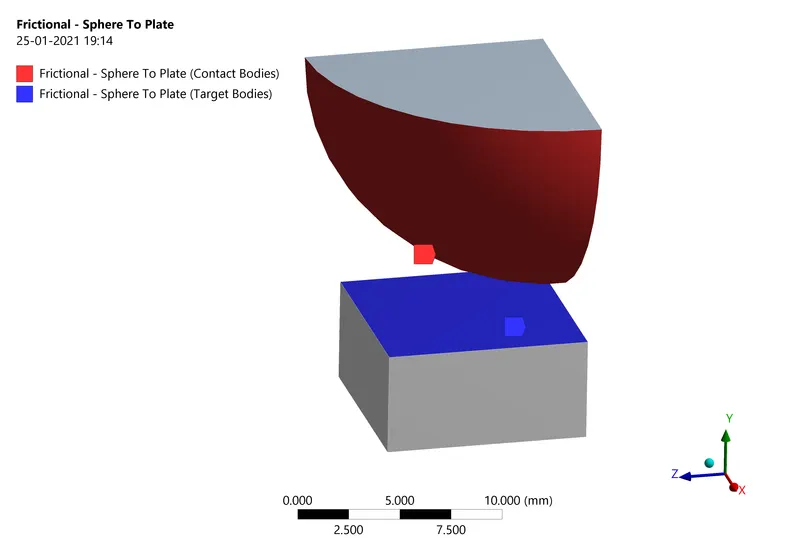
Frictional contact between these surfaces is given. The Friction coefficient is 0.74 and the interface treatment is Add offset with ramped effects.
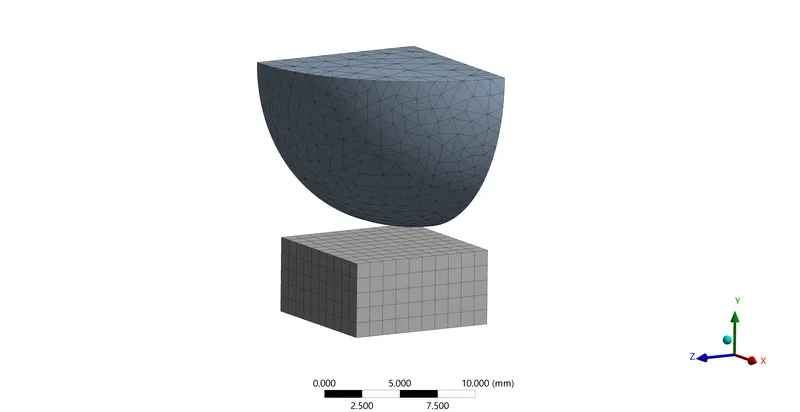
We have provided a Fairly good mesh with an Element size of 1mm. The number of nodes is 5198 and the number of elements is 1861. Now can provide the loading conditions.
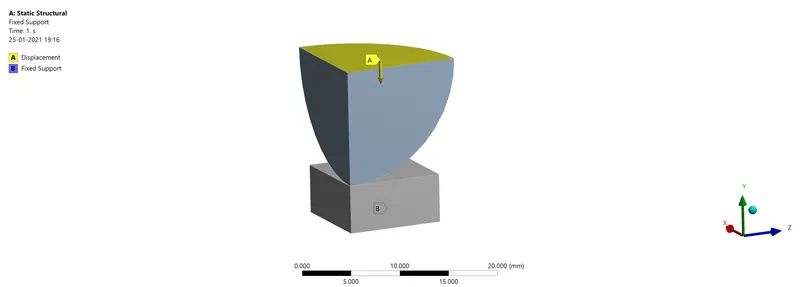
The Lower surface of the plate is given with Fixed support and the Yellow surface from the sphere is given a displacement of 4mm. The Displacement is given in such a way that for the first two-time step the sphere will reach 4mm and after that again return to its original position.
RESULTS:
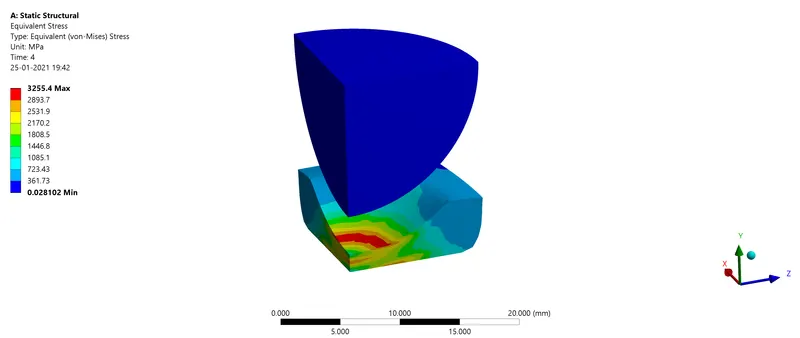
EQUIVALENT STRESS:
GRAPH:
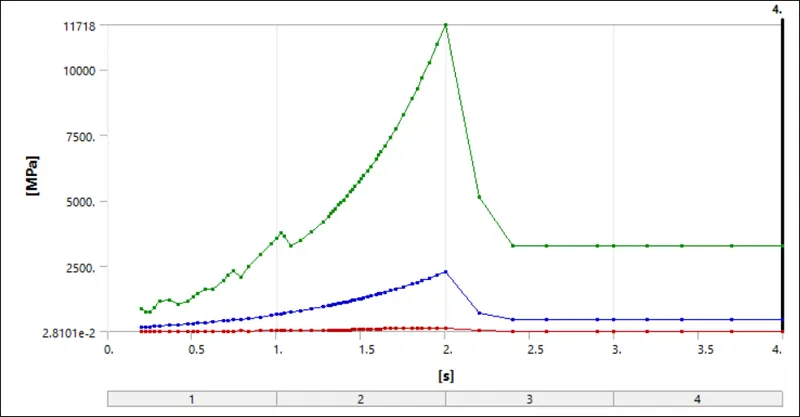
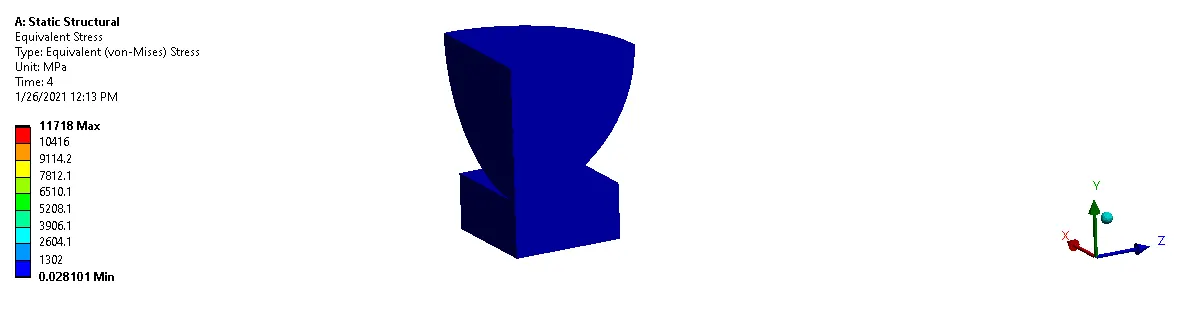
The maximum Stress formed in the Plate is 11718 MPa. The maximum stress is formed when the Sphere reached 4mm displacement into the plate.
STRESS TABLE:
| Time(s) | Minimum(Mpa) | Maximum(Mpa) | Average(Mpa) |
| 0.2 | 2.3128 | 871.81 | 153.87 |
| 0.2245 | 2.6006 | 734.45 | 171.43 |
| 0.249 | 2.9339 | 736.51 | 185.93 |
| 0.2735 | 3.1357 | 919.72 | 197.08 |
| 0.31025 | 3.478 | 1152.3 | 210.22 |
| 0.36538 | 5.4658 | 1183.2 | 232.25 |
| 0.4205 | 7.6875 | 1044.6 | 254.31 |
| 0.47562 | 5.9821 | 1140 | 282.14 |
| 0.50457 | 4.3967 | 1327.1 | 296.7 |
| 0.53351 | 2.7203 | 1441.5 | 311.71 |
| 0.57692 | 3.3886 | 1606.2 | 333.83 |
| 0.62033 | 6.049 | 1597.5 | 358.08 |
| 0.68544 | 12.75 | 1935.5 | 396.87 |
| 0.71541 | 16.598 | 2143.7 | 416.39 |
| 0.74537 | 20.297 | 2338.6 | 437.6 |
| 0.79031 | 25.015 | 2066 | 469.64 |
| 0.83525 | 17.622 | 2473 | 502.69 |
| 0.90267 | 34.113 | 2943.2 | 556.97 |
| 0.97008 | 39.409 | 3371.4 | 614.87 |
| 1 | 40.137 | 3577.1 | 642.54 |
| 1.0245 | 39.189 | 3772.5 | 665.92 |
| 1.049 | 37.949 | 3630.2 | 690.02 |
| 1.0857 | 39.762 | 3268.9 | 726.95 |
| 1.1409 | 43.75 | 3495.4 | 784.21 |
| 1.2088 | 48.487 | 3806.3 | 858.57 |
| 1.2766 | 45.87 | 4201.7 | 938.68 |
| 1.3072 | 47.133 | 4409.4 | 981.95 |
| 1.3209 | 46.498 | 4500.2 | 999.48 |
| 1.3347 | 47.805 | 4597.3 | 1020.4 |
| 1.3484 | 48.733 | 4691.7 | 1039.7 |
| 1.3691 | 48.869 | 4827.6 | 1066.8 |
| 1.383 | 49.323 | 4924.1 | 1086.2 |
| 1.3969 | 52.715 | 5027.5 | 1107.8 |
| 1.4178 | 53.546 | 5170.5 | 1135.1 |
| 1.4387 | 59.533 | 5331.4 | 1168.3 |
| 1.4527 | 62.457 | 5439.1 | 1189 |
| 1.4668 | 64.232 | 5545.2 | 1208.9 |
| 1.488 | 71.851 | 5716.2 | 1243.5 |
| 1.5022 | 73.15 | 5826.6 | 1262.9 |
| 1.5165 | 77.725 | 5949.8 | 1287.8 |
| 1.5379 | 80.325 | 6123.7 | 1319.3 |
| 1.5593 | 87.588 | 6313.8 | 1356.5 |
| 1.5914 | 91.433 | 6591.7 | 1406.2 |
| 1.6059 | 94.943 | 6730.7 | 1432 |
| 1.6203 | 99.271 | 6870.9 | 1457.6 |
| 1.642 | 106.44 | 7084.5 | 1497.2 |
| 1.6745 | 111.98 | 7405.4 | 1553.1 |
| 1.707 | 111.43 | 7751.5 | 1615 |
| 1.7558 | 111.6 | 8287.1 | 1705.9 |
| 1.8045 | 112.88 | 8885.3 | 1811.9 |
| 1.8341 | 112.87 | 9267.1 | 1872.5 |
| 1.8636 | 113.23 | 9668.8 | 1939.8 |
| 1.9079 | 113.14 | 10282 | 2035.9 |
| 1.9522 | 115.09 | 10954 | 2148.9 |
| 2 | 116.56 | 11718 | 2269.2 |
| 2.2 | 48.157 | 5132.6 | 691.44 |
| 2.4 | 2.81E-02 | 3255.3 | 459.56 |
| 2.6 | 2.81E-02 | 3255.4 | 459.57 |
| 2.9 | 2.81E-02 | 3255.4 | 459.56 |
| 3 | 2.81E-02 | 3255.4 | 459.56 |
| 3.2 | 2.81E-02 | 3255.4 | 459.56 |
| 3.4 | 2.81E-02 | 3255.4 | 459.56 |
| 3.7 | 2.81E-02 | 3255.4 | 459.56 |
| 4 | 2.81E-02 | 3255.4 | 459.56 |
DIRECTIONAL DEFORMATION:
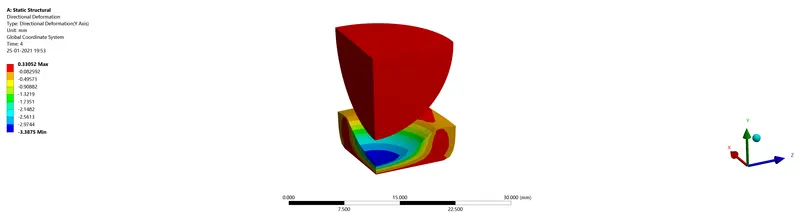
The above image shows the Directional Deformation along Y-Axis.
EQUIVALENT PLASTIC STRAIN:
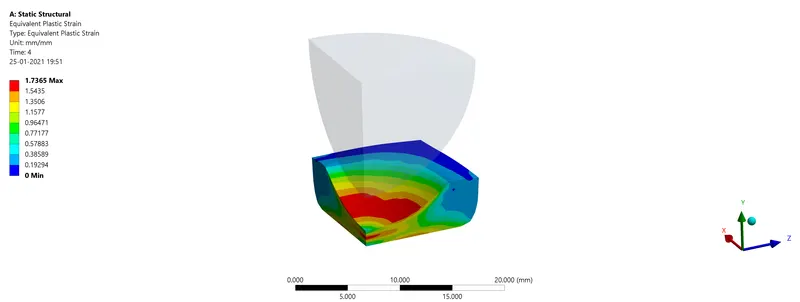
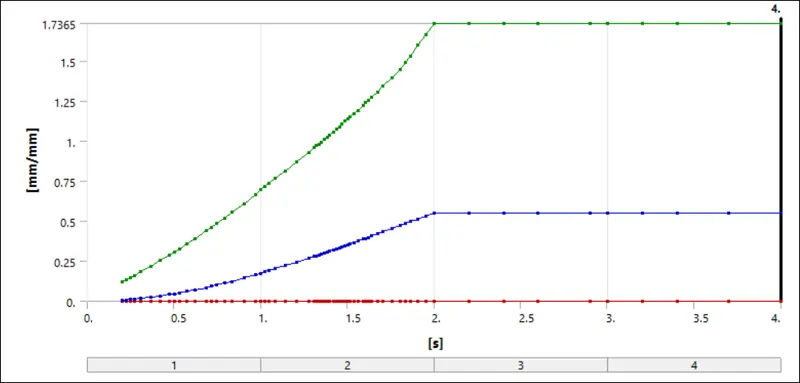
The Maximum Plastic Strain formed is 1.7365mm/mm. Once the plate reached this value this same value is maintained along with the whole simulation. You can see the Plastic strain Graph below.
PLASTIC STRAIN GRAPH:
EQUIVALENT ELASTIC STRAIN:
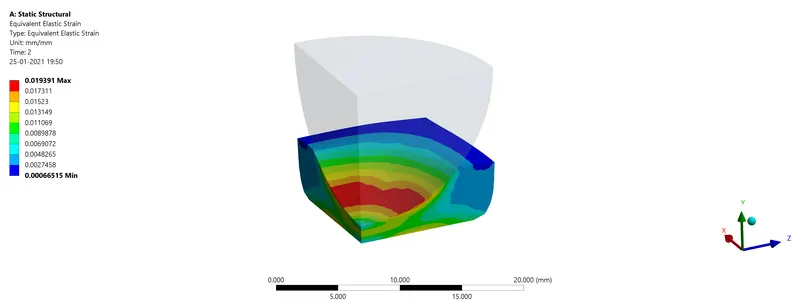
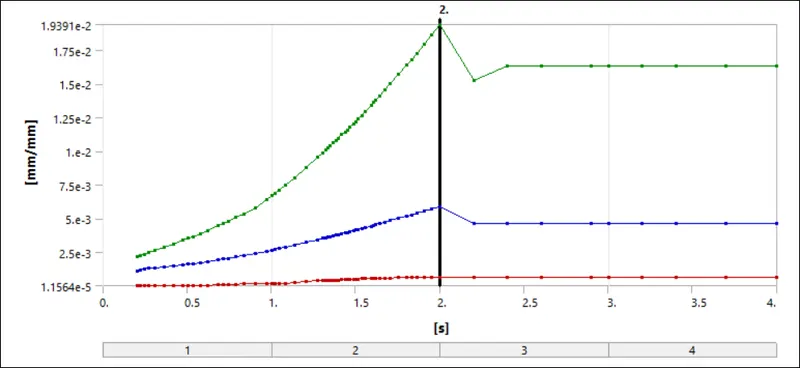
The Maximum Elastic Strain formed is 0.019391mm/mm. This is reached at the time of 2 Seconds when the sphere has displaced a Distance of 4mm along the negative y-axis.
GRAPH:
CONCLUSION:
From the above results, we can see the Plastic deformation of the Plate at the end of the Simulation. The Plastic Strain formed is much higher than the Elastic Strain as its a Non-Linear material. Also, we can see that once the maximum Plastic Strain is reached it remains constant.