Week 5 Sphere pressing on a plate
Case Study for the Plastic Deformation of the Sphere Pressing over the flat plate.
Objective:
Analysis to simulate a sphere pressing on a plate is to be performed.
Use Structural steel for both sphere and plate but the material of the plate must be Non Linear.
Press the sphere onto plate 4mm downwards and retract it. The plastic deformation must be captured by you. Attach appropriate images and make a detailed report.
Procedure:
Static Structural Analysis is carried out on Sphere over the flat plate. The material of the plate is Structural Steel NL & Displacement for the 4 Step is given. The geometry of the model is imported on the Ansys Workbench for analysis. The Workpiece is first modified in the space claim.
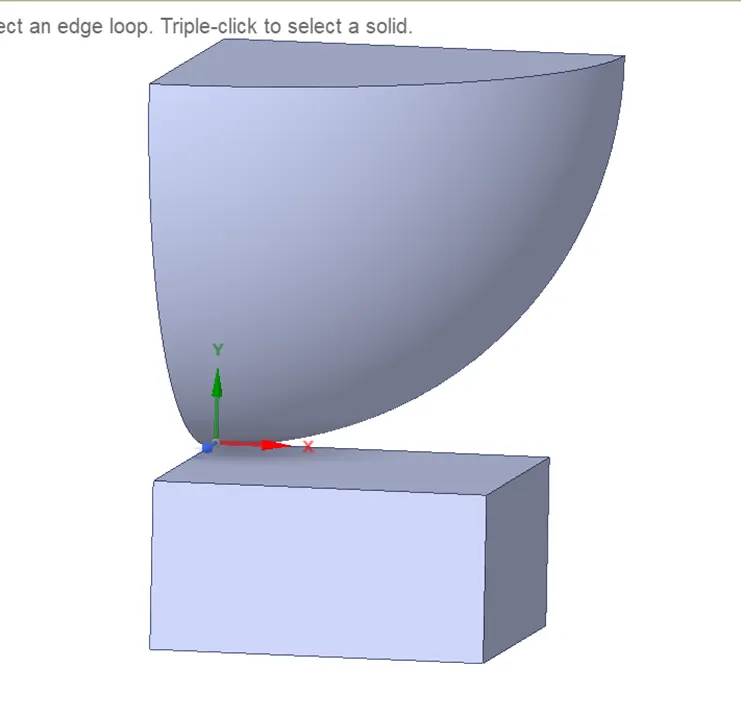
2D Geometry is extruded in the Space Claim to get the model to be imported to the ANSYS. The Extruded model is as shown in the image below:
The properties of the material i.e Structural Steel NL is stated below:
|
Density |
|
||
|
Young's Modulus |
|
||
|
Poisson's Ratio |
|
||
|
Bulk Modulus |
|
||
|
Shear Modulus |
|
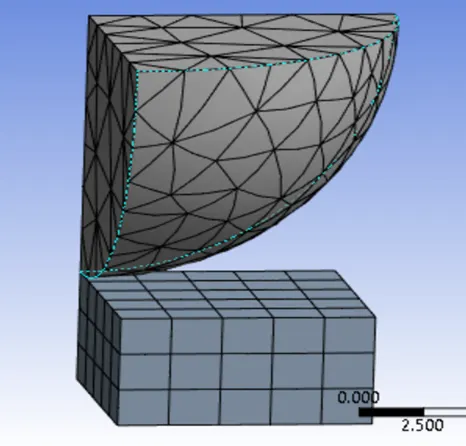
The model is meshed using Ansys Mesher with a default element size, and a patch conforming method using tetrahedrons was employed. This is done to get the best refinement within the limitation of Ansys Academic License.
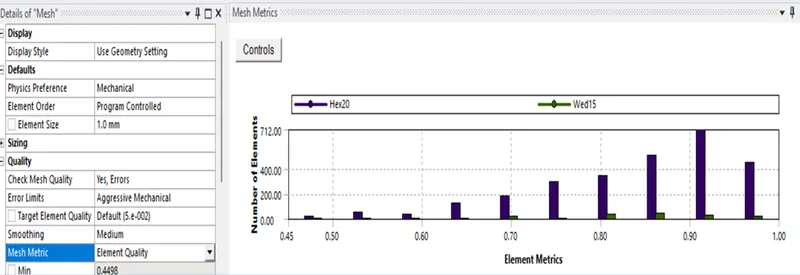
A mesh metric that identifies the elements according to their quality was employed and it can be seen that element of lowest quality are minimal. Most of the elements have very high quality in the range of 0.7-1. Hence, the mesh is of acceptable quality. The meshed model is shown in image below:
The simulation is then run with the setting and the results are then obtained.
Results:
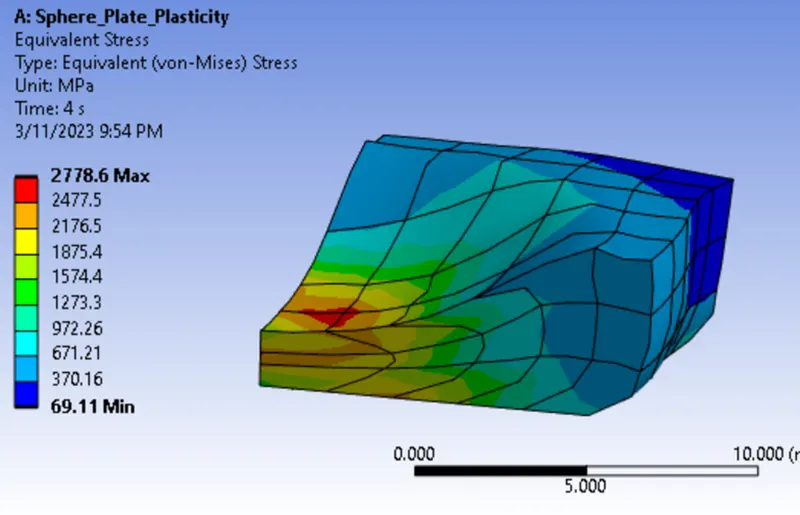
Equivalent Stress for the Model.
Time [s] Minimum [mm] Maximum [mm] Average [mm]
- 69.11 2778.6 876.33
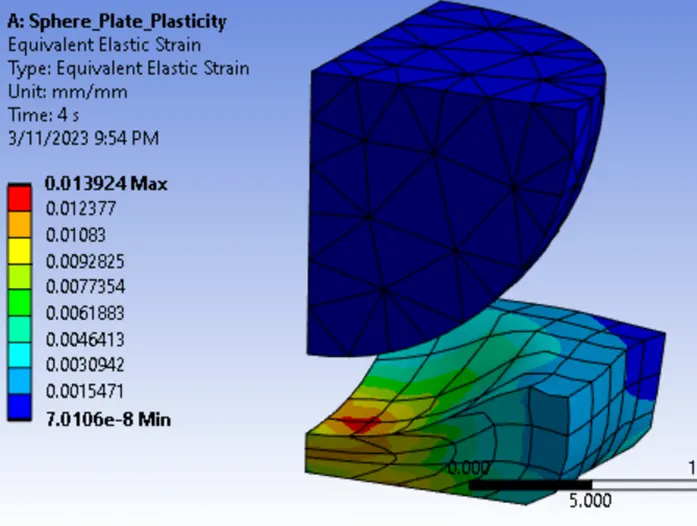
Equivalent Elastic Strain for the Workpiece.
Time [s] Minimum [mm] Maximum [mm] Average [mm]
- 7.0106e-008 1.3924e-002 2.1054e-003
Plastic Deformation in the Y-Axis.
Time [s] Minimum [mm] Maximum [mm] Average [mm]
- -3.3548 0.35598 -0.15258
The Equivalent Stress for the model is as plotted and is shown below.
The Equivalent Elastic strain is plotted on the Model and is as shown below.
The Plastic Deformation in the Y-Axis is plotted on the workpiece and is as shown below.
Conclusion:
The Analysis was run succesfully, within the limits of the academic license, the simulation for the case were examined. And as evident from the “Plastic Deforamtion” plot in Y-Axis, the maximum deformation is 0.35598 mm in the Y-direction.