Week - 5 - Modelling Spotwelds
Aim: Numerical Simulation of spotweld and obtain the effect of the beam and the solid element.
Unit System: gm-mm-ms
Explanation: Using the given set of elements, a crash test case was evaluated. 3 spotwelds were defined using beam elements with ELFORM-9 and solid elements with ELFORM-1. Shell thickness of 1.2mm was defined for the top and bottom fixtures.
Contact Formulation: TIED_SHELL_EDGE_TO_SURFACE contact was used to define the contact between the beam and shell section whereas spotweld contact was used to define the contact between solid elements and shell section. Apart from these contacts, AUTOMATIC_SINGLE_SURFACE contact was utilised to prevent penetration of the shell section.
Material Model: MAT Spotweld with Steel properties was utilised to define the material properties of the spotweld in the simulation.
Impact Velocity: The test specimen was given an initial velocity of 50kmph using the Intial_Velocity_Generation option.
Failure Modelling: Time based failure was adopted in the simulation where the failure timing was defined at 5ms whereas the termination time of the simulation was defined to be 10ms.
Results and Discussions
1. Energy Comparision for Beam and Solid Spotweld
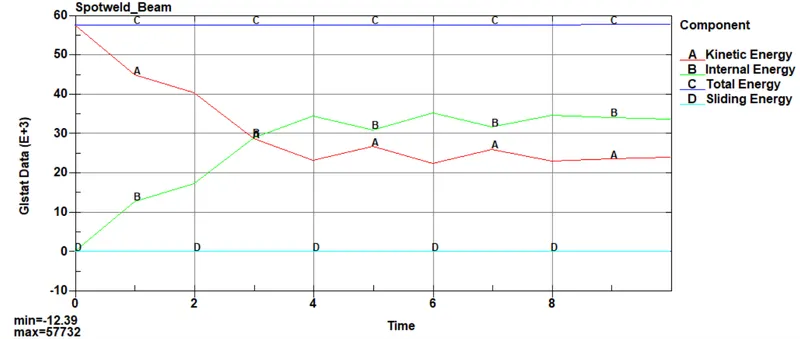
Fig 1. Represents the Energy curve for Beam Element
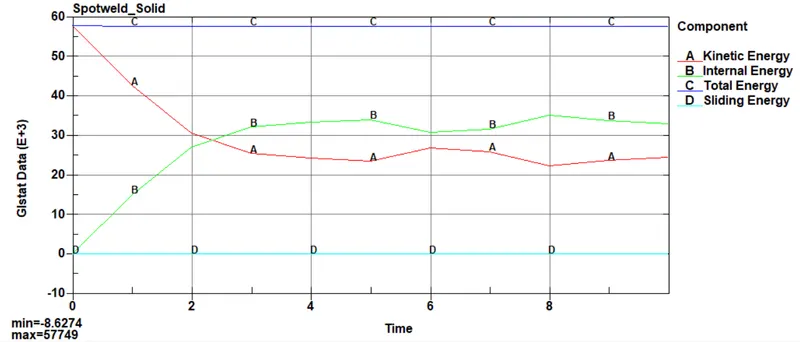
Fig 2. Represents the Energy curve for Solid Element
On comparing the results of the energy plot for beam and solid elements, both the system produce similar results with minimal deviation.
2. Maximum Directional Stress comparison
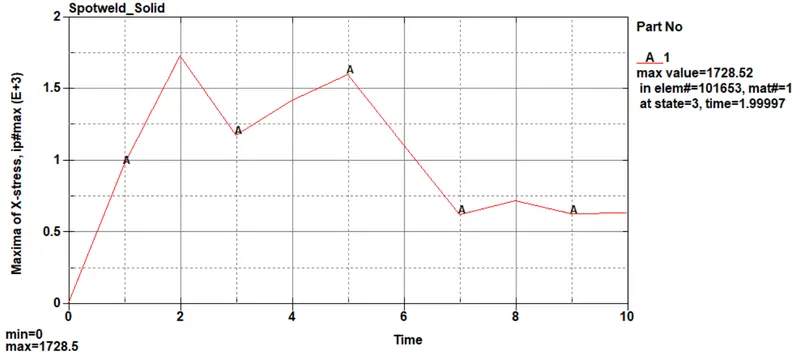
Fig 3. Represents the Max X- Stress on the impacting body with Solid Elements
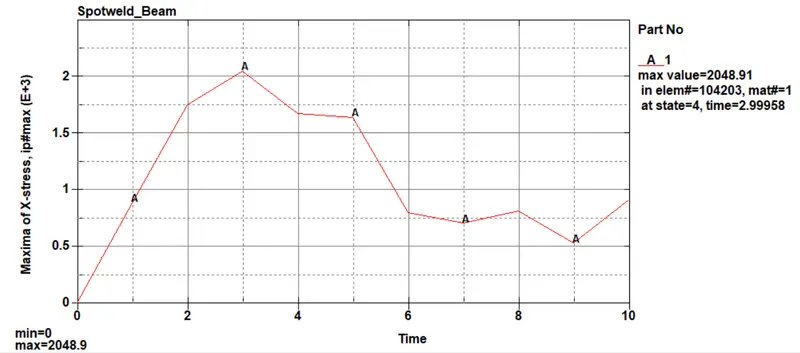
Fig 4. Represents the Max X- Stress on the impacting body with Beam Elements
Maximum Stress along the length of the crash box was obtained for Beam and Solid element spotweld. The peak stress obtained for the beam element was about 2048.9 MPa whereas Solid elements generated a peak Stress of about 1728.5 MPa. It was also observed that the peak stress was obtained earlier in solid element spotweld as compared to beam element spotweld.
3. Section Force Comparision
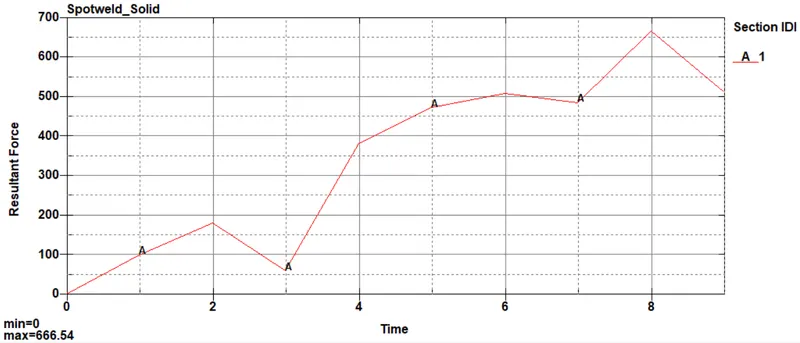
Fig 5. Represents resultant section force with Solid Elements
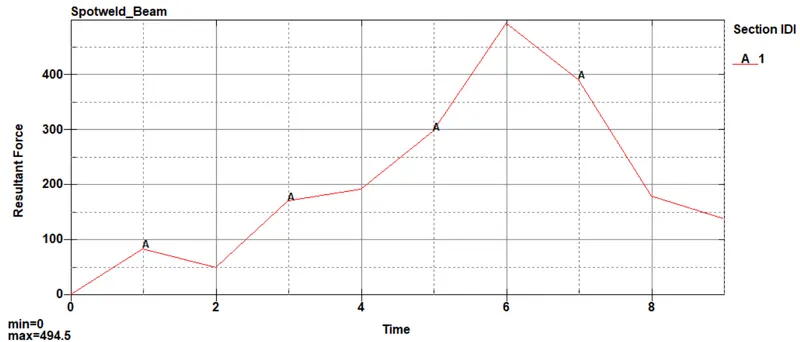
Fig 6. Represents resultant section force with Beam Elements
Maximum Section Force along the length of the crash box was obtained for Beam and Solid element spotweld. The peak section force obtained for the beam element was about 494.5N whereas Solid elements generated a peak section force of about 666.54N.
4. Axial and Shear Force comparison for Beam and Solid Elements
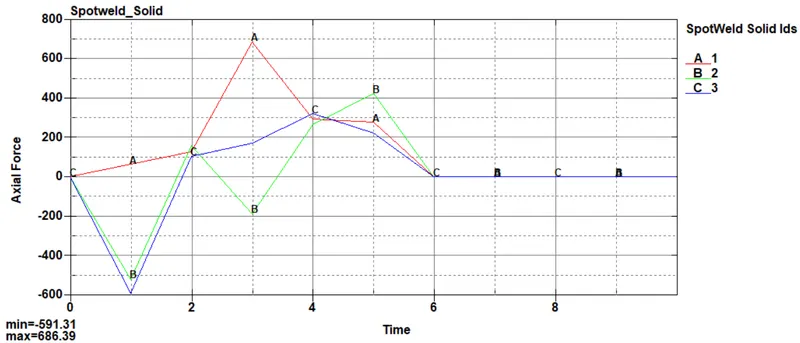
Fig 7. Represents axial force for the three solid elements
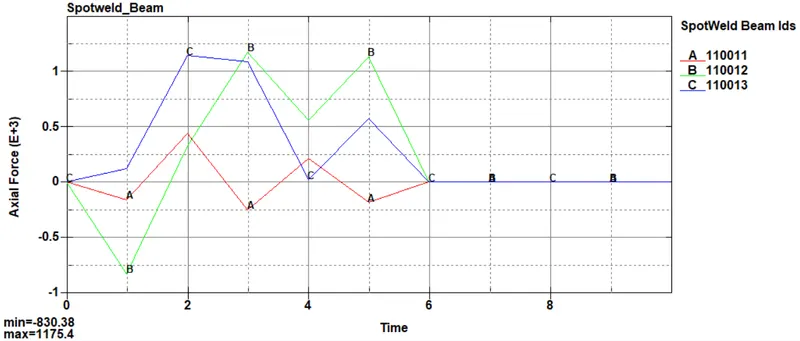
Fig 8. Represents axial force for the three beam elements
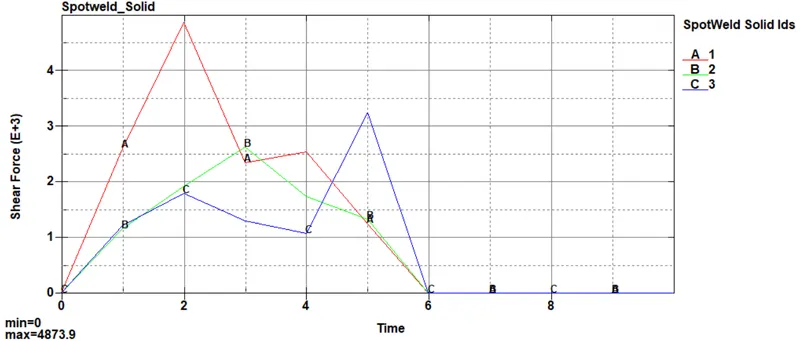
Fig 9. Represents shear force for the three solid elements
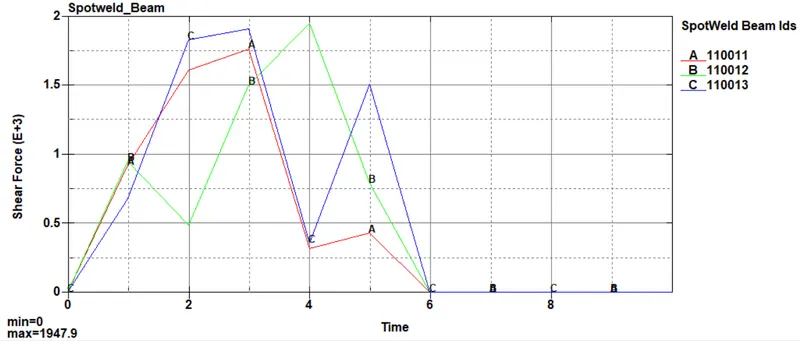
Fig 10. Represents shear force for the three beam elements
Maximum Axial Force of 686 N and 1175 N was obtained for Solid and Beam elements respectively whereas Maximum Shear Force obtained for Solid and Beam elements were about 4873N and 1947 N. There is a large variation that can be seen in the simulation of the beam and solid element results. this can be attributed to the fact that the crash impact is highly nonlinear and only three weld joints were used leading to the unsymmetric behaviour after impact. Thus, there was a significant difference obtained in the results.
Conclusion
The simulation consists of two components attached with 3 spotwelds using beam and solid elements. In many cases, there is a large variation that can be observed in the simulation of the beam and solid element results. This can be attributed to the fact that the crash impact is highly nonlinear and only three weld joints were used leading to the unsymmetric behaviour after impact. Thus, there was a significant difference obtained in the results.