Week - 4 - Crash Box Simulation
AIM: To simulate the effect of thickness of Crash Box on Impact performance.
1. Cross-Sectional force generated in the middle of the crash box in the transverse direction.
From Fig.1, a force of 0.0517 N was obtained as a peak force with no deformation at the contacting surface as the force due to impact is within the elastic limit.
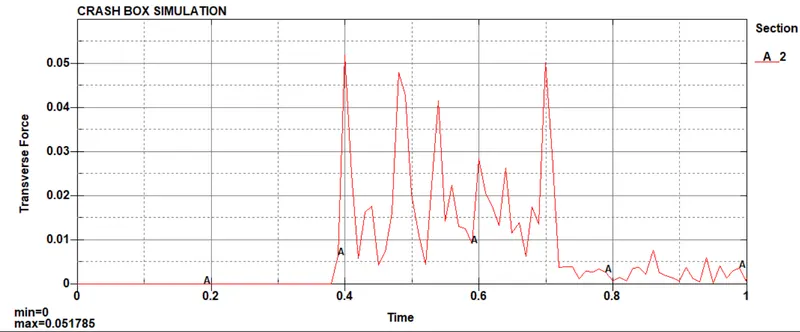
Fig:1 Transverse Contact Force
2. Acceleration plot of the crash box along its length
A node was selected at approximately the centre of the crash box to obtain the acceleration due to the induced velocity to the body.
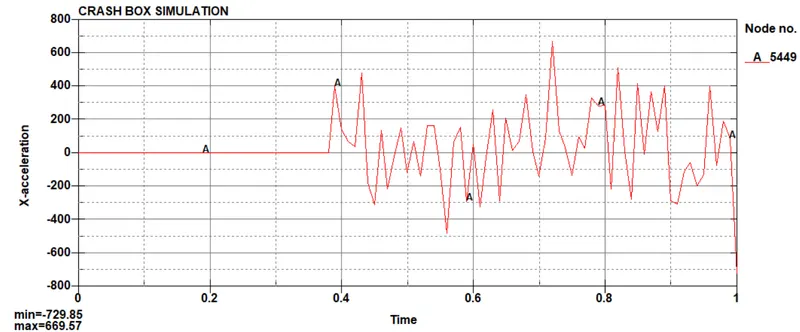
Fig:2 Acceleration Plot
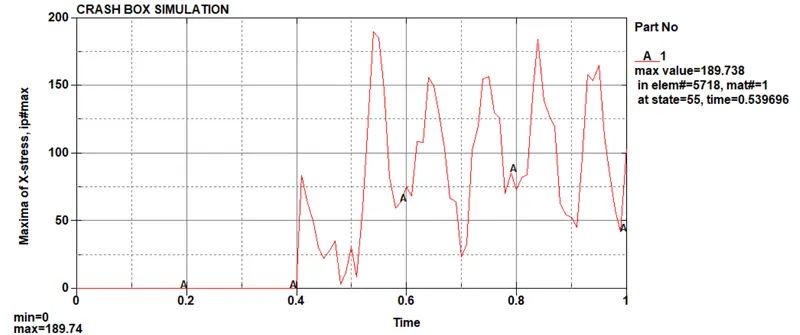
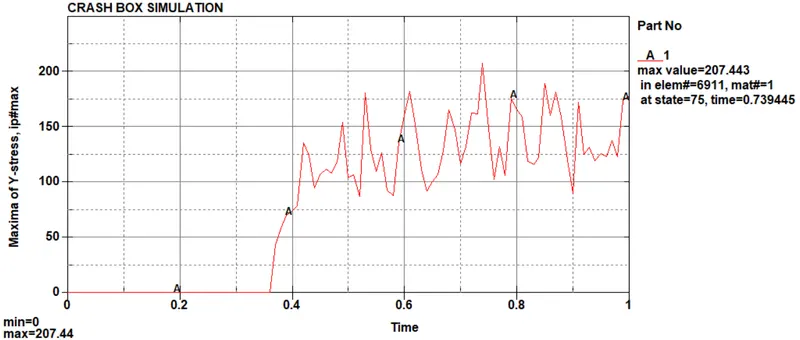
3. Maximum X- directional Stress in part
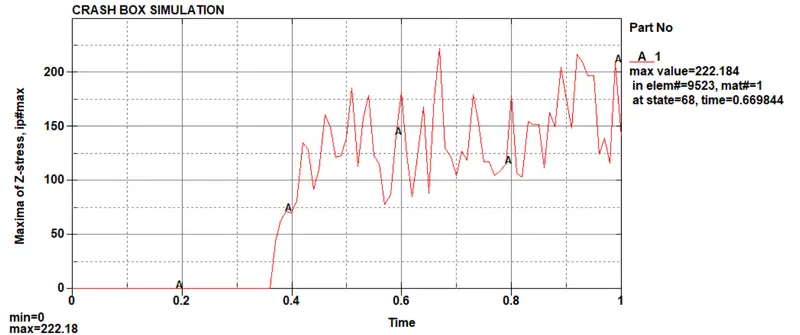
of the complete part was selected and the maximum directional stress was obtained about 189.73 MPa in the X direction, whereas the maximum stress of 207.44 MPa and 222.18MPa was obtained for the Y and Z axis respectively.
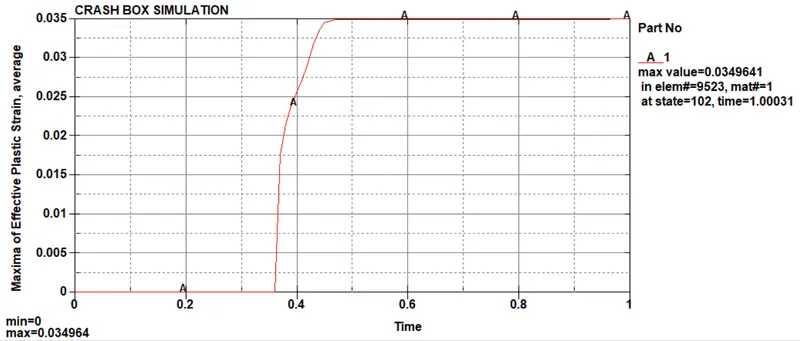
4. Effective Plastic Strain for the CrashBox.
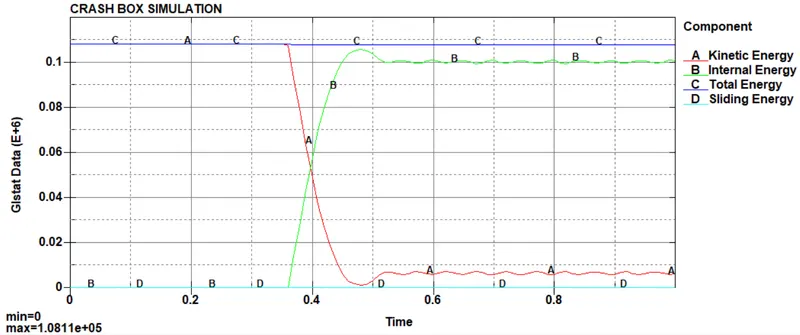
5. Energy Plot
In the simulation, the losses in the energy due to sliding was negligible compared to Internal and Kinetic Energy and the sum of the two energy obtained resulted in the total energy of the system representing the stable response of the system.
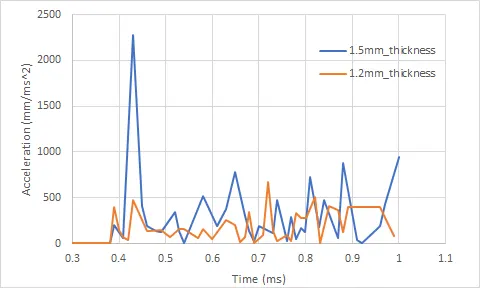
6. Comparison of X- acceleration for 1.2 mm and 1.5mm thickness crashbox. There was a significant rise in the acceleration due increase in thickness.
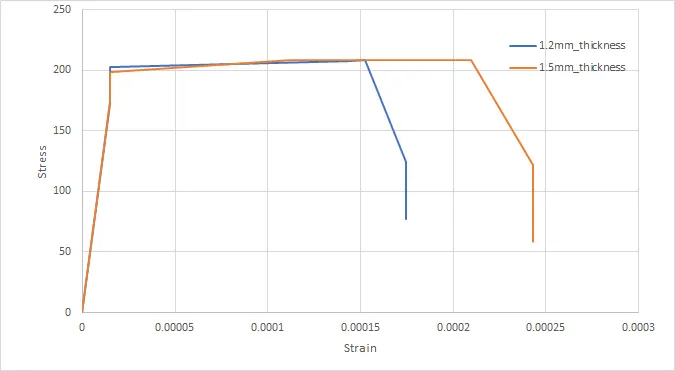
7. Stress Vs Strain Comparision for Different Thickness
A prominent increase in Strain is evident due to an increase in thickness, which is relevant to the fact that there was an increase in acceleration in the body resulting in more load acting on the cashbox. Thus, there was a significant increase in the strain observed in the body.
Conclusion
A comparative study was conducted to determine the effect of thickness on the acceleration and stress-strain curves for the given test case.
There was a significant increase in acceleration and strain observed due to an increase in the thickness of the crashbox.