Week 5 - Genetic Algorithm
AIM:
To Write a code in MATLAB to optimise the stalagmite function and find the global maxima of the function.
OBJECTIVES:
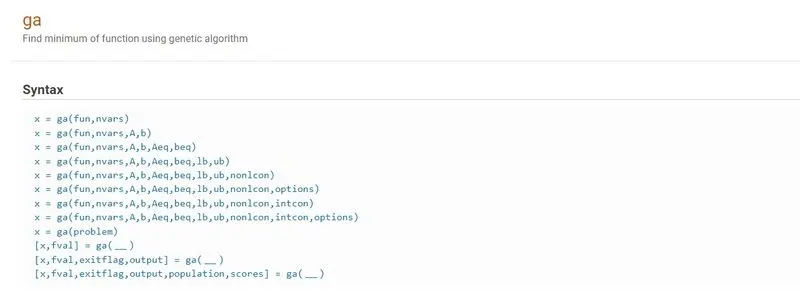
- Clearly explain the concept of genetic algorithm in your own words and also explain the syntax for ga in MATLAB in your report.
- Make sure that your code gives the same output, even if it is made to run several times.
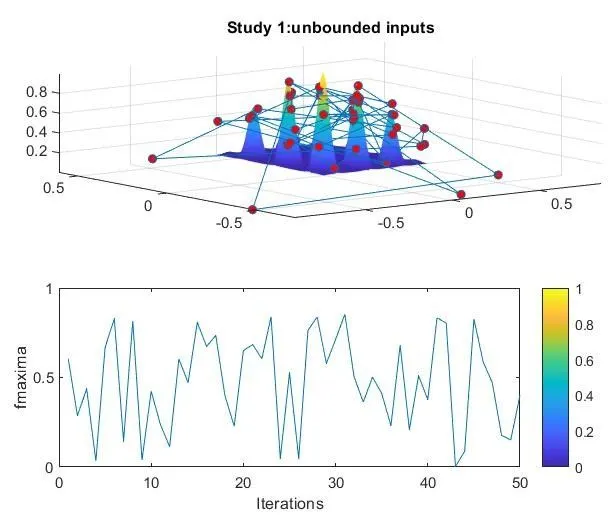
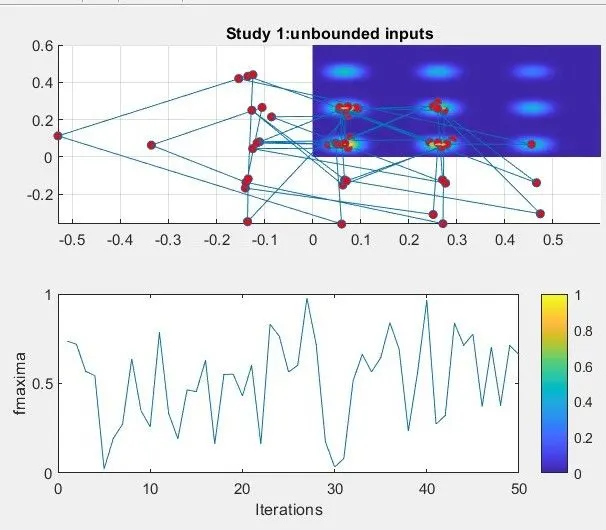
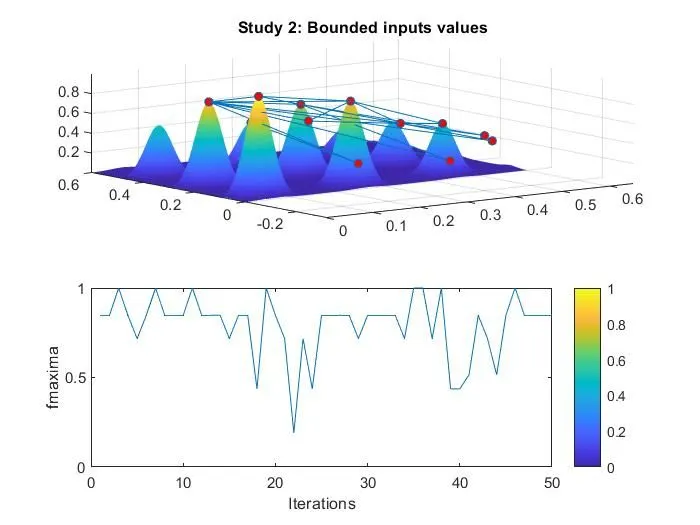
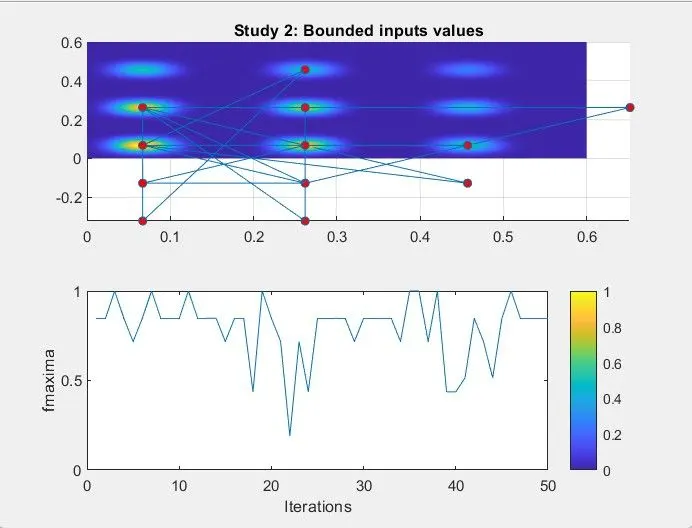
- Plot graphs for all 3 studies and for F maximum vs no. of iterations.
THEORY:
A genetic algorithm (GA) is a method for solving both constrained and unconstrained optimization problems based on a natural selection process that mimics biological evolution. The algorithm repeatedly modifies a population of individual solutions. At each step, the genetic algorithm randomly selects individuals from the current population and uses them as parents to produce the children for the next generation. Over successive generations, the population "evolves" toward an optimal solution.
You can apply the genetic algorithm to solve problems that are not well suited for standard optimization algorithms, including problems in which the objective function is discontinuous, nondifferentiable, stochastic, or highly nonlinear.

How it works:
In Genetic algorithm (GA), 'n' values form the function/problem are randomly selected (n is the population size). The values are selected after being sorted from the best to the worst ones first ('best' condition is subjected to the need). The GA selects the best and rejects the other values. Now, each selected value is mutated (n-1) times, i.e., some randomness is added to the values. Then, the mutated values are again checked against the minimum criteria condition. This iteration is continued up to the number of iterations decided.
Basic steps in genetic algorithm:

Genetic algorithm syntax in MATLAB:
ga(@stalagmite_fun,2)
Above is the syntax to determine minimum value of a function using MATLAB. Here ‘GA’ represents genetic algorithm, stalagmite_fun is the function name and 2 represents no. of varaibales.
In general it is of the form “x = ga(fun,nvars)”.
x = ga(fun,nvars,A, b,Aeq,beq,lb,ub)
above syntax defines or specifies upper and lower bounds of a variable x so that solution will be such that x lies between upper (ub) and lower bound (lb)
MATLAB CODING TO FIND THE GLOBAL MAXIMA:
FUNCTION CODE:
function[v]= stalagmite(input)

    x=input(1);
    y=input(2);

   f1_x1=(sin((5.1*3.14*x)+.5))^6;
   f1_y1=(sin((5.1*3.14*y)+.5))^6;
   f2_x2=exp(-4*log(2)*(x-.0667)^2/0.64);
   f2_y2=exp(-4*log(2)*(y-.0667)^2/0.64);
   [v]=-(f1_x1*f1_y1*f2_x2*f2_y2);
end
MAIN CODE:
clear all
close all
clc

% Defining the workspace
x = linspace(0, 0.6, 150);
y = linspace(0, 0.6, 150);

%Number of iterations
n = 50;

% creating the mesh grid

for i=1:length(x)
    for j= 1:length(y)
        input(1)=x(i);
        input(2)=y(j);
        f(i,j)=stalagmite(input);
    end
end


% study 1 - statistical behaviour of genetic algorithm
tic
for i = 1:n
    [inputs, fmax(i)] =  ga(@stalagmite,2);
    xopt(i) = inputs(1);
    yopt(i) = inputs(2);
end

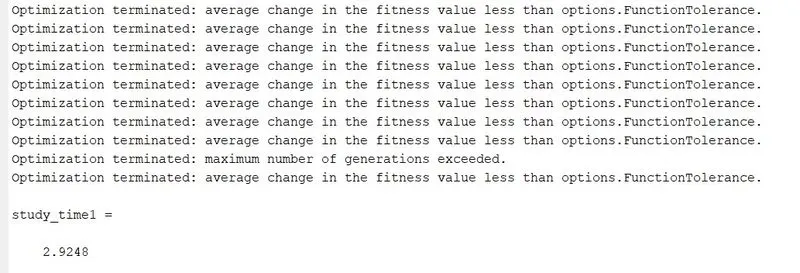
study_time1 = toc

% plotting study 1: unbound iteration case
figure(1)
subplot(2,1,1)
surfc(x,y,-f)
shading interp
hold on
plot3(xopt, yopt, -fmax, 'marker', 'o', 'markersize', 5, 'markerfacecolor', 'r')
title('Study 1:unbounded inputs')
subplot(2,1,2)
plot(-fmax)
xlabel('Iterations')
ylabel('fmaxima')
colorbar()


% study 2 - statistical behaviuor - with upper and lower bounds
tic
for i = 1:n
     [inputs, fmax(i)] =  ga(@stalagmite,2,[],[],[],[],[0:0],[1:1]);
     xopt(i) = inputs(1);
     yopt(i) = inputs(2);
end

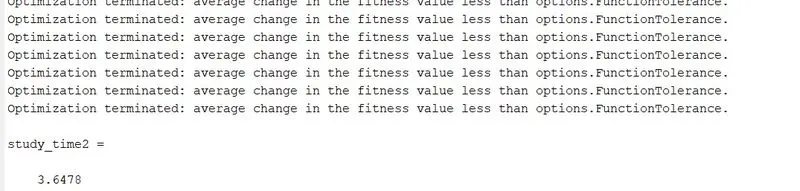
study_time2 = toc

% plotting study 2: bound iteration case
figure(2)
subplot(2,1,1)
surfc(x,y,-f)
shading interp   %makes the surface look more smoother
hold on
plot3(xopt, yopt, -fmax, 'marker', 'o', 'markersize', 5, 'markerfacecolor', 'r')
title('Study 2: Bounded inputs values')
subplot(2,1,2)
plot(-fmax)
xlabel('Iterations')
ylabel('fmaxima')
colorbar()


%Stydy 3 increasing GA iteration
options = optimoptions('ga');
options = optimoptions (options, 'PopulationSize', 500);
tic
for i = 1:n
    [inputs, fmax(i)] =  ga(@stalagmite,2,[],[],[],[],[0:0],[1:1], [],[],options);
    xopt(i) = inputs(1);
    yopt(i) = inputs(2);
end

study_time3 = toc

% plotting  study 3 : Bounded inputs with modified population size
figure(3)
subplot(2,1,1)
surfc(x,y,-f)
shading interp   %makes the surface look more smoother
hold on
plot3(xopt, yopt, -fmax, 'marker', 'o', 'markersize', 5, 'markerfacecolor', 'r')
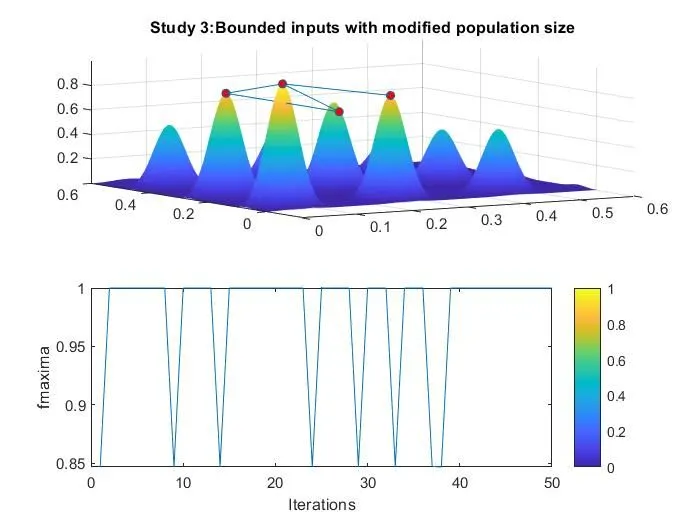
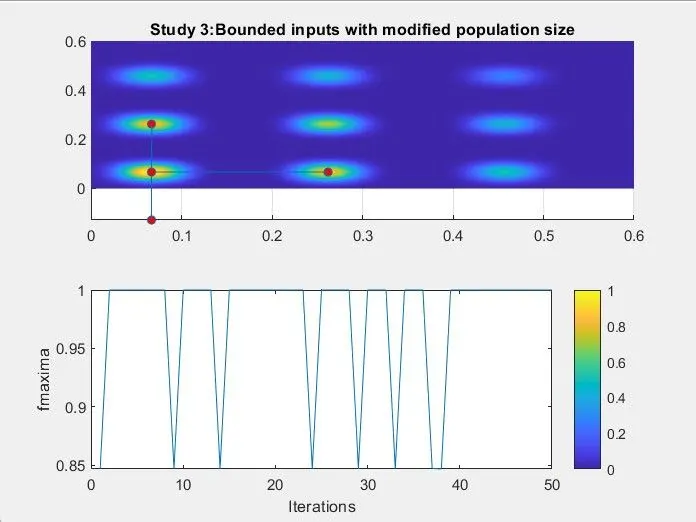
title('Study 3:Bounded inputs with modified population size')
subplot(2,1,2)
plot(-fmax)
xlabel('Iterations')
ylabel('fmaxima')
colorbar()
STEP BY STEP EXPLANATION OF THE CODE:
- Initially stalagmite function is defined in a seperate script, the formula is broken down into 4 terms.
- Then starting with the main code where we define two inputs x and y both of which are one dimensional equally spaced array containing 150 elements. We utilize mesh grid command to create an array of x and y values.
- Now we use for loop to input values of the 2D array in stalagmite function. GA is used to determine the optimal of the function.
- For the program for Genetic Algorithm, 3 studies are used to optimize the function so that we can accurately find the global maxima of the function, -ve sign is used in front of the function to obtain maxima of the function rather minima.
- then the output is received based on the desired input.
- the study cases are as follows:
- Unbounded inputs
- Bounded Inputs
- Bounded inputs with modified population size
ERRORS FACED WHILE CODING:
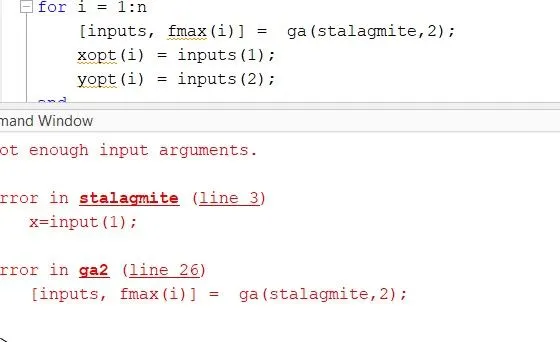
Did not put @to initiate the function.
RESULT:
STUDY 1
STUDY 2:
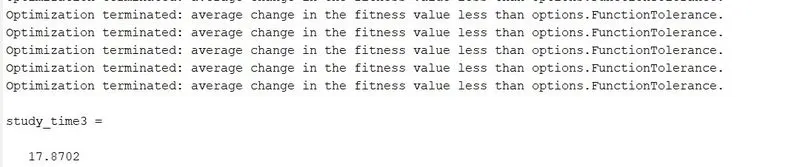
STUDY 3:
REFERENCES:
https://in.mathworks.com/help/gads/what-is-the-genetic-algorithm.html
https://skill-lync.com/premium/coursevideos/76156/en/1217
https://skill-lync.com/premium/coursevideos/76156/en/1427
https://in.mathworks.com/help/gads/ga.html