Week 5 - Genetic Algorithm
AIM:- To study about Genetic Algorithm and to calculate the global maxima of stalagmite function using Genetic Algorithm in MATLAB.
OBJECTIVES:- TO COMPLETE ALL TASK GIVEN ABOVE
PROGRAM:- CODING IN MATLAB
clear all
close all
clc
% independent variacles
x=linspace(0,0.6,150);
y=linspace(0,0.6,150);
% matrix
[xx,yy]=meshgrid(x,y);
%Number of iterations
num_cases=50;
% starting the loop
for i=1:length(xx)
    for j=1:length(yy)
        input_vector(1)=xx(i,j);
        input_vector(2)=yy(i,j);
        f(i,j)=stalagmite(input_vector);
    end
end
% creates a three dimensional surface
figure(1)
surfc(xx,yy,-f)
shading interp  %makes the surface look more smoother
xlabel('x value')
ylabel('y value')
title('Stalagmite Function')
%study 1

tic
for i=1:num_cases
    [inputs,fopt(i)]=ga(@stalagmite,2);
    xopt(i)= inputs(1);
    yopt(i)= inputs(2);
end
study_1=toc
figure(2)
subplot(2,1,1)
hold on
surfc(x,y,-f)
title('Unbounded inputs')
xlabel('x value')
ylabel('y value')

shading interp
hold on

plot3(xopt,yopt,-fopt,'marker','o','markersize',5,'markerfacecolor','r')
subplot(2,1,2)
plot(-fopt)
xlabel('iterations')
ylabel('function maximum')

% case 2nd with upper and lower bounds


tic;
for i=1:num_cases
    [inputs,fopt(i)]=ga(@stalagmite,2,[],[],[],[],[0;0],[0.6;0.6]);
    xopt(i)=inputs(1);
    yopt(i)=inputs(2);
end
study_2_time=toc
figure(3)
subplot(2,1,1)
surfc(x,y,-f)
shading interp
title('Bounded inputs')
xlabel('x value')
ylabel('y value')

hold on

plot3(xopt,yopt,-fopt,'marker','o','markersize',5,'markerfacecolor','r')
subplot(2,1,2)
plot(-fopt)
xlabel('iterations')
ylabel('function maximum')


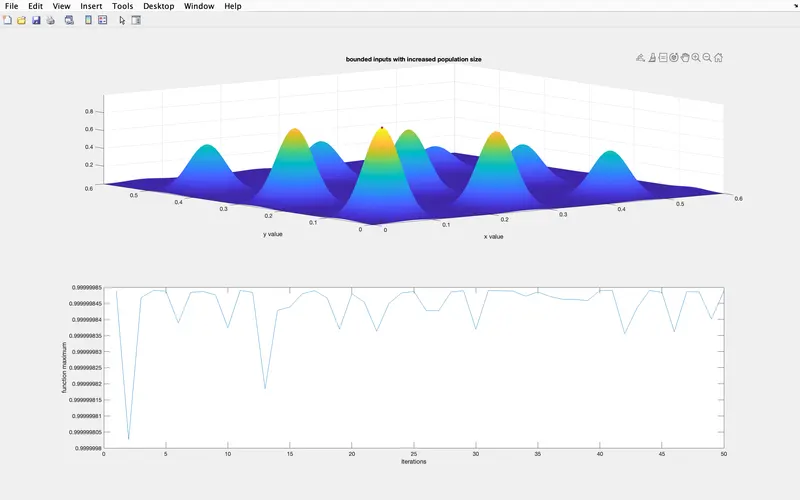
%study 3 incresing the population size
% by doing so we are increasing the probability of the function
% to converge at global maximum
options=optimoptions(@ga)
options=optimoptions(@ga,'PopulationSize',500)  %increasing the population size

tic
for i=1:num_cases
    [inputs,fopt(i)]=ga(@stalagmite,2,[],[],[],[],[0;0],[0.6;0.6],[],[],options);
    xopt(i)=inputs(1);
    yopt(i)=inputs(2);
end
study_3_time=toc  %gives the time taken for study
figure(4)
subplot(2,1,1)
surfc(x,y,-f)  %creates a surface to visualise 3D
shading interp
title('bounded inputs with increased population size')
xlabel('x value')
ylabel('y value')

hold on

plot3(xopt,yopt,-fopt,'marker','o','markersize',4,'markerfacecolor','r')
subplot(2,1,2)
plot(-fopt)  %plotting -f vs number of iterations
xlabel('iterations')
ylabel('function maximum')
FUNCTION
function [f] = stalagmite(input_vector)

a=input_vector(1);
b=input_vector(2);

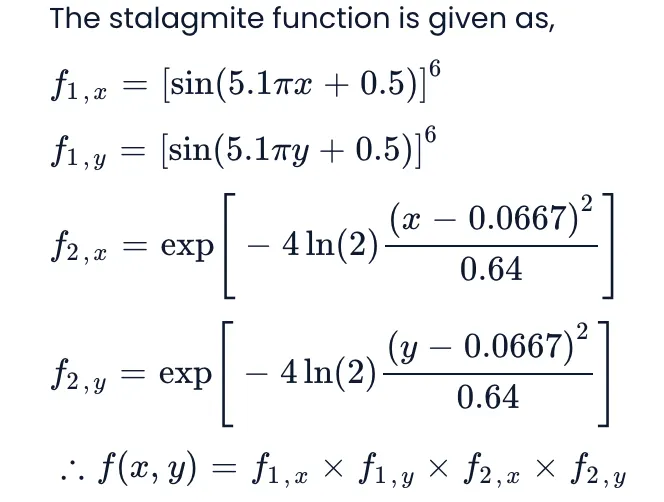
term1=(sin((5.1*pi*a)+0.5))^6;
term2=exp(-4*log(2)*((a-0.0667)^2)/0.64);
term3=(sin((5.1*pi*b)+0.5))^6;
term4=exp((-4)*log(2)*((b-0.0667)^2)/0.64);

[f]=-(term1*term2*term3*term4);   %inverts the objective function
end
RESULTS :
FIGURE 1
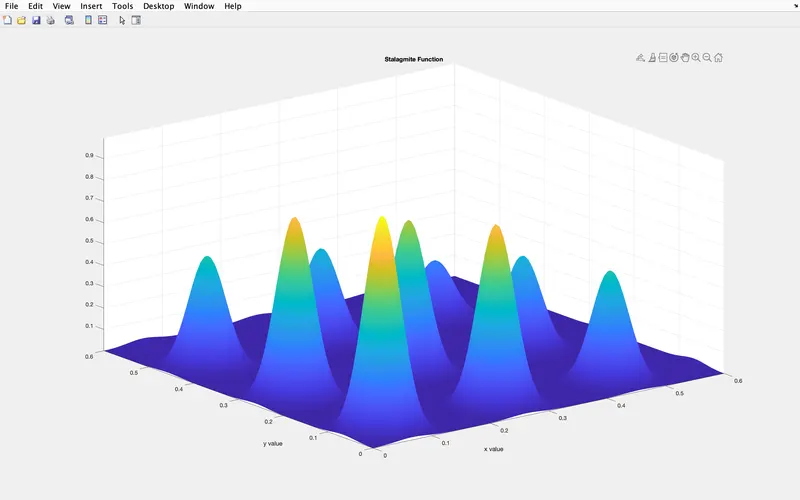
FIGURE 2
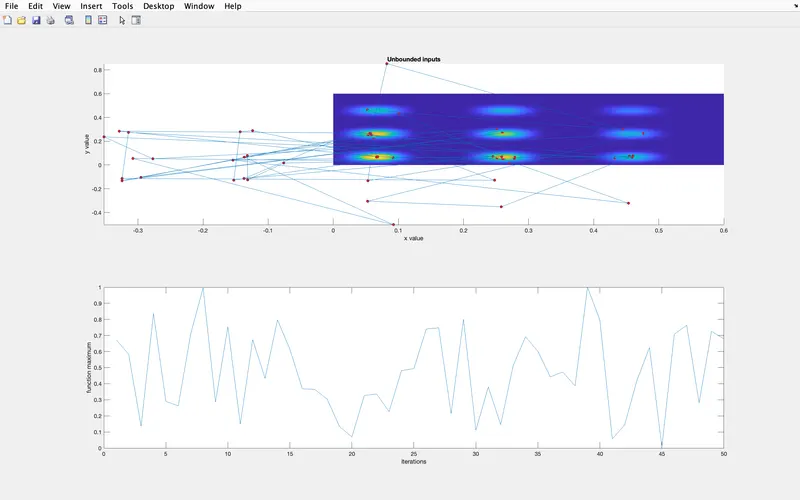
FIGURE 3
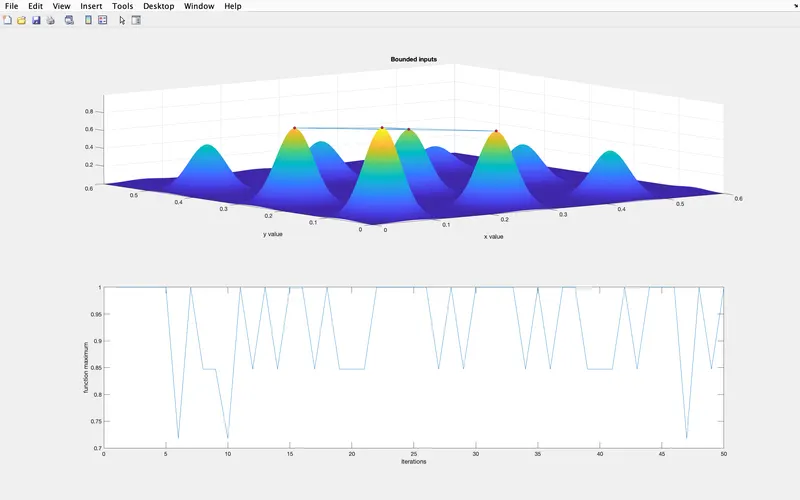
FIGURE 4
COMMANDS USED
- CLOSES ALL :- closes all figures whose handles are visible.
- CLEAR ALL: - clear removes all variables from the current workspace, releasing them from system memory
- CLC :- clc clears all the text from the Command Window, resulting in a clear screen.
- * is matrix multiplication,
- .* is array multiplication (i.e. element-wise)
-
: ) colon operator to create regularly spaced vectors, index into arrays, and define the bounds of a for loop.]
-
( ; ) Suppress output display
- ( % ) Description Comment
- Plot :- Create a simple line plot and label the axes. Customize the appearance of plotted lines by changing the line color, the line style, and adding markers.
- Axis Labels : - Add axis labels to the chart by using the xlabel and ylabel functions.
- Add Title :-Add a title to the chart by using the title function. To display the Greek symbol π, use the TeX markup, \pi.
- FUNCTIONS:-Programs that accept inputs and return outputs. Both scripts and functions allow you to reuse sequences of commands by storing them in program files. Functions provide more flexibility, primarily because you can pass input values and return output values.
Concept of Genetic Algorithm –
The Genetic Algorithm works on the process of natural selection where the fittest individuals are selected for reproduction in order to produce offspring of the next generation. It is a method for solving both constrained and unconstrained optimization problems that is based on natural selection. The algorithm begins by creating a random initial population of individual selections and it keeps on modifying this population repeatedly creating a sequence of new population. The algorithm uses the individuals in the current generation to create the next population. The genetic algorithm selects individuals at random from the current population to be parents and uses them to produce the children for the next generation. Over successive generations, the population evolves toward an optimal solution.
What is a Stalagmite Function?
Stalagmite function is a mathematical model which helps to generate local minima and maxima. It is a three dimensional function and the way the function is designed is that it has a lot of local maxima or minima and one global maxima or minima. The name stalagmite is actually a type of rock formation that arises from the floor of a cave due to the accumulation of material deposited on the floor from ceiling drippings.
Syntax for defining ‘ga’ (Genetic Algorithm) in matlab –
The ‘ga’ syntax in matlab is used to find the minimum of function using genetic algorithm. There are several ways to define the ‘ga’ function depending on the problem being solved. The syntax used for this study is shown below.
- x = ga(fun,nvars)
where,
x = optimal solution/variables;
fun = Objective function;
nvars = Number of variables;
Sometimes ‘[x,fval]’ is used instead of ‘x’ where ‘fval’ gives objective function value at the solution
- x = ga(fun,nvars,A,B,Aeq,Beq,lb,ub)
where,
A, B = Linear inequality constraints
Aeq, Beq = Linear equality constraints
If there are no linear equalities and inequalities, then A, B, Aeq, Beq are set to ‘[ ]’.
- x = ga(fun,nvars,A,B,Aeq,Beq,lb,ub,nonlcon,IntCon,options)
where,
nonlcon = Nonlinear constraints
IntCon = Integer Values
options = Optimization options
If there are no nonlinear constraints and integer values, the nonlcon and IntCon are set to ‘[ ]’.
CONCLUSION:-
THEREFORE WE HAVE CREATED A MATLAB PROGRAM THAT HELPS TO COMPLETE ALL TASK GIVEN ABOVE