Project 1 - Parsing NASA thermodynamic data
AIM:- Write a code in Matlab to parse the NASA thermodynamic data file and then calculate thermodynamic properties of various gas species.
- Write a function that extracts the 14 co-efficients and calculates the enthalpy, entropy and specific heats for all the species in the data file.
-
Calculate the molecular weight of each species and display it in the command window.
-
Plot the Cp, Enthalpy and Entropy for the local temperature range (low temperature : high temperature) specific for each species.
-
Save the plots as images with appropriate names and dump them in separate folders for each species with suitable name. All these should be generated automatically.
-
The main program that you will submit will just take the "THERMO.dat" file as an input and generate Cp, H and S plots.
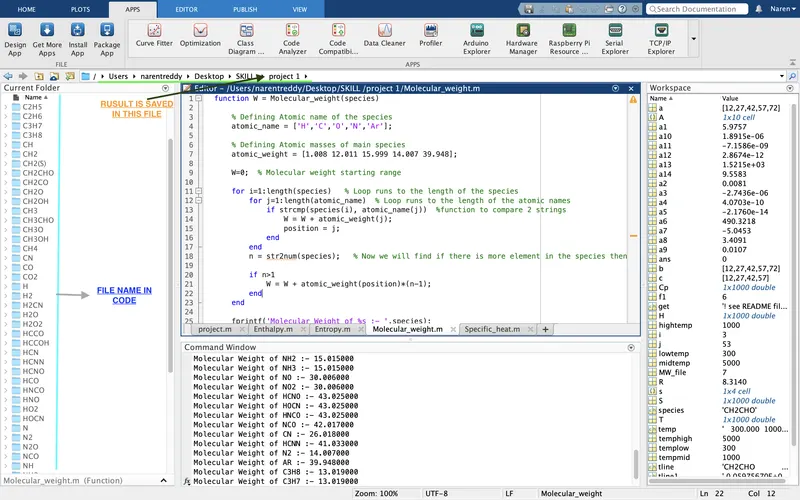
- Screenshot of the window where all the folders are saved.
- Plots for o2, N2 and Co2 species.
OBJECTIVES:- TO COMPLETE ALL TASK GIVEN ABOVE
PROGRAM:- CODING IN MATLAB
clear all
close all
clc


%Input
R=8.314; % Gas Constant

% Reading data file
% open file and reading THERMO.dat file
f1 = fopen('THERMO.dat','r')
get = fgetl(f1);

% Now Reading Temperature from this file
temp = fgetl(f1);

%spliting
s = strsplit(temp);

% converting strings cells into numbers
templow = str2num(s{2});
tempmid = str2num(s{3});
temphigh = str2num(s{4});

% Temperature Range
T = linspace(templow,temphigh,1000);

%Skipping comment lines
for i=1:3
    get=fgetl(f1);
end

% Reading the Species
for j=1:53
    tline=fgetl(f1);

   A=strsplit(tline,' ');  % spliting into cell array
    species =  (A{1});         % To read the name of the species

     % Converting string to number
    lowtemp = str2num(A{end-3});
    midtemp = str2num(A{end-2});
    hightemp = str2num(A{end-1});


    tline1 = fgetl(f1);   % getting next line
    a = strfind(tline1,'E');  % Finding the string E

    % Finding First 7 higher and second 7 lower coefficients
    %Finding Higher coefficients
    a1 = tline1(1:a(1)+3);
    a1 = str2num(a1);
    a2 = tline1(a(1)+4:a(2)+3);
    a2 = str2num(a2);
    a3 = tline1(a(2)+4:a(3)+3);
    a3 = str2num(a3);
    a4 = tline1(a(3)+4:a(4)+3);
    a4 = str2num(a4);
    a5 = tline1(a(4)+4:a(5)+3);
    a5 = str2num(a5);

    tline2 = fgetl(f1);
    b = strfind(tline2,'E');
    a6 = tline2(1:b(1)+3);
    a6 = str2num(a6);
    a7 = tline2(b(1)+4:b(2)+3);
    a7 = str2num(a7);

    % Finding Lower coefficients
    a8 = tline2(b(2)+4:b(3)+3);
    a8 = str2num(a8);
    a9 = tline2(b(3)+4:b(4)+3);
    a9 = str2num(a9);
    a10 = tline2(b(4)+4:b(5)+3);
    a10 = str2num(a10);

    tline3 = fgetl(f1);
    c = strfind(tline3,'E');
    a11 = tline3(1:c(1)+3);
    a11 = str2num(a11);
    a12 = tline3(c(1)+4:c(2)+3);
    a12 = str2num(a12);
    a13 = tline3(c(2)+4:c(3)+3);
    a13 = str2num(a13);
    a14 = tline3(c(3)+4:c(4)+3);
    a14 = str2num(a14);
     % calculate specific heat

    Cp = Specific_heat(a1,a2,a3,a4,a5,a8,a9,a10,a11,a12,T,R,tempmid);

    % calculate Entropy

    S = Entropy(a1,a2,a3,a4,a5,a7,a8,a9,a10,a11,a12,a14,T,R,tempmid);

    % calculate Enthalpy

    H = Enthalpy(a1,a2,a3,a4,a5,a6,a8,a9,a10,a11,a12,a13,T,R,tempmid);

    % Calculate Molecular weight of the Species

    W = Molecular_weight(species);

    % writing molecular weight file
    MW_file = fopen('Molecular Weight.txt','w');
    fprintf(MW_file,'Molecular weight of %s is %d ',species,W);
    fclose(MW_file);   % Closing the file

    %Plotting Cp, H and S with Temperature
    % Saving in a folder
    cd ('/Users/narentreddy/Desktop/SKILL /project 1')  % changing directory
    mkdir(species);  %creating directory
    cd(species);


    % Plot 1 Cp vs T
    figure(1)
    plot(T,Cp,'linewidth',2,'color','b');
    xlabel('Temperature(K)');
    ylabel('Specific Heat(KJ)');
    title(sprintf('Specific heat vs Temperature range of %s',species));
    grid on
    saveas(figure(1),'Specific Heat.jpg');

    % Plot 2 S vs T
    figure(2)
    plot(T,S,'linewidth',2,'color','r');
    xlabel('Temperature');
    ylabel('Entropy(KJ/mol-K)');
    title(sprintf('Entropy vs Temperature range of %s',species));
    grid on
    saveas(figure(2),'Entropy.jpg');

    % Plot 3 Cp vs T
    figure(3)
    plot(T,H,'linewidth',2,'color','g');
    xlabel('Temperature');
    ylabel('Enthalpy(KJ/mol)');
    title(sprintf('Enthalpy vs Temperature range of %s',species));
    grid on
    saveas(figure(3),'Enthalpy.jpg');

end
FUNCTION IN MATLAB
ENTHALPY
function H = Enthalpy(a1,a2,a3,a4,a5,a6,a8,a9,a10,a11,a12,a13,T,R,tempmid)

    % calculating enthalpy
    % calculating enthalpy for higher and lower temperature repectively.

    if (T <= tempmid)
        H = R*T.*(a8 + ((a9*T)/2) + ((a10*(T).^2)/3) + ((a11*(T).^3)/4) + ((a12*(T).^4)/5) + (a13./T));
    else
        H = R*T.*(a1 + ((a2*T)/2) + ((a3*(T).^2)/3) + ((a4*(T).^3)/4) + ((a5*(T).^4)/5) + (a6./T));
    end
end
ENTROPY
function S = Entropy(a1,a2,a3,a4,a5,a7,a8,a9,a10,a11,a12,a14,T,R,tempmid)

    % calculating entropy
    % calculating entropy for higher and lower temperature repectively.

    if (T <= tempmid)
        S = R*(a8.*log(T) + (a9*T) + ((a10*(T).^2)/2) + ((a11*(T).^3)/3) + ((a12*(T).^4)/4) + a14);
    else
        S = R*(a1.*log(T) + (a2*T) + ((a3*(T).^2)/2) + ((a4*(T).^3)/3) + ((a5*(T).^4)/4) + a7);

    end
SPECIFIC HEAT
function Cp = Specific_heat(a1,a2,a3,a4,a5,a8,a9,a10,a11,a12,T,R,tempmid)

    % calculating specific heat
    % calculating specific heat for higher and lower temperature repectively.

    if (T <= tempmid)
        Cp = R*(a8 + (a9*T) + (a10*(T).^2) + (a11*(T).^3) + (a12*(T).^4));
    else
        Cp = R*(a1 + (a2*T) + (a3*(T).^2) + (a4*(T).^3) + (a5*(T).^4));
    end
end
MOLECULAR WEIGHT
function W = Molecular_weight(species)

    % Defining Atomic name of the species
    atomic_name = ['H','C','O','N','Ar'];

    % Defining Atomic masses of main species
    atomic_weight = [1.008 12.011 15.999 14.007 39.948];

    W=0;  % Molecular weight starting range

    for i=1:length(species)   % Loop runs to the length of the species
        for j=1:length(atomic_name)  % Loop runs to the length of the atomic names
            if strcmp(species(i), atomic_name(j))  %function to compare 2 strings
                W = W + atomic_weight(j);
                position = j;
            end
        end
        n = str2num(species);   % Now we will find if there is more element in the species then incrementing atomic weight of the species

        if n>1
            W = W + atomic_weight(position)*(n-1);
        end
    end

    fprintf('Molecular Weight of %s :- ',species);
    fprintf('%f',W);
    disp(' ')
end
RESULTS :
COMMANDS USED
- CLOSES ALL :- closes all figures whose handles are visible.
- CLEAR ALL: - clear removes all variables from the current workspace, releasing them from system memory
- CLC :- clc clears all the text from the Command Window, resulting in a clear screen.
- * is matrix multiplication,
- .* is array multiplication (i.e. element-wise)
-
: ) colon operator to create regularly spaced vectors, index into arrays, and define the bounds of a for loop.]
-
( ; ) Suppress output display
- ( % ) Description Comment
- Plot :- Create a simple line plot and label the axes. Customize the appearance of plotted lines by changing the line color, the line style, and adding markers.
- Axis Labels : - Add axis labels to the chart by using the xlabel and ylabel functions.
- Add Title :-Add a title to the chart by using the title function. To display the Greek symbol π, use the TeX markup, \pi.
- FUNCTIONS:-Programs that accept inputs and return outputs. Both scripts and functions allow you to reuse sequences of commands by storing them in program files. Functions provide more flexibility, primarily because you can pass input values and return output values.
- saveas command to save the plots of different species in the directory folder. Now we will change the directory to which our main code file runs in the MATLAB.
- mkdir command and then we will change the directory to this created folder.
- fprintf all the molecular weights of the species. and then close the txt file using fclose command.
- strfind command to find before and after numbers of the coefficients then we will find remaining 14 coefficients and convert them to numbers from strings.
Specific Heat:-
The specific heat is the amount of heat per unit mass required to raise the temperature by one degree Celsius. The relationship between heat and temperature change is usually expressed in the form shown below where c is the specific heat.

Entropy:-

Enthalpy:-

CONCLUSION:-
THEREFORE WE HAVE CREATED A MATLAB PROGRAM THAT HELPS TO COMPLETE ALL TASK GIVEN ABOVE