Week 5 - Curve fitting
PROCEDURE
1. Importing the numpy, matplotlib, and scipy to plotresult and output the data value
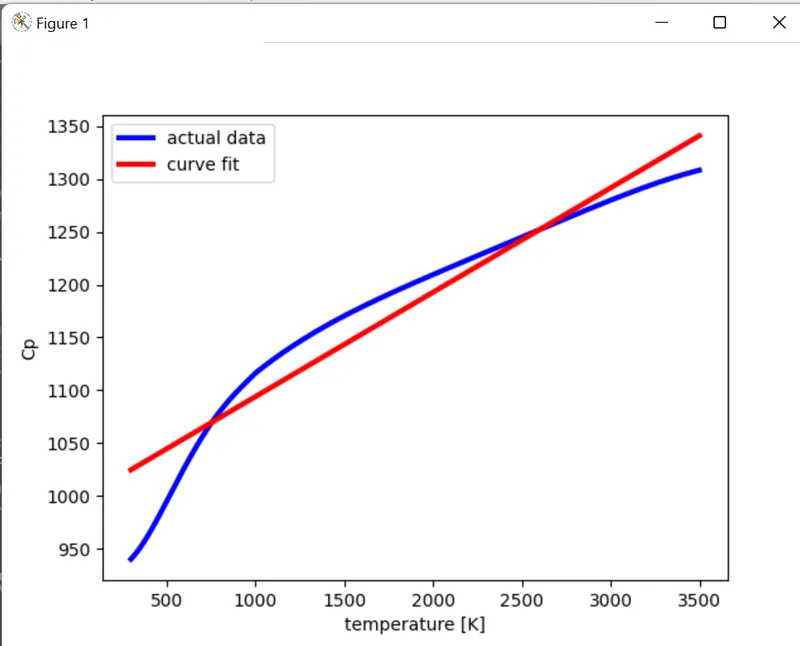
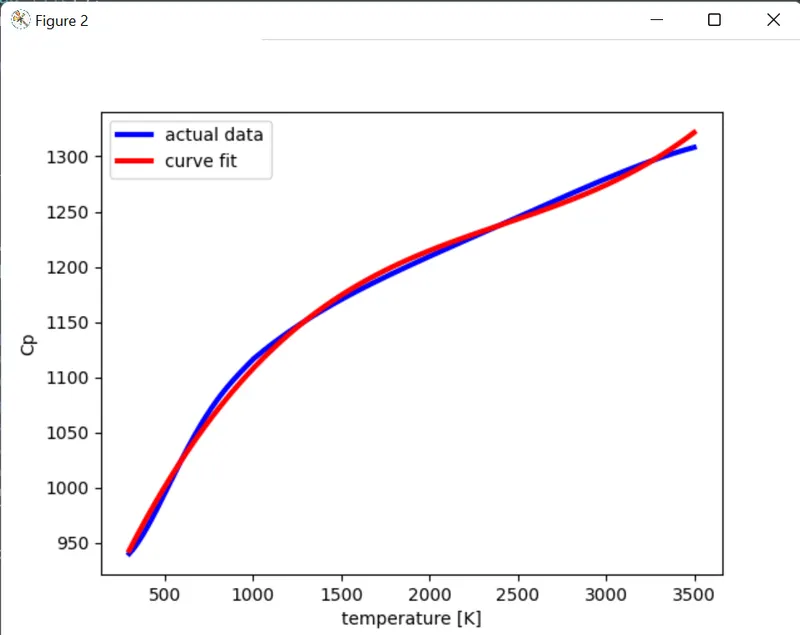
2. For curve fitting, output these two functions are defined as linear and cubical
3. To define the linear curve function following code is written: # Curve_fitfunction for linear polynomialdef func(t, a, b):
return a*t + b
4. And for the cubic polynomial curve: # Curve fit function for cubical polynomial
def func_I(t a, b, c, d):
return a*pow (t3) + b*pow(t,2) + c*t +d
5. After defining the function the data value of temperature to read as provided defining the read file with temperature and cp in the null array, for line in open('data', 'r'):
values =line.split('')
temperature.append(float(values[0])) cp.append (float (values[1])) and then returning the value of (temperature, cp).
6. Plotting the graph for temperature cp_1 and cp for the linear curve and the same follows for the cubic curve.
CODING:
import math
import matplotlib.pyplot as plt
import numpy as np
from scipy.optimize import curve_fit

# linear fit function (linear polynomial)
def func(t,a,b,c,d,e):
	return a*t + b

# reading  thermodynamic data file
def read_file():
	temperature = []
	cp = []
	for line in open ('data','r'):
		values = line.split(',')
		temperature.append(float(values[0]))
		cp.append(float(values[1]))

	return [temperature, cp]


# main program
temperature , cp = read_file()
popt , pcov = curve_fit(func , temperature ,cp)
fit_cp = func(np.array(temperature), *popt)

plt.figure(1)
plt.plot(temperature,cp,color="blue",linewidth=3)
plt.plot(temperature,fit_cp,color="red",linewidth=3)
plt.legend(['actual data','curve fit'])
plt.xlabel('temperature [K]')
plt.ylabel('Cp')
plt.show()


# cubic fit function (cubic polynomial)
def func(t,a,b,c,d):
	return a*pow(t,3) + b*pow(t,2) + c*t + d

# reading thermodynamic data file
def read_file():
	temperature = []
	cp = []
	for line in open ('data','r'):
		values = line.split(',')
		temperature.append(float(values[0]))
		cp.append(float(values[1]))

	return [temperature, cp]

# main program
temperature , cp = read_file()
popt, pcov = curve_fit(func , temperature ,cp)
fit_cp = func(np.array(temperature), *popt)

plt.figure(2)
plt.plot(temperature,cp,color="blue",linewidth=3)
plt.plot(temperature,fit_cp,color="red",linewidth=3)
plt.legend(['actual data','curve fit'])
plt.xlabel('temperature [K]')
plt.ylabel('Cp')
plt.show()
THE OUTPUT GRAPH :