Week 5 - Curve fitting
AIM :
TO PERFORM A CURVE FIT PROGRAM FOR A GIVEN DATA , AND COMPARE WITH THE CURVE GENERATED FROM THE EXPERIMENTAL VALUE CURVE .
PROGRAM :
import math #we are now importing the math module to perform the mathematical operations
import matplotlib.pyplot as plt #we are now importing the matplotlib module to perform plotting operations
import numpy as np #we are now importing numpy module to access the data in the form of array
from scipy.optimize import curve_fit #from scipy module we are importing the required curve fit to perform the curvefit operation

#we are now defining a user defined function under the name of func to perform the curve fit operation with the equation to be used
def func(t,a,b,c,d):
	return a*pow(t,3)+ b*pow(t,2) + c*t + d
#when ever we call the variable func in this program , the software will automatically goes to func and returns the equation we have provided


#we are now provided with the actual data and we need to access the data by using the read_file so that the data stored in the name will be accessed only fpr reading mode

def read_file():
	temperature = []   #this data set contains two set of values , one of the data is to store the data in the separate list to accesss
	cp          = []   #then storing the another set of data to access in the operation
	for line in open('data','r'):   #now the given set of data has been extracted line by line and then appending it in the empty list to access
		values = line.split(',')   #the given set of data has been separated by a marker ,
		temperature.append(float(values[0]))   #the values of the data has been stored in the variable , where the first set of values are temperature
		cp.append(float(values[1]))       #the second set of values are the values of the cp
	return[temperature,cp]  #once after finishing the  reading operation and then it returns to the temperature and the cp

temperature,cp  = read_file()  #now the values of the temperature and cp has been separated and stored as a form o flist in the variables temperature and cp
popt,pcov = curve_fit(func,temperature,cp) #this is the curve_fit operation , which represents the set of given constants values
fit_cp = func(np.array(temperature),*popt) #this line represents the experimental value of cp (curve_fit) to be done


plt.plot(temperature,cp, lw= 3)  #we are now plotting the actual data given to us
plt.plot(temperature,fit_cp, lw=4,color='r') #we are now plotting the actual temperature and the cp of the experimental value
plt.legend(["actual data ","curve fit data "]) #representing the legends in the graphical representation
plt.xlabel("TEMPERATURE") #assigining a label to the x value
plt.ylabel("cp {actual and experimental}") #assigning a label to the y value
plt.show() #once after completing the plots , we need to display it to the output screen


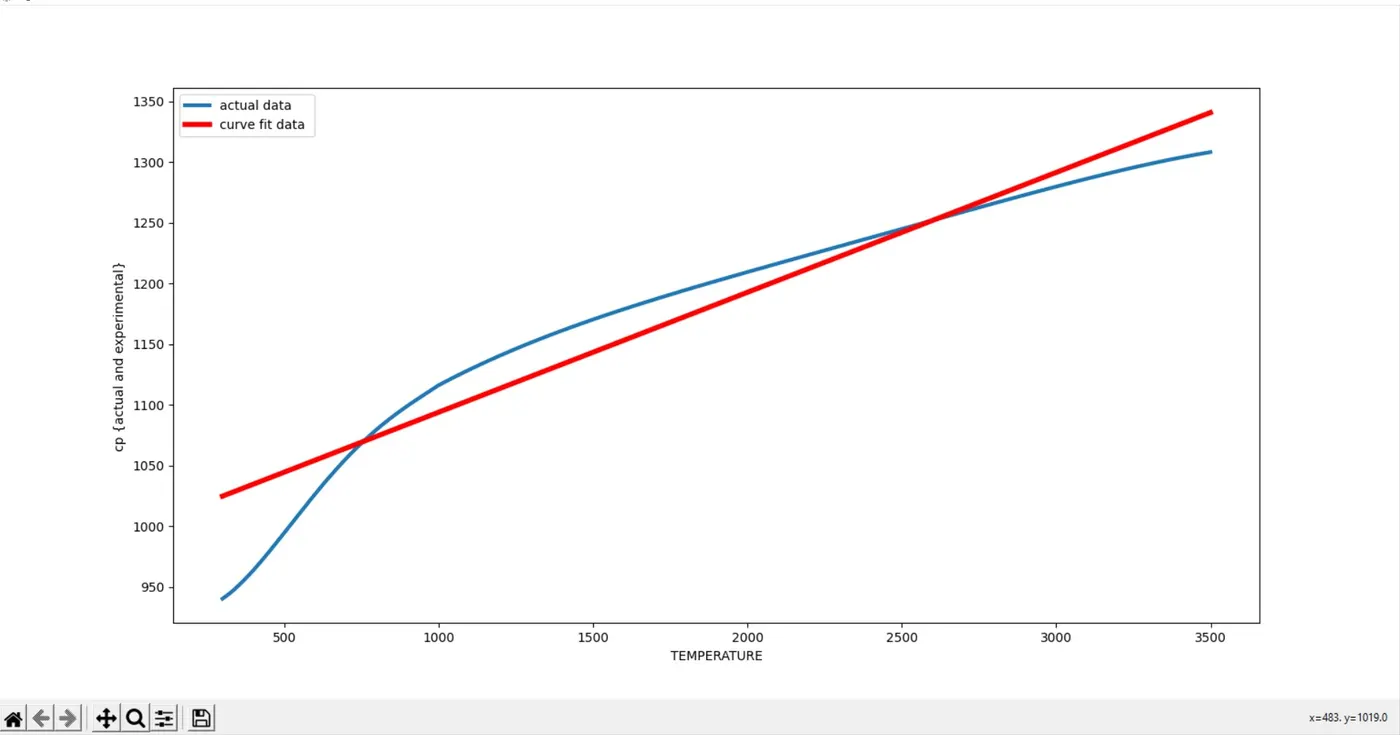
#FOR LINEAR EQUATION

import math #we are now importing the math module to perform the mathematical operations
import matplotlib.pyplot as plt #we are now importing the matplotlib module to perform plotting operations
import numpy as np #we are now importing numpy module to access the data in the form of array
from scipy.optimize import curve_fit #from scipy module we are importing the required curve fit to perform the curvefit operation

#we are now defining a user defined function under the name of func to perform the curve fit operation with the equation to be used
def func(t,a,b):
	return a*t + b
#when ever we call the variable func in this program , the software will automatically goes to func and returns the equation we have provided


#we are now provided with the actual data and we need to access the data by using the read_file so that the data stored in the name will be accessed only fpr reading mode

def read_file():
	temperature = []   #this data set contains two set of values , one of the data is to store the data in the separate list to accesss
	cp          = []   #then storing the another set of data to access in the operation
	for line in open('data','r'):   #now the given set of data has been extracted line by line and then appending it in the empty list to access
		values = line.split(',')   #the given set of data has been separated by a marker ,
		temperature.append(float(values[0]))   #the values of the data has been stored in the variable , where the first set of values are temperature
		cp.append(float(values[1]))       #the second set of values are the values of the cp
	return[temperature,cp]  #once after finishing the  reading operation and then it returns to the temperature and the cp

temperature,cp  = read_file()  #now the values of the temperature and cp has been separated and stored as a form o flist in the variables temperature and cp
popt,pcov = curve_fit(func,temperature,cp) #this is the curve_fit operation , which represents the set of given constants values
fit_cp = func(np.array(temperature),*popt) #this line represents the experimental value of cp (curve_fit) to be done


plt.plot(temperature,cp, lw= 3)  #we are now plotting the actual data given to us
plt.plot(temperature,fit_cp, lw=4,color='r') #we are now plotting the actual temperature and the cp of the experimental value
plt.legend(["actual data ","curve fit data "]) #representing the legends in the graphical representation
plt.xlabel("TEMPERATURE") #assigining a label to the x value
plt.ylabel("cp {actual and experimental}") #assigning a label to the y value
plt.show() #once after completing the plots , we need to display it to the output screen
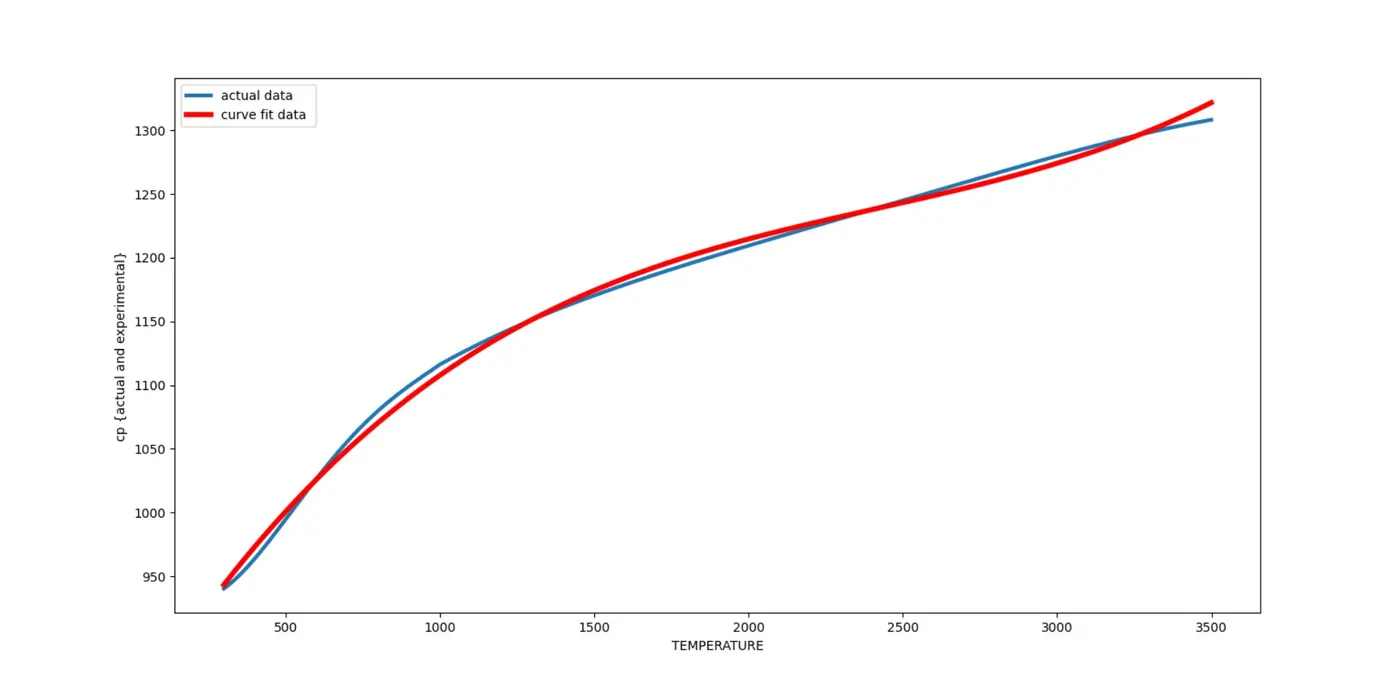
FOR CUBIC EQUATION :
FOR LINEAR EQUATION :
1, what does popt and pcov means ?
Popt - it is a 1D array with optimal parameters generated by the equation given .
Pcov – it is a 2D array with estimated parameters from the popt generated .
2, what does np.array(temperature) means ?
The temperature values are stored in the experimental data given , at first we are extracting the given data from the data and then we are separating the data values as temperature and cp , now we are storing the values of temperature as an array by means of using numpy. Now np.array() will generate a array , now we are going to store the values of some data , here we are using temperature values as array , so np.array(temperature) will store the values of temperature as an array , and this array is used to pass the values in the program .
3, what does *popt means?
The star popt means , referring the values of popt ,in the program .
4, what needs to be done in order to make the curve perfect ?
To make the curve fit with the experimental value , we need to increase the order of polynomial equation , however , this doesn’t surely fits with the experimental value. We can approximately fit the curve with the experimental value by higher order polynomial equation .
conclusion :
thus the curve fit has been performed , and cubic polynomial equation fits with the experimental value given