CURVE FITTING, USING PYTHON PROGRAMMING LANGUAGE
AIM:
- Write code to fit a linear and cubic polynomial for the Specific Heat (Cp) data provided for different temperature.
OBJECTIVE:
- The main objective is to fit a linear and Cubic polynomial for the Specific Heat (Cp) data provided for different temperature. And to explain the results weather it is good or bad.
- What need to be done to make the curve perfect? And also to empirically show how well the curve has been fit
- Also to explain some of the following questions a part of this project which are used in the python program.
- What does popt and pcov mean?
- What does np.array(temperature) do?
- What does the * in *popt mean?
- Write code to fit a linear and cubic polynomial for the Cp data. Explain if your results are good or bad.
- What needs to be done in order to make the curve fit perfect?
- Show empirically as to how well your curve has been fit.
DETAILED CONTENT:
- Curve_fit function imported from the scipy module is used to determine the true nature of the given curve.(Refer python code)
- The read_file () function is defined to read the data from the file which contains the specific heat values for the given temperatures which are separated by comma. So, inside that function the split command is used to split both the values and store them in the two different array. (Refer python code)
- In the main program the read function was called and then the values are stored in the temperature and cp.
- Popt, pocv = cuve_fit(linear_polynomial, temperature,cp). This code is given to fetch the co-efficient required for the linear polynomial expression, the curve fit function calculates the value for the co-efficient and stores them in the ‘popt’ and their covariance values are stored in the ‘pcov’. (Refer python code)
- fit_cp1 = linear_polynomial(np.array(temperature),*popt). This code is given to call the linear_polynomial function by passing the value of temperature list as the numpy array with *popt which has the values of co-efficient for the other parameters in the function. (Refer python code)
- The same steps are repeated for the Cubic_polynomial function also. Popt, pocv = cuve_fit(Cubic_polynomial, temperature,cp), This code is given to fetch the co-efficient required for the Cubic polynomial expression, the curve fit function calculates the value for the co-efficient and stores them in the ‘popt’ and their covariance values are stored in the ‘pcov’. (Refer python code)
- fit_cp2 = Cubic_polynomial(np.array(temperature),*popt). This code is given to call the Cubic_polynomial function by passing the value of temperature list as the numpy array with *popt which has the values of co-efficient for the other parameters in the function. (Refer python code)
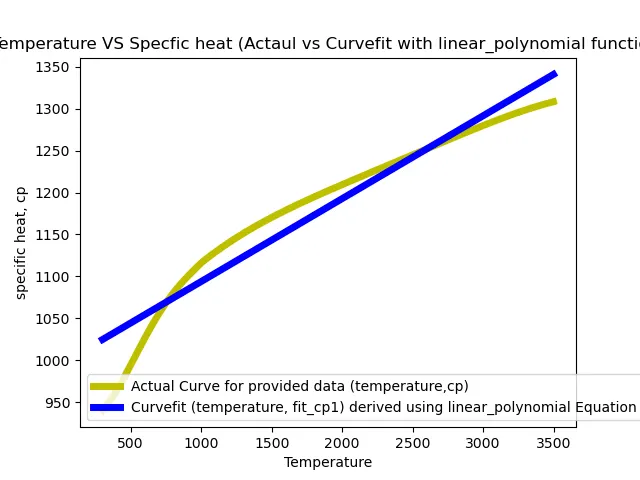
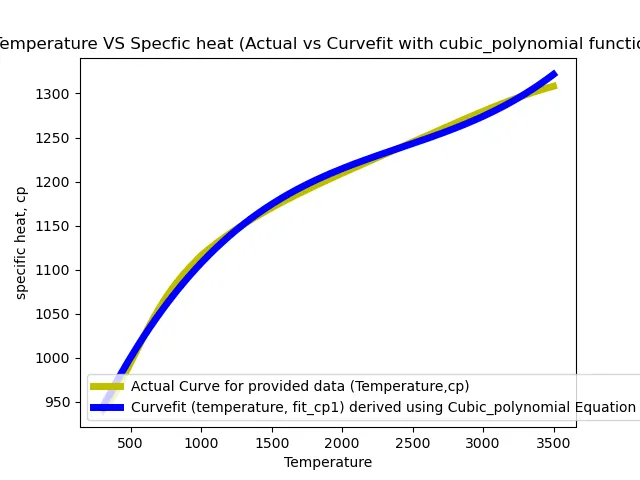
- Then the values stored in the fit_cp1 (cp values for linear polynomial function)and fit_cp2 (cp values for cubic polynomial function)were plotted along with the temperature values. (Refer python code)
- For more clarity the plot is made in such a way along with the plot actual value of temperature and cp, So that it is easy to compare how the curve fit function is performed.
EXPLAINATION FOR THE QUESTIONS ASKED, AS A PART OF THIS PROJECT:
- What does popt and pcov mean?
- popt - The curvefit imported from the scipy module calculate the values of the co-efficient in an equation which is declared inside the function. The values of the co-efficient will be assigned to popt. This can be further used in place of defining parameters while calling the function, which has those coefficients as its parameter.
- pcov – pcov is an array, the diagonals provide the co-variance of the estimated coefficient.
- What does np.array(temperature) do?
- To convert list to array, we pass this syntax using numpy. As array is a data structure that can hold homogenous elements and it requires less memory than list.
- Here the temperature list is converted to temperature array using np.array(temperature) syntax
- What does the * in *popt mean?
- It is the reference operator used to refer the coefficient present in the popt.
- Write code to fit a linear and cubic polynomial for the Cp data. Explain if your results are good or bad.
- Refer below for the Python code with explination
- What needs to be done in order to make the curve fit perfect?
- Refer Conclusion
6.Show empirically as to how well your curve has been fit?
- Refer Conclusion
PYTHON CODE WITH EXPLAINATION:
#Program to perform curvefit
#Import the Module / Library used in this program
import math
import matplotlib.pyplot as plt
import numpy as np
from scipy.optimize import curve_fit
#Defining the Linear polynomial equation in a function
def linear_polynomial (t,a,b):
	return a*t +b
#Defining the cubic polynomial equation in a function
def cubic_polynomial (t,a,b,c,d):
	return a * pow (t,3) + b * pow (t,2)+ c*t+d

#defining readfile function , for reading the content in the data file.
def read_file():
	temperature=[] # Empty array for temperature
	cp =[] #Empty array for specific heat
	for line in open ('data','r'):
		values = line.split (',')
		temperature.append(float (values[0]))
		cp.append(float(values[1]))

	return [temperature,cp]

#main program
temperature,cp=read_file() #Calling the dunction, So that the data will be assigned to the both variables
#First calling the Linear polynomial function and plotting its curve
popt,pcov = curve_fit(linear_polynomial,temperature,cp) #Cure fit using linear polynomial equation
fit_cp1 = linear_polynomial(np.array(temperature),*popt) #calling linear polynomial function

#Plotting the figure Temperature VS Specfic heat (To compare with the linear polynomial function )
plt.figure (1)
plt.plot (temperature,cp, color='y', linewidth=5, label ='Actual Curve for provided data (temperature,cp)')
plt.plot (temperature,fit_cp1, color='b',linewidth =5, label= 'Curvefit (temperature, fit_cp1) derived using linear_polynomial Equation')
plt.xlabel ('Temperature')
plt.ylabel('specific heat, cp')
plt.title('Temperature VS Specfic heat (Actaul vs Curvefit with linear_polynomial function)')
plt.legend(loc='best')
plt.savefig('Plot-1')

#Next calling the cubic polynomial function and plotting its curve
popt,pcov = curve_fit(cubic_polynomial,temperature,cp) #Cure fit using Cubic polynomial equation
fit_cp2 = cubic_polynomial(np.array(temperature),*popt)  #calling Cubic polynomial function

#Plotting the figure Temperature VS Specfic heat (To compare with the Cubic polynomial function )
plt.figure (2)
plt.plot (temperature,cp, color='y', linewidth=5, label ='Actual Curve for provided data (Temperature,cp)')
plt.plot (temperature,fit_cp2, color='b',linewidth =5, label= 'Curvefit (temperature, fit_cp1) derived using Cubic_polynomial Equation')
plt.xlabel ('Temperature')
plt.ylabel('specific heat, cp')
plt.legend (loc='best')
plt.title('Temperature VS Specfic heat (Actual vs Curvefit with cubic_polynomial function)')
plt.savefig('Plot-2')
OUPUT AND RESULTS:
PLOT-1:
PLOT-2:
CONCLUSION:
- Based on the comparison with plot-1 and plot-2, Cubic_polynomial curve is better than the liner_polynomial curve.
- To achieve the proper curve_fit , the right order or the degree of the curve to be selected. By doing so we can achieve much better curve than the cubic_polynomial curve.
- As empirically we can conclude that the order or the degree of equation increases, we get less number of errors, so that best curve fit can be obtained.