Week 5 - Curve fitting
Aim:
To write a pyhton program to fit a linear and cubic polynomial for the cp data and to answer following question.
Formula:
Goodness of the fit:
E – Error, SSE – Sum of squares due to errors, SSR- Sum of squares of regression,
SST – Total sum of squares, R2- R square, RMSE – Root mean square error, n – number of data.
`SSE=sum(E^2)`
`SSR=sum((P_(cp)-mean(cp))^2`
`SST=SSE+SSR`
`R2=(SSR)/(SST)`
`RMSE=sqrt((SSE)/n)`
Coding:
import math
import matplotlib.pyplot as plt
import numpy as np
from scipy.optimize import curve_fit

#linear equation

def linear(t,a,b):
	return (t*a)+b
# cubic equation

def cubic(t,a,b,c,d):
	return (a*pow(t,3)+(b*pow(t,2))+(c*t)+d)

#reading given data file
def read_file():
	temperature=[]
	cp=[]
	for i in open('data','r'):
		line=i.split(',')
		temperature.append(float(line[0]))
		cp.append(float(line[1]))

	return [temperature,cp]

#Linear equation curve fit

temperature,cp= read_file()
popt,pcov=curve_fit(linear,temperature,cp)
fit_cp=linear(np.array(temperature), *popt)

#plotting curve fit of linear equation
plt.figure(1)
plt.plot(temperature,cp,color="blue",linewidth=3)
plt.plot(temperature,fit_cp,color="red",linewidth=3)
plt.legend(['Actual data','Curve fit'])
plt.xlabel('Temperature[k]')
plt.ylabel('Cp')
plt.show()

#Cubic equation curve fit

temperature,cp= read_file()
popt,pcov=curve_fit(cubic,temperature,cp)
fit_cp_1=cubic(np.array(temperature), *popt)

#plotting curve fit of Cubic equation
plt.figure(2)
plt.plot(temperature,cp,color="blue",linewidth=3)
plt.plot(temperature,fit_cp_1,color="red",linewidth=3)
plt.legend(['Actual data','Curve fit'])
plt.xlabel('Temperature[k]')
plt.ylabel('Cp')
plt.show()

#Error
s=np.sum(cp)
l=np.size(cp)
m=s/l
print('Mean of all cp:',m)
"""
SSE – Sum of squares due to errors, SSR- Sum of squares of regression,
SST – Total sum of squares, R2- R square, RMSE – Root mean square error.
"""

#Error for linear equation curve fit.

linear_sse=0
linear_ssr=0
for j in range(3200):
	linear_error=abs((np.sum((cp[j]-fit_cp[j]))))
	linear_sse=linear_sse+pow(linear_error,2)
	linear_ssr=linear_ssr+np.sum(pow((fit_cp[j]-m),2))
linear_sst= linear_ssr+linear_sse
linear_R2=linear_ssr/linear_sst
linear_rmse=pow((linear_sse/l),0.5)

print('linear_sst=',linear_sst)
print('linear_R2=',linear_R2)
print('linear_rmse=',linear_rmse)

#Error for Cubic equation curve fit.

cubic_sse=0
cubic_ssr=0
for k in range(3200):
	cubic_error=abs((np.sum((cp[k]-fit_cp_1[k]))))
	cubic_sse=cubic_sse+pow(cubic_error,2)
	cubic_ssr=cubic_ssr+np.sum(pow((fit_cp_1[k]-m),2))
cubic_sst= cubic_ssr+cubic_sse
cubic_R2=cubic_ssr/cubic_sst
cubic_rmse=pow((cubic_sse/l),0.5)

print('cubic_sst=',cubic_sst)
print('cubic_R2=',cubic_R2)
print('cubic_rmse=',cubic_rmse)
Explanation:
The original curve for given data is obtained by loading the data file in Sublime using open commnd and this file reading is done in a fucntion, temperature and cp are seperated by split command using (,). Curve fit is the method by which we can get the curve which is approximately same as the curve which is obtained from original data. Curve fit is a command which is imported from scipy optimize module. Curve fit is obtained by polynomial equation method. So the equation is coded as fucntion and it is called while generating curve fit for different equation. By using popt command we get the coefficients for the polynomial equation and by using pcov command we get the predicted value from which we can get the curve fit by plotting it. Goodness of fit is obtained by finding error like R square and Root mean square error. By using some formulas, we obtain these error values. We get the best curve fit with less error while
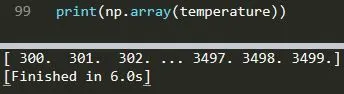
What does np.array(temperature) do?
Array is a command which is called from numpy module. Here its is used to form a array with 3200 temperature data which we got from data file.
How to make curve fit perfectly?
To make a curve fit perfect the error estimates should be considered. The perfect fit is a fit where it should match the original curve and shouldn't have any scaling and centering errors in that particular degree of the polynomial. The R^2 value must be equal to 1 and SSE=0.
What does the * in *popt mean?
popt is the array which consists of all the coefficient of equation generated based on degree of polynomial.
*popt is the command which gives the same coefficient of equation but it will multiply with e and give the output.

What does popt and pcov mean?
popt is the array which consists of all the coefficient of equation generated based on degree of polynomial.
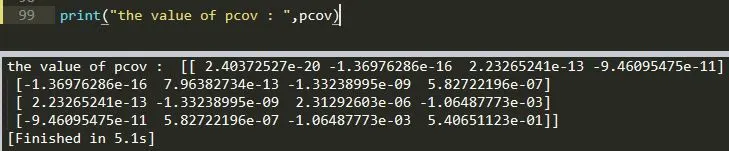
pcov is a 2D array which consists of covaraince of popt, Covaraince gives a relation between two values , so here pcov give the realtion values between popt values.
Output:
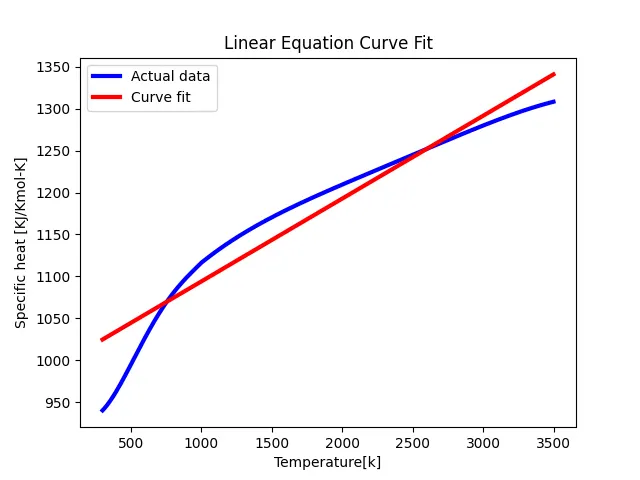
Linear Equation Curve Fit:
Here staright line is formed because curve fit is done with linear equation, so this fit is not preferable
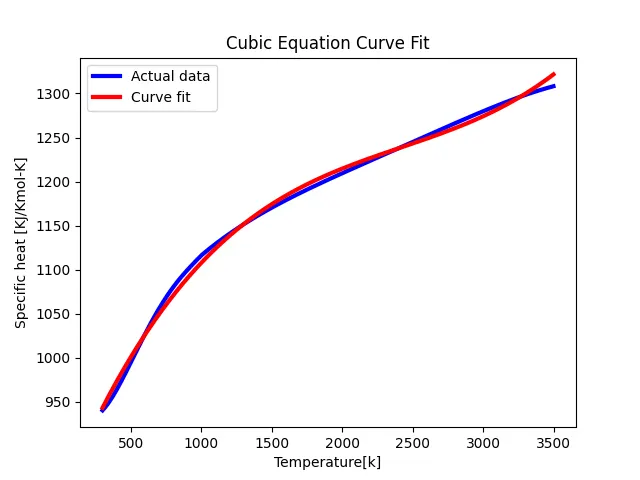
Cubic equation Curve Fit:
Here Curve fit line is nearly matching orginal data because it based on cubic Equation. So this fit is more preferable.
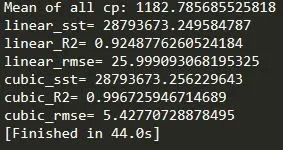
Error:
Here R-Square error value and Root mean square error is more for linear equation curve fit, cubic equation fit has less R-square error and Root mean square error, so Cubic eqaution fit is preferable