Battery characteristics using drive cycle
Simulate generic battery model to charge & discharge using UDDS data.
SIMULINK MODEL :
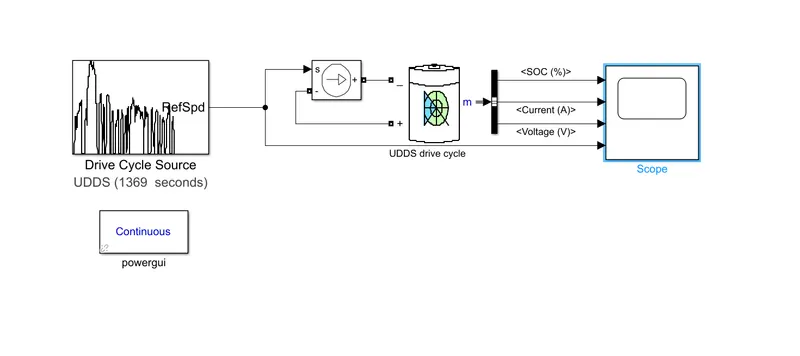
Simulink file
https://drive.google.com/file/d/1vLIxCS0DpHAuOjMa9mXXRzNwtfbgeuTR/view?usp=sharing
WORKING & STEPS INVOLVED:
The above model shows the battery discharge using the UDDS drive cycle.
- In this model,I have included the UDDS drive cycle by using the drive cycle source.
- Then the controlled current source uses the input data from the drive cycle source block. So that the discharging current is similar to the drive cycle pattern.
- The two terminals of the controlled current source are connected to the terminals of the battery
- The battery with the 5Ah with fully charged 100 SOC is used in the model.
- Using the bus selector the datas from the battery are separated and given to the scope.
- The scope takes the 3 inputs from the battery and 1 input from the drive cycle source. Then the scope is adjusted for 4 inputs and 4 layouts with the auto-adjusting axes.
- In order to run the simulation the powergui block is included and the simulation time is adjusted with the drive cycle input.
- After hitting the run button the simulation results can be obtained.
RESULT :
Thus the Simulation results for the generic battery model to charge & discharge using UDDS data is obtained.
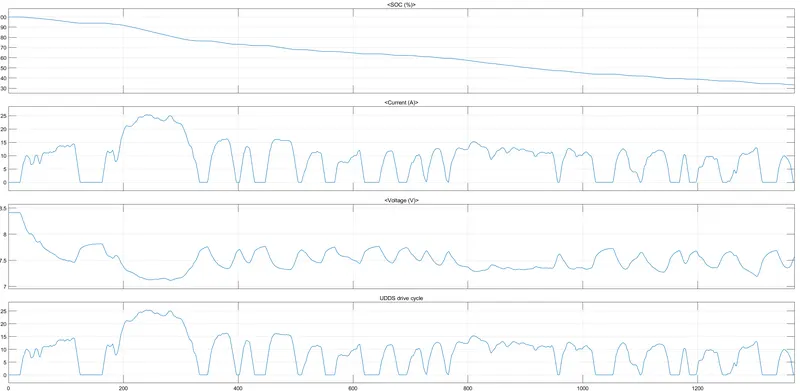
The 1st plot shows how much percentage of SOC is reduced for the 5Ah battery. For this UDDS drive cycle, the battery drain from 100% to 34%
The 2 nd plot shows how much the current is varied for the drive cycle. The current graph is similar to the drive cycle graph because the current is controlled by the drive cycle.
The 3 nd plot shows how much the voltage is varied with the current for the drive cycle.We can find that the voltage level is at 8.5 at the 100% SOC and gradually reduces after the current is drawn(can be clearly seen when the drive cycle is at rest or at 0). At last, it reduces to 7.6 when the SOC is 34%
The 4 nd plot shows the drive cycle of the UDDS pattern with the time of 1369s.