Week 5.2 - Literature review: ODE Stability
- When does an ODE become unstable?
Stability is a condition in which a slight disturbance in a system does not produce disrupting effect on that system. In terms of the solution of a differential equation, a function f(x) is said to be stable if any other solution of the equation starts out sufficiently close to it when x = 0 remains close to it for succeeding values of x. If the difference between the solutions approaches zero as x increases, the solution is called asymptotically stable. If a solution does not have either of these properties, it is called unstable.
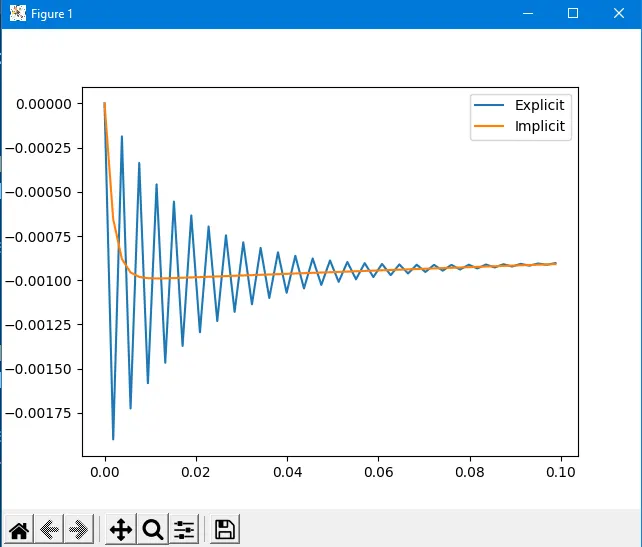
If the time step chosen is greater than a particular value, then the Solution of the ODE will become unstable for the explicit scheme(conditionally stable) whereas for the implicit scheme(unconditionally stable) it will be stable.
- How does stability affect engineering simulations?
Stability of solutions is important in physical problems because if slight deviations from the mathematical model caused by numerical errors in measurement have a correspondingly slight effect on the solution, the mathematical equations describing the problem will not accurately predict the future outcome.
- Can stability conditions be derived for all types of problems?
For linear ODE or PDE systems, stability conditions can be derived but as the equations become non-linear it becomes very complex.
--> Following Python code demonstrates the use of explicit and implicit schemes and how explicit schemes become numerically unstable.
import math
import matplotlib.pyplot as plt
import numpy as np


def explicit_euler(total_t,dt):
	t=np.arange(0, total_t, dt)
	y=np.zeros(len(t))

	for i in range(1, len(t)):
		y[i] = y[i-1] + dt*(-1000*y[i-1] - math.exp(-t[i-1]))
	return [t,y]

def implicit_euler(total_t,dt):
	t=np.arange(0, total_t, dt)
	y=np.zeros(len(t))
	for i in range(1, len(t)):
		y[i] = (y[i-1] - dt*math.exp(-t[i-1]))/(1+1000*dt)
	return [t,y]


total_t = 0.1
dt = 1.9e-3

t, y_explicit = explicit_euler(total_t,dt)
t, y_implicit = implicit_euler(total_t,dt)
plt.plot(t, y_explicit)
plt.plot(t, y_implicit)
plt.legend(['Explicit','Implicit'])
plt.show()