Week 5.1 - Mid term project - Solving the steady and unsteady 2D heat conduction problem
Objective: To solve the steady and unsteady 2D heat conduction problem using implicit and explicit method.
2D Steady state heat conduction equation,
`(∂^2T)/(∂x^2)+ (∂^2T)/(∂y^2)=0`
2D Unsteady state heat conduction equation,
`(∂T)/(∂t)=alpha* (∂^2T)/(∂x^2)+ (∂^2T)/(∂y^2)`
`text(Explicit : It is a function which is written in terms of independent varible or input varible. It is used previous value while calculating the finite difference approximation for new value.`
`text(Implicit : It is a function which is written in terms of independent varible and dependent varible.It is used previous value as well as new value while calculating the finite difference approximation for new value.)`
Temperature in kelvin at the boundary and corner of the cell
500 Boundary 700
|
|
600 |
|
|
|
400 |
|
|
800 |
|
|
|
T(i,j) |
|
|
|
900 |
|
|
650 Boundary 850
Boundary temperature mentioned inside the cell at each boundary, corner temperature is mentioned outside the cell at each corner and T(i,j) is the center of the cell
2D heat conduction Steady state
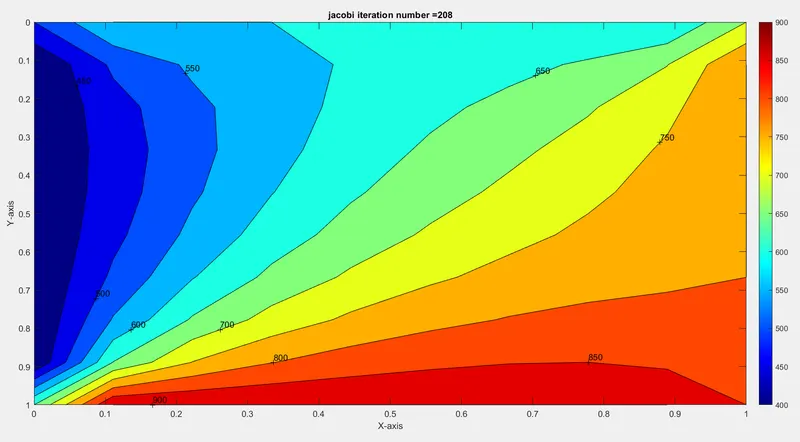
1.Jacobi method
close all

clc
dbstop if error
%input
nx =10;
ny=nx;
% grid spacing
x = linspace(0,1,nx);
y = linspace(0,1,ny);
dx= x(2) - x(1);
dy = y(2)-y(1);

T =300*ones(nx,ny);

%boundary condition
T_T = 600;
T_B = 900;
T_L = 400;
T_R = 800;
T(:,1) = 400;  % temperature on left wall
T(:,nx) = 800;  % temperature on right wall
T(1,:) = 600;   % temperature on top wall
T(ny,:) = 900;   % temperature on bottom wall
T(1,1) = (400+600)/2;  % temperature on the left corner on th grid
T(1,nx) = (600+800)/2; % temperature on the right corner on the grid
T(ny,1) = (400+900)/2; % temperature on the bottom left corner on the grid
T(nx,ny) = (900+800)/2; % temperature on the bottom right corner on the grid

T_initial = T;
Told = T;
error = 9e9;
tol = 1e-4;
iterative_solver = 1;
k= (2*(dx^2+dy^2)/(dx^2*dy^2));
%jacobi method
if iterative_solver == 1

    jacobi_iteration = 1;
    % convergence loop
    while(error>tol)
        %space loop
         for i=2:nx-1
        for j=2:ny-1

            T(i,j) =(Told(i-1,j) +Told(i+1,j))/(k*dx^2) + (Told(i,j-1) + Told(i,j+1))/(k*dy^2);
        end
         end
         error = max(max(abs(Told-T)));

         Told = T; % updating the value
         jacobi_iteration = jacobi_iteration +1;


    end
           %plotting
 figure(1)
contourf(x,y,T);
clabel(contourf(x,y,T));
colorbar
colormap(jet)
set(gca,'ydir','reverse');
    xlabel('X-axis');
ylabel('Y-axis');
title_text=sprintf('jacobi iteration number =%d',jacobi_iteration);
title(title_text)
pause(0.03)

end
Graph
2. Gauss-Siedel Method
close all
clc
dbstop if error
%input
nx =10;
ny=nx;
% grid spacing
x = linspace(0,1,nx);
y = linspace(0,1,ny);
dx= x(2) - x(1);
dy = y(2)-y(1);

T =300*ones(nx,ny);


%boundary condition
T_T = 600;
T_B = 900;
T_L = 400;
T_R = 800;
T(:,1) = 400;  % temperature on left wall
T(:,nx) = 800;  % temperature on right wall
T(1,:) = 600;   % temperature on top wall
T(ny,:) = 900;   % temperature on bottom wall
T(1,1) = (400+600)/2;  % temperature on the left corner on th grid
T(1,nx) = (600+800)/2; % temperature on the right corner on the grid
T(ny,1) = (400+900)/2; % temperature on the bottom left corner on the grid
T(nx,ny) = (900+800)/2; % temperature on the bottom right corner on the grid

T_initial = T;
Told = T;
error = 9e9;
tol = 1e-4;
k= (2*(dx^2+dy^2)/(dx^2*dy^2));
iterative_solver = 2;
%gauss-siedel method
if iterative_solver == 2
    gs_iteration = 1;
%     Convergence loop
    while(error>tol)
        %space loop
         for i=2:nx-1
        for j=2:ny-1

            T(i,j) =((T(i-1,j) +Told(i+1,j))/(k*dx^2) + (T(i,j-1) + Told(i,j+1))/(k*dy^2));
        end
         end
         error = max(max(abs(Told-T)));

         Told = T;   % updating the value
         gs_iteration = gs_iteration +1;


    end
      %plotting
figure(1)
contourf(x,y,T)
clabel(contourf(x,y,T));
colorbar
colormap(jet)
set(gca,'ydir','reverse');
    xlabel('X-axis');
ylabel('Y-axis');
title_text=sprintf('gs iteration number =%d',gs_iteration);
title(title_text)
pause(0.03)

end
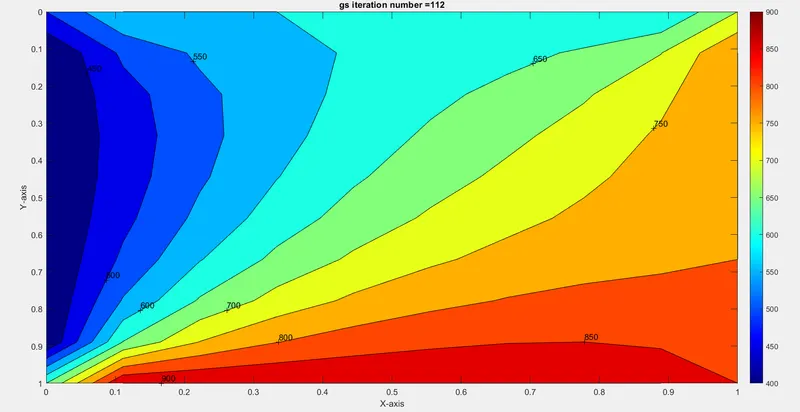
Graph
3. Successive over-relaxation Method
close all
clc
dbstop if error
%input
nx =10;
ny=nx;
% grid spacing
x = linspace(0,1,nx);
y = linspace(0,1,ny);
dx= x(2) - x(1);
dy = y(2)-y(1);

T =300*ones(nx,ny);


%boundary condition
T_T = 600;
T_B = 900;
T_L = 400;
T_R = 800;
T(:,1) = 400;  % temperature on left wall
T(:,nx) = 800;  % temperature on right wall
T(1,:) = 600;   % temperature on top wall
T(ny,:) = 900;   % temperature on bottom wall
T(1,1) = (400+600)/2;  % temperature on the left corner on th grid
T(1,nx) = (600+800)/2; % temperature on the right corner on the grid
T(ny,1) = (400+900)/2; % temperature on the bottom left corner on the grid
T(nx,ny) = (900+800)/2; % temperature on the bottom right corner on the grid

T_initial = T;
Told = T;
error = 9e9;
tol = 1e-4;
iterative_solver = 3;
k= (2*(dx^2+dy^2)/(dx^2*dy^2));
%gauss-siedel method
if iterative_solver == 3
    sor_iteration = 1;
    omega = 1.2;
    % convergence loop
    while(error>tol)
        %space loop
         for i=2:nx-1
        for j=2:ny-1

            T(i,j) =(1-omega)*Told(i,j)+(omega*((T(i-1,j) +Told(i+1,j))/(k*dx^2) + (T(i,j-1) + Told(i,j+1))/(k*dy^2)));
        end
         end
         error = max(max(abs(Told-T)));

         Told = T;    % updating the value
         sor_iteration = sor_iteration +1;
    end
    %plotting

figure(1)
contourf(x,y,T)
clabel(contourf(x,y,T));
colorbar
colormap(jet)
set(gca,'ydir','reverse');
    xlabel('X-axis');
ylabel('Y-axis');
title_text=sprintf("sor iteration number    =%d",   sor_iteration);
title(title_text)
pause(0.03)

end
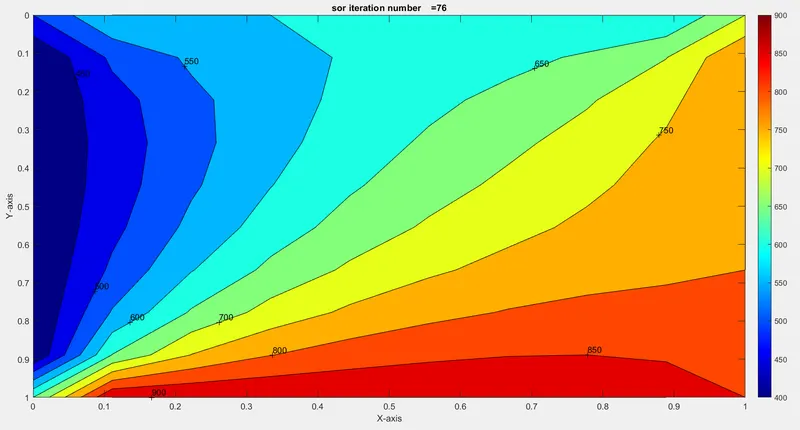
Graph
2D heta conduction unsteady state
1. Jacobi Method
close all

clc
dbstop if error
%input
nx =10;
ny=nx;
nt = 1400;
% grid spacing
x = linspace(0,1,nx);
y = linspace(0,1,ny);
dx= x(2) - x(1);
dy = y(2)-y(1);

T =300*ones(nx,ny);

%boundary condition
T_T = 600;
T_B = 900;
T_L = 400;
T_R = 800;
T(:,1) = 400;  % temperature on left wall
T(:,nx) = 800;  % temperature on right wall
T(1,:) = 600;   % temperature on top wall
T(ny,:) = 900;   % temperature on bottom wall
T(1,1) = (400+600)/2;  % temperature on the left corner on th grid
T(1,nx) = (600+800)/2; % temperature on the right corner on the grid
T(ny,1) = (400+900)/2; % temperature on the bottom left corner on the grid
T(nx,ny) = (900+800)/2; % temperature on the bottom right corner on the grid

T_initial = T;
Told = T;

tol = 1e-4;
dt = 0.0015;
t = nt*dt;
k1=(1.4*dt)/(dx)^2;
k2 = (1.4*dt)/(dx)^2;
CFL = k1+k2; % CFL number must be lesser than 0.5
jacobi_iteration = 1;
%jacobi method
%time loop
for k=1:nt
    error = 9e9;
    %convergence loop
    while(error>tol)
        %space loop
         for i=2:nx-1
        for j=2:ny-1
               term_1 = (1+(2*k1)+(2*k2))^-1;
               term_2 = k1*term_1;
               term_3 = k2*term_1;
               H = (Told(i-1,j) +Told(i+1,j));
               V = (Told(i,j-1) + Told(i,j+1));
            T(i,j) =term_1*T_initial(i,j)+(H*term_2)+(V*term_3);
        end
         end
         error = max(max(abs(Told-T)));

         Told = T;   % updating the value
         jacobi_iteration = jacobi_iteration +1;


    end
    T_initial=T;
      %plotting
    figure(1)
contourf(x,y,T)
clabel(contourf(x,y,T));
colorbar;
colormap(jet);
set(gca,'ydir','reverse');
    xlabel('X-axis');
ylabel('Y-axis');
title_text=sprintf('jacobi iteration number=%d',jacobi_iteration);
title_1=sprintf('CFL number=%d',  CFL);
title(title_text, title_1)
pause(0.03)
end
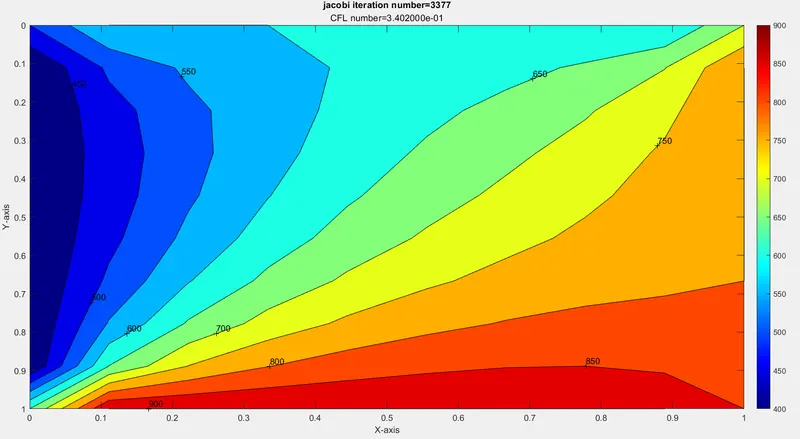
Graph
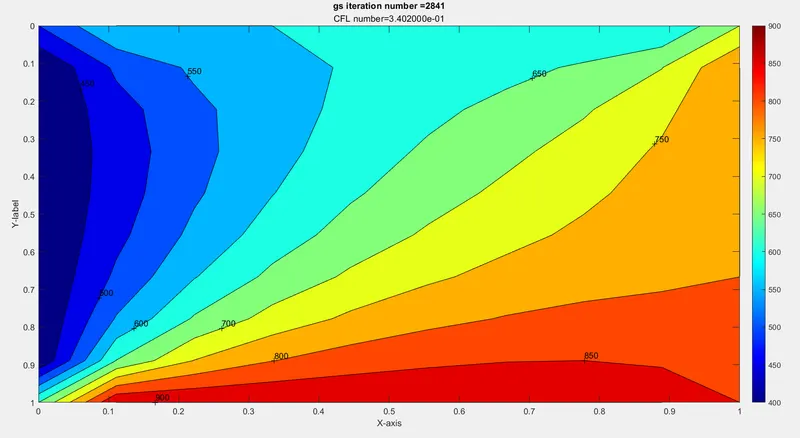
2. Gauss-Siedel Method
close all

clc
dbstop if error
%input
nx =10;
ny=nx;
nt = 1400;
%grid spacing
x = linspace(0,1,nx);
y = linspace(0,1,ny);
dx= x(2) - x(1);
dy = y(2)-y(1);

T =300*ones(nx,ny);


%boundary condition
T_T = 600;
T_B = 900;
T_L = 400;
T_R = 800;
T(:,1) = 400;  % temperature on left wall
T(:,nx) = 800;  % temperature on right wall
T(1,:) = 600;   % temperature on top wall
T(ny,:) = 900;   % temperature on bottom wall
T(1,1) = (400+600)/2;  % temperature on the left corner on th grid
T(1,nx) = (600+800)/2; % temperature on the right corner on the grid
T(ny,1) = (400+900)/2; % temperature on the bottom left corner on the grid
T(nx,ny) = (900+800)/2; % temperature on the bottom right corner on the grid

T_initial = T;
Told = T;

tol = 1e-4;
dt = 0.0015;
t = nt*dt;
k1=(1.4*dt)/(dx)^2;
k2 = (1.4*dt)/(dx)^2;
CFL = k1+k2; % CFL number must be lesser than 0.5
gs_iteration = 2;
%jacobi method
%time loop
for k=1:nt
    error = 9e9;
    %convegence loop
    while(error>tol)
        %space loop
         for i=2:nx-1
        for j=2:ny-1
               term_1 = (1+(2*k1)+(2*k2))^-1;
               term_2 = k1*term_1;
               term_3 = k2*term_1;
               H = (T(i-1,j) +Told(i+1,j));
               V = (T(i,j-1) + Told(i,j+1));
            T(i,j) =term_1*T_initial(i,j)+(H*term_2)+(V*term_3);
        end
         end
         error = max(max(abs(Told-T)));

         Told = T;   % updating the value
         gs_iteration = gs_iteration +1;


    end
    T_initial=T;
     %plotting
    figure(1)
contourf(x,y,T)
clabel(contourf(x,y,T));
colorbar
colormap(jet)
set(gca,'ydir','reverse');
    xlabel('X-axis');
ylabel('Y-label');
title_text=sprintf('gs iteration number =%d',gs_iteration);
title_1=sprintf('CFL number=%d',  CFL);
title(title_text, title_1)
pause(0.03)
end
Graph
3. Successive over-relaxation
close all

clc
dbstop if error
%input
nx =10;
ny=nx;
nt = 1400;   % number of time step
% grid spacing
x = linspace(0,1,nx);
y = linspace(0,1,ny);
dx= x(2) - x(1);
dy = y(2)-y(1);

T =300*ones(nx,ny);

%boundary condition
T_T = 600;
T_B = 900;
T_L = 400;
T_R = 800;
T(:,1) = 400;  % temperature on left wall
T(:,nx) = 800;  % temperature on right wall
T(1,:) = 600;   % temperature on top wall
T(ny,:) = 900;   % temperature on bottom wall
T(1,1) = (400+600)/2;  % temperature on the left corner on th grid
T(1,nx) = (600+800)/2; % temperature on the right corner on the grid
T(ny,1) = (400+900)/2; % temperature on the bottom left corner on the grid
T(nx,ny) = (900+800)/2; % temperature on the bottom right corner on the grid
T_initial = T;
Told = T;
tol = 1e-4;
dt = 0.0015;
t = nt*dt;
omega = 1.1;
k1=(1.4*dt)/(dx)^2;
k2 = (1.4*dt)/(dy)^2;
CFL = k1+k2; % CFL number must be lesser than 0.5
sor_iteration = 3;
%jacobi method
%time loop
for k=1:nt
    error = 9e9;
    %convergence loop
    while(error>tol)
        %space loop
         for i=2:nx-1
        for j=2:ny-1
               term_1 = (1+(2*k1)+(2*k2))^-1;
               term_2 = k1*term_1;
               term_3 = k2*term_1;
               H = (T(i-1,j) +Told(i+1,j));
               V = (T(i,j-1) + Told(i,j+1));
            T(i,j) =(term_1*T_initial(i,j))+(H*term_2)+(V*term_3);
            T(i,j) = (1-omega)*Told(i,j) + omega*T(i,j);
        end
         end
         error = max(max(abs(Told-T)));

         Told = T; %updating the value
         sor_iteration = sor_iteration +1;

    end
    T_initial=T;
     %plotting
    figure(1)
contourf(x,y,T)
clabel(contourf(x,y,T));
colorbar
colormap(jet)
set(gca,'ydir','reverse');
    xlabel('X-axis');
ylabel('Y-label');
title_text=sprintf('sor iteration number =%d',sor_iteration);
title_1=sprintf('CFL number=%d',  CFL);
title(title_text, title_1)
pause(0.03)
end
Graph
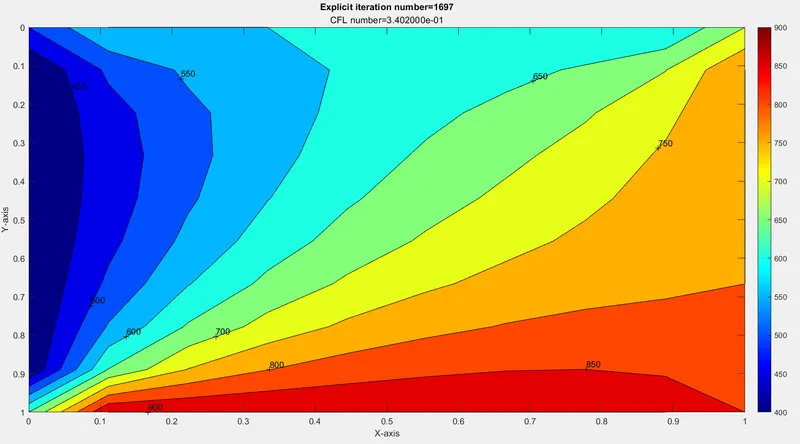
2D heat conduction unsteady state explicit method
close all

clc
dbstop if error
%input
nx =10;
ny=nx;
nt = 1400; % number of time step
%grid spacing
x = linspace(0,1,nx);
y = linspace(0,1,ny);
dx= x(2) - x(1);
dy = y(2)-y(1);

T =300*ones(nx,ny);

%boundary condition
T_T = 600;
T_B = 900;
T_L = 400;
T_R = 800;
T(:,1) = 400;  % temperature on left wall
T(:,nx) = 800;  % temperature on right wall
T(1,:) = 600;   % temperature on top wall
T(ny,:) = 900;   % temperature on bottom wall
T(1,1) = (400+600)/2;  % temperature on the left corner on th grid
T(1,nx) = (600+800)/2; % temperature on the right corner on the grid
T(ny,1) = (400+900)/2; % temperature on the bottom left corner on the grid
T(nx,ny) = (900+800)/2; % temperature on the bottom right corner on the grid

T_initial = T;
Told = T;

tol = 1e-4;
dt = 0.0015;
t = nt*dt;
k1=(1.4*dt)/(dx)^2;
k2 = (1.4*dt)/(dx)^2;
CFL = k1+k2; % CFL number must be lesser than 0.5
explicit_iteration = 1;
% explicit method
%time loop
for k=1:nt
    error = 9e9;
    % convergence loop
    while(error>tol)
        %space loop
         for i=2:nx-1
        for j=2:ny-1
               term_1 = Told(i,j);
               term_2 = k1*(Told(i-1,j) -2*T(i,j)+Told(i+1,j));
               term_3 = k2*(Told(i,j-1) -2*T(i,j)+ Told(i,j+1));
            T(i,j) = term_1 + term_2 + term_3;
        end
         end
         error = max(max(abs(Told-T)));

         Told = T;   % updating the value
         explicit_iteration = explicit_iteration +1;


    end
    T_initial=T;
     %plotting
    figure(1)
contourf(x,y,T)
clabel(contourf(x,y,T));
colorbar;
colormap(jet);
set(gca,'ydir','reverse');
    xlabel('X-axis');
ylabel('Y-axis');
title_text=sprintf('Explicit iteration number=%d',explicit_iteration);
title_1=sprintf('CFL number=%d',  CFL);
title(title_text, title_1)
pause(0.03)
end
Graph
Conclusion
- Jacobi> gauss-siedel>Successive over-relaxation method need number of iteration to compute the methods accordingly.
- While comparing the steady and unsteady state , steady state need less number of iteration to compute the problem.
- While observing the efficient method then Successive over-realaxation is the most efficient method to compute the problem because it need less number of iteration to compute over jacobi and gauss-siedel method.
- Unsteady state explicit method need less number of iteration to compute the problem than unsteady state implicit method.
- Steady state implicit method need less number of iteration than unsteady state implicit method while computing the problem.
- Lesser the number of iteration faster the convergence of the problem.