Week 11 - Simulation of Flow through a pipe in OpenFoam
Objective: To simulate the flow through pipe in openFoam.
Laminar flow in pipe
- Reynolds number is the ratio of the inertial force to the viscous force.
- It is a dimensionaless number.
`Re = text(inertial force)/text(viscous force)` `(V_(avg) D)/v = (rho V_(avg) D)/(mu)`
- Reynolds number less than 2100 is called laminar flow and grater than 2100 s called turbulent flow.
- At the entry of the fluid into the pipe, due to the no-slip condition at the wall, the fluid particles in the layer in contact with the wall come to a complete stop. It also cause the fluid particles in the adjacent layer to slow down gradually as a result of friction force (viscous force). To make up for this velocity reduction, the velocity of the fluid at the midsection of the ppe has to increase to keep the mas flow rate through the pipe constant. As a result a velocity gradient developes along the pipe , it creates a hypothetical boundary surface called the boundary layer region.
- Therfore hypothetical boundary surfaces is created and divides the flow in a pipe into two region: the boundary layer region , in which the viscous effect and velocity changes are significant and the free stream flow. Irrotational flow region: in which the frictonal effects are negligible and the velocity remains essentially constant in the radial direction.
- At the starting of the inlet thickness of the boundary -layer region is zero and thickness start to increase in the flow directional untill the boundary layer reaches the ppe center and thus fills the entire pipe and the velocity becomes fully developed.
- The region from the pipe inlet to the point at which the velocity profile s fully developes is called hydrodynamic entrance region.
- The region beyond the hydrodynamic entrance region in which the velocity profile is fully developed and remains unchanged is called the hydrodynamic fully developed region.
- The wall shear stress is the highest at the pipe inlet where the thickness of the boundary layer is smallest and decrease gradually with an increase in boundary layer thickness untill its value equals the wall shear stress at the fully developed region . Therefore the pressure drop is higher in the entrance region of a pipe.
- In many pipe flows of practical engineering interest , the entrance effects become insignificant beyond a pipe length equals to 10 times the pipe diameter.
`(L_h,text(turbulent))/D ~~10`
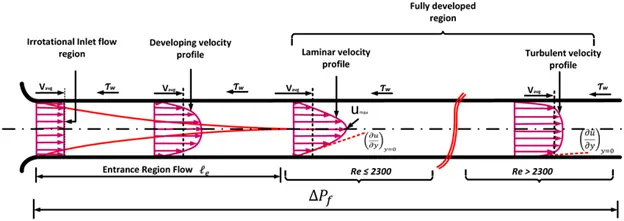
Fully developed Laminar flow through the pipe
- It is also called Hagen-Poiseuille flow. It is defined by assuming fluid is incompressible , flow is steady, fluid flow in a horizontal pipe , 1D flow and velocity is developed.
- velocity fully developed means axial velocity does not varies in the flow direction. it remains constant.
- Axial velocity u(velocity along the flow direction) is positive along the radial direction and it varies parabolically along the radial direction and thus the axial pressure gradient dP/dx must be negative i.e. pressure must decrease in the flow direction because o viscous effects . it takes pressure to push the flud through the pipe.
- `u_(max) = 2V_(avg)`
Matlab Code
clear all
clc
%%input data
d = 5; % diameter in cm
l = 500; % length in cm
A = 5; % wedge angle
v_0 = [0 0 0];
v_1 = [l 0 0];
v_2 = [l (d/2)*cosd(A/2)  (d/2)*cosd(90-(A/2))];
v_3 = [0 (d/2)*cosd(A/2)  (d/2)*cosd(90-(A/2))];
v_4 = [l (d/2)*cosd(A/2)  -(d/2)*cosd(90-(A/2))];
v_5 = [0 (d/2)*cosd(A/2)  -(d/2)*cosd(90-(A/2))];
 vertices = [v_0;v_1;v_2;v_3;v_4;v_5];
 %% To read and write initial line up to vertices
 file_read = fopen('blockMeshDict_Template','r')
 file_write = fopen('blockMeshDict','w')
 for lines = 1:20
     Fline{lines} = fgetl(file_read); % to store every single lines
     fprintf(file_write,'%s',Fline{lines});
     fprintf(file_write,'n');
 end
 %%to write vertices line
 for i = 1:6
     fprintf(file_write,'%s','     (');
     fprintf(file_write,'%2.4f ',vertices(i,:));
     fprintf(file_write,'%s',')');
     fprintf(file_write,'n');
 end
 %%to write remaining line
 for lines = 21:88
     Fline{lines} = fgetl(file_read); % to store every single line
     fprintf(file_write,'%s',Fline{lines});
     fprintf(file_write,'n');
 end
BlockMeshDict File
/*--------------------------------*- C++ -*----------------------------------*\
| =========                 |                                                 |
| \\      /  F ield         | OpenFOAM: The Open Source CFD Toolbox           |
|  \\    /   O peration     | Version:  v2012                                 |
|   \\  /    A nd           | Website:  www.openfoam.com                      |
|    \\/     M anipulation  |                                                 |
\*---------------------------------------------------------------------------*/
FoamFile
{
    version     2.0;
    format      ascii;
    class       dictionary;
    object      blockMeshDict;
}
// * * * * * * * * * * * * * * * * * * * * * * * * * * * * * * * * * * * * * //

convertToMeters  0.01;

vertices
(
   (0 0 0 )
   (500 0 0)
   (500 2.4976 0.109048)
   (0 2.4976 0.109048)
   (500 2.4976 -0.109048)
   (0 2.4976 -0.109048)

);

blocks
(
    hex (0 5 3 0 1 4 2 1) (200 1 250)simpleGrading (1 1 1)

);

edges
(
);

boundary
(
    axis
    {
        type empty;
        faces
        (
            (0 1 1 0)

        );
    }
    inlet
    {
        type patch;
        faces
        (
            (0 5 3 0)

        );
    }
    outlet
    {
        type patch;
        faces
        (
            (1 4 2 1)

        );
    }
 noslipwalls
    {
        type walls;
        faces
        (
            (3 2 4 5)

        );
    }
 front
    {
        type wedge;
        faces
        (
            (0 1 2 3)

        );
    }
 back
    {
        type wedge;
        faces
        (
            (0 5 4 1)

        );
    }
);

mergePatchPairs
(
);

// ************************************************************************* //
ControlDict File
/*--------------------------------*- C++ -*----------------------------------*\
| =========                 |                                                 |
| \\      /  F ield         | OpenFOAM: The Open Source CFD Toolbox           |
|  \\    /   O peration     | Version:  v2012                                 |
|   \\  /    A nd           | Website:  www.openfoam.com                      |
|    \\/     M anipulation  |                                                 |
\*---------------------------------------------------------------------------*/
FoamFile
{
    version     2.0;
    format      ascii;
    class       dictionary;
    location    "system";
    object      controlDict;
}
// * * * * * * * * * * * * * * * * * * * * * * * * * * * * * * * * * * * * * //

application     icoFoam;

startFrom       startTime;

startTime       0;

stopAt          endTime;

endTime         180;

deltaT         0.05;

writeControl    timeStep;

writeInterval   20;

purgeWrite      0;

writeFormat     ascii;

writePrecision  6;

writeCompression off;

timeFormat      general;

timePrecision   6;

runTimeModifiable true;


// ************************************************************************* //
P file
/*--------------------------------*- C++ -*----------------------------------*\
| =========                 |                                                 |
| \\      /  F ield         | OpenFOAM: The Open Source CFD Toolbox           |
|  \\    /   O peration     | Version:  v2012                                 |
|   \\  /    A nd           | Website:  www.openfoam.com                      |
|    \\/     M anipulation  |                                                 |
\*---------------------------------------------------------------------------*/
FoamFile
{
    version     2.0;
    format      ascii;
    class       volScalarField;
    object      p;
}
// * * * * * * * * * * * * * * * * * * * * * * * * * * * * * * * * * * * * * //

dimensions      [0 2 -2 0 0 0 0];

internalField   uniform 0;

boundaryField
{
  axis
    {
        type        empty;
    }
    inlet
    {
        type            zeroGradient;
    }

    outlet
    {
        type            fixedValue;
        value           uniform 0;
    }

    noslipwalls
    {
        type          zeroGradient;
    }
 front
    {
        type            wedge;
    }
    back
    {
        type            wedge;
    }
}

// ************************************************************************* //
U File
/*--------------------------------*- C++ -*----------------------------------*\
| =========                 |                                                 |
| \\      /  F ield         | OpenFOAM: The Open Source CFD Toolbox           |
|  \\    /   O peration     | Version:  v2012                                 |
|   \\  /    A nd           | Website:  www.openfoam.com                      |
|    \\/     M anipulation  |                                                 |
\*---------------------------------------------------------------------------*/
FoamFile
{
    version     2.0;
    format      ascii;
    class       volVectorField;
    object      U;
}
// * * * * * * * * * * * * * * * * * * * * * * * * * * * * * * * * * * * * * //

dimensions      [0 1 -1 0 0 0 0];

internalField   uniform (0.0336294 0 0);

boundaryField
{
axis
    {
        type            empty;

    }

    inlet
    {
        type            fixedValue;
        value           uniform (0.0336294 0 0);
    }

   outlet
    {
        type           zeroGradient;
    }

   noslipwalls
    {
        type            noSlip;
    }
   front
    {
        type            wedge;
    }
    back
    {
        type            wedge;
    }
}

// ************************************************************************* //
Transportproperties File
/*--------------------------------*- C++ -*----------------------------------*\
| =========                 |                                                 |
| \\      /  F ield         | OpenFOAM: The Open Source CFD Toolbox           |
|  \\    /   O peration     | Version:  v2012                                 |
|   \\  /    A nd           | Website:  www.openfoam.com                      |
|    \\/     M anipulation  |                                                 |
\*---------------------------------------------------------------------------*/
FoamFile
{
    version     2.0;
    format      ascii;
    class       dictionary;
    location    "constant";
    object      transportProperties;
}
// * * * * * * * * * * * * * * * * * * * * * * * * * * * * * * * * * * * * * //

nu             [0 2 -1 0 0 0 0] 1e-7;


// ************************************************************************* //
plot
Stress profile
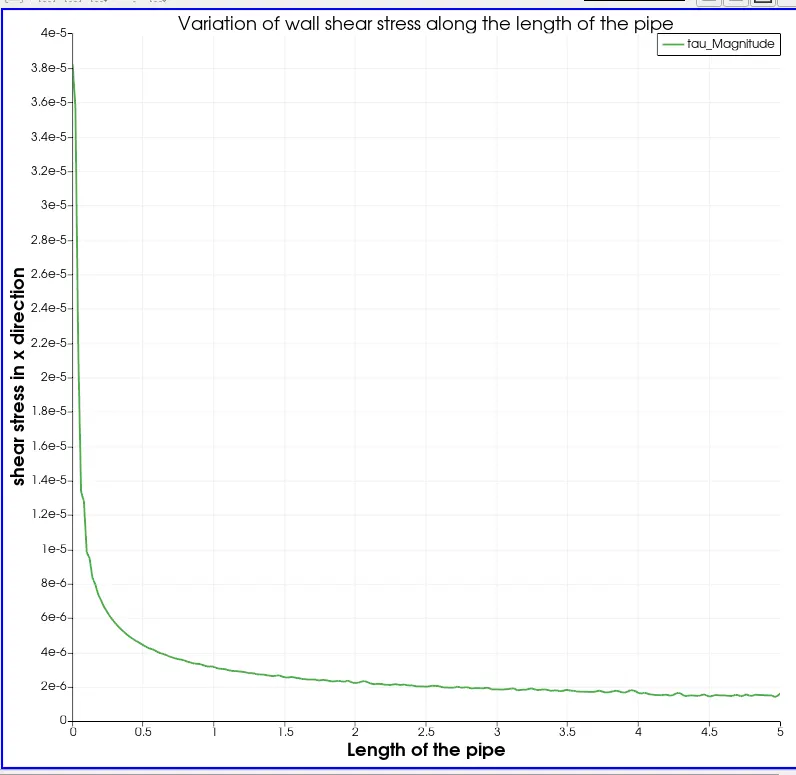
- Shear stress decrease along the length of the pipe. Initially strees is high and it goes, along the length ,stress decrease but as we can see that after the pipe length 2.5m stress is almost constant which shows that after the length 2.5m , we will get the fully developed flow.
Velocity Profile
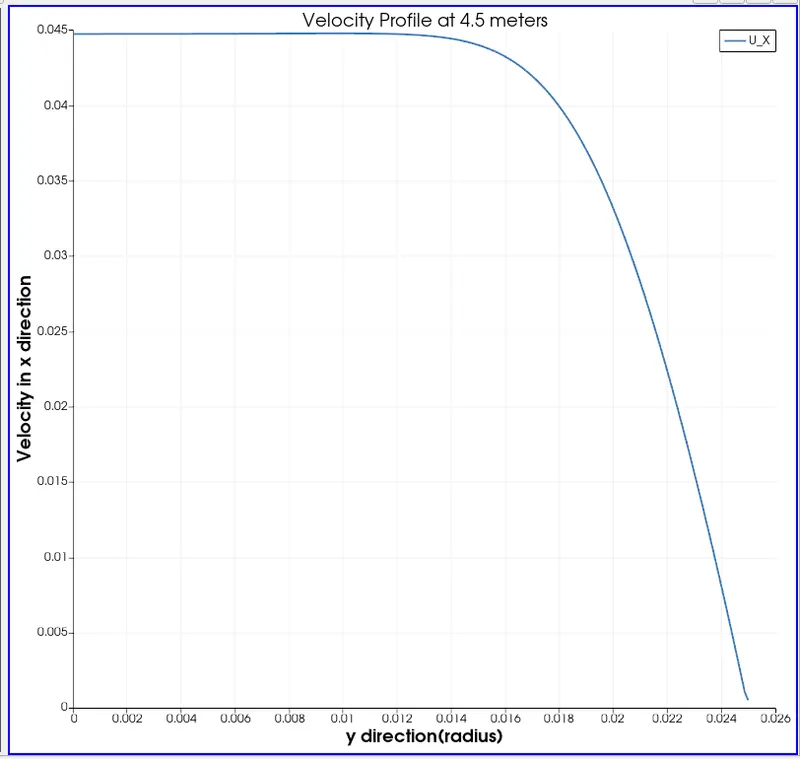
- As we can see that velocity is decrease sharply after the pipe length 4.5m and before that we have highest velocity.
- Initially velocity is low due to shear stress but as we goes along the pipe length, velocity is going increase towards the center of the pipe. Hence we have maximum velocity at center of the pipe.
Pressure Profile
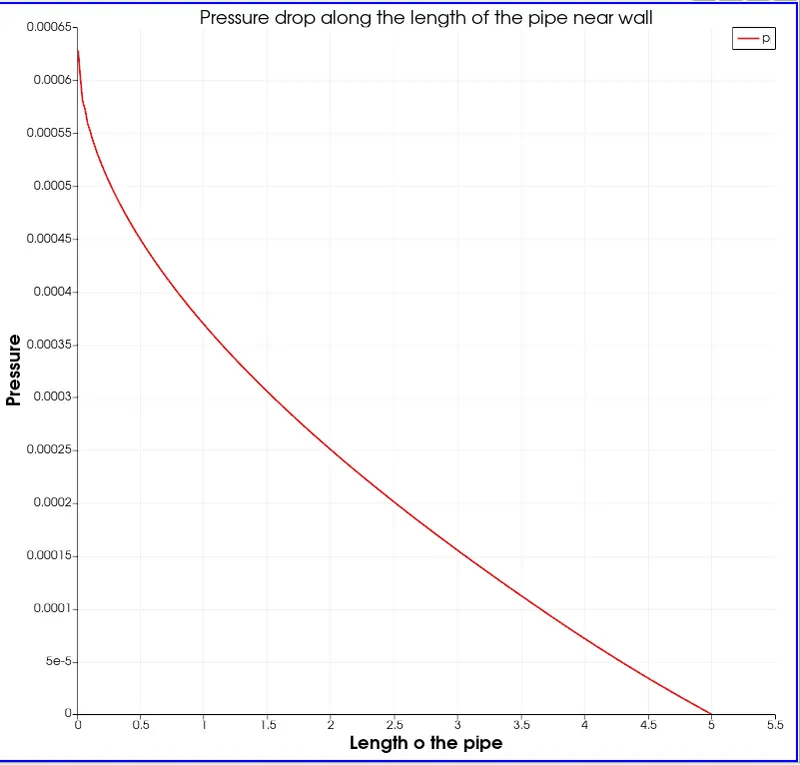
- As we can see that Pressure drop gradually along the length of the pipe.
- As we know that fluid flow high pressure area to the low pressure area. so as we go to the length of the pipe, pressure is decreasing and fluid move with high velocity at the center of the pipe which is our fully developed fluid flow.
Result
- Above graphs show the validation of hydro-dynamic length, fully developed velocity profile, Pressure drop, maximum velocity and wall shear stress for fully developed flow.