Week 4 - Genetic Algorithm
Aim
To program thge code and to calculate the global maxima of the stalagmite function then to explain the process of genetic algorithm in matlab.
OBJECTIVE
To optimize stalagmite function and to find global maxima.
To explain concept of genetic algorithm by using syntax
To explain the variations in optimum points by using boundaries and by using population strength.
THEORY
Genetic Algorithm is the process of natural selection. it is used to produce high quality output.genetic algorithms is like the evolution process where the most fittest are surviving in this nature.Genetic algorithm are used for fing the fittest outputs.
CALCULATIONS
To find global maxima
f = (f1*f2*f3*f4)
To find global minima
f = -(f1*f2*f3*f4)
where
f1 = (sin(5.1*3.14*x)+.05)^6
f2 = (sin(5.1*3.14*x)+.05)^6
f3 = exp[-4log(2)*(x-.0667)^2/0.64)]
f4 = exp[-4log(2)(y-.0667)^2/.64)]
where x and y are two variables
Program to find the statistical behaviour of generic algorithm using stalagmite function
PROGRAM
clear all
close all
clc

x = linspace(0,1,150);
y = linspace(0,1,150);
num_cases = 50;
[xx,yy] = meshgrid(x,y);

% Evaluating the stalagmite function
for i = 1: length(xx)
    for j = 1: length(yy)

        input_vector(1) = xx(i,j);
        input_vector(2) = yy(i,j);

        f(i,j) = stalagmitee(input_vector);
    end
end

%study1 - statistical behaviour

for i = 1 : num_cases
    [inputs,fopt(i)] = ga(@stalagmitee,2);
    xopt(i) = inputs(1);
    yopt(i) = inputs(2);
end
figure(1)

surfc(xx,yy,f)
hold on
plot3(xopt,yopt,fopt,'marker','o','markersize',5,'markerfacecolor','r');
title('unbounded inputs')
hold off
figure(2)
plot(fopt)
shading interp
xlabel('iterations')
ylabel('function minimum')

tic
%study 2 - statistical behaviour - with upper and lower bound

for i = 1:num_cases
    [inputs,fopt(i)] = ga(@stalagmitee,2,[],[],[],[],[0:0],[0.6:0.6]);
    xopt(i) = inputs(1);
    yopt(i) = inputs(2);
end
study2_time = toc

figure(4)
subplot(2,1,1)

surfc(x,y,f)
hold on
shading interp
plot3(xopt,yopt,fopt,'marker','o','markersize',5,'markerfacecolor','r')
title('bounded inputs')
subplot(2,1,2)
plot(fopt)
xlabel('iterations')
ylabel('function minimum')
%
% % study 3 increasing GA iterations
%
options=optimoptions('ga')
options=optimoptions(options,'PopulationSize',400);


tic
for i = 1:num_cases
    [inputs,fopt(i)] = ga(@stalagmitee,2,[],[],[],[],[0:0],[.6:.6],[],[],options);
    xopt(i) = inputs(1);
    yopt(i) = inputs(2);
end
study3_time = toc
figure(3)
subplot(2,1,1)
hold on
surfc(x,y,f)
shading interp
plot3(xopt,yopt,fopt,'marker','o','markersize',5,'markerfacecolor','r')
title('bounded inputs')
subplot(2,1,2)
plot(fopt)
xlabel('iterations')
ylabel('function minimum')
function program
x = linspace(0,.6,150)
y = linspace(0,.6,150)

%creating a 2 dimensional mesh
[xx,yy] = meshgrid(x,y);

% Evaluating the stalagmite function
for i = 1: length(xx)
    for j = 1: length(yy)

        input_vector(1) = xx(i,j);
        input_vector(2) = yy(i,j);
        f(i,j) = stalagmitee(input_vector);
    end
end
surfc(xx,yy,f)
CODE EXPLANTION
First create the x and y arrays and by using meshgrid command it meshes the matrix.
by using the for loop the generic algorithm is worked out where the two values of x and y are saved into inputvectors
f(i,j) = stalagmite(input vector) where the output from the stalagmite function are calculated into f(i,j)
surfc is used to plot the surface in the x and y planes
function explanation - function[f] = stalagmite(input) where the the function saves the value of input vectors
the variable x and y are feeded and the calculations are done as per by the given equations.
first case with unbounded inputs. here for is created til the number of cases
[inputs,fopt(i)] = ga@stalagmite,2) where the ga command calculate the stalagmite function and the values are stored in to inputs and fopt.
then these input values are store to xopt and yopt respectively.
subplt is used to plot multiple points in a surface and shading interp are used to shade the cones.
plot3(xopt,yopt,fopt) are used for plotting the xoptimum,yoptimum and foptimum values respectively.
In the second case we bounds the inputs to 0.6
the optimum values are created by programming inside a for loop as we did last time.
tic and toc commands are used to calculate the running time of the function.
[inputs,fopt(i)] = ga(@stalagmite,2,[],[],[],[],[0:0],[.6:.6]) where the inpus are bounded to 0.6 and the value of function processed by ga are to obtain the values of inputs and fopt.
then the surface ploting and subplotting areprocessed according to values. then by using the plot3 command theoptimum values are plotted where the x axis is plotted as iterations and yaxis is plotted as function minmum.
in the third casewe increase the ga iterations.
options = optimoptions(ga);
options = optimoption('options,'populationsixe',70) are used to define
then the optimum values are produced and store to xopt and topt respectively by using for loop and the graphs are plotted by using surfc and subplot commands.
plot3 command is used to to plot the optimum values.
Function program is used to stalagmite the input valueshere the xx and yy values are stored to input vectors inside afor loop.
f(i,j) = stalagmite(input_vector) where the stalagmite values of input vectors are calculated to f(i,j).
OUTPUT
Unbounded inputs
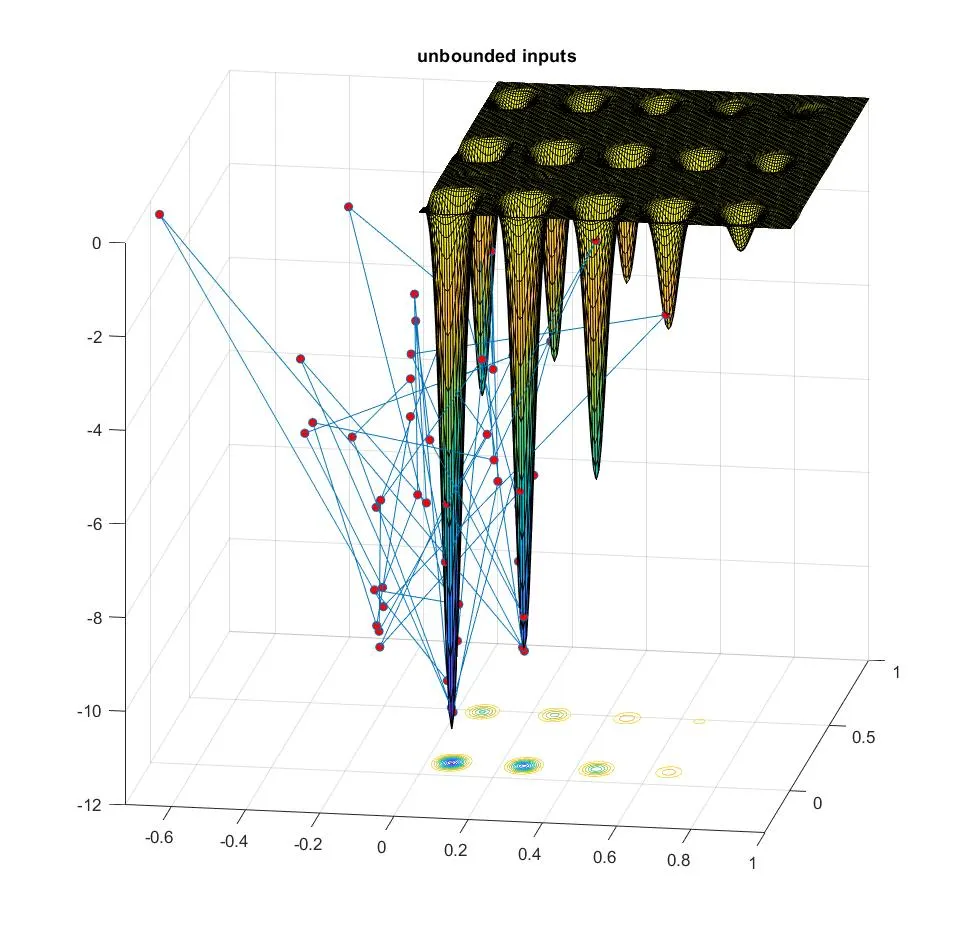
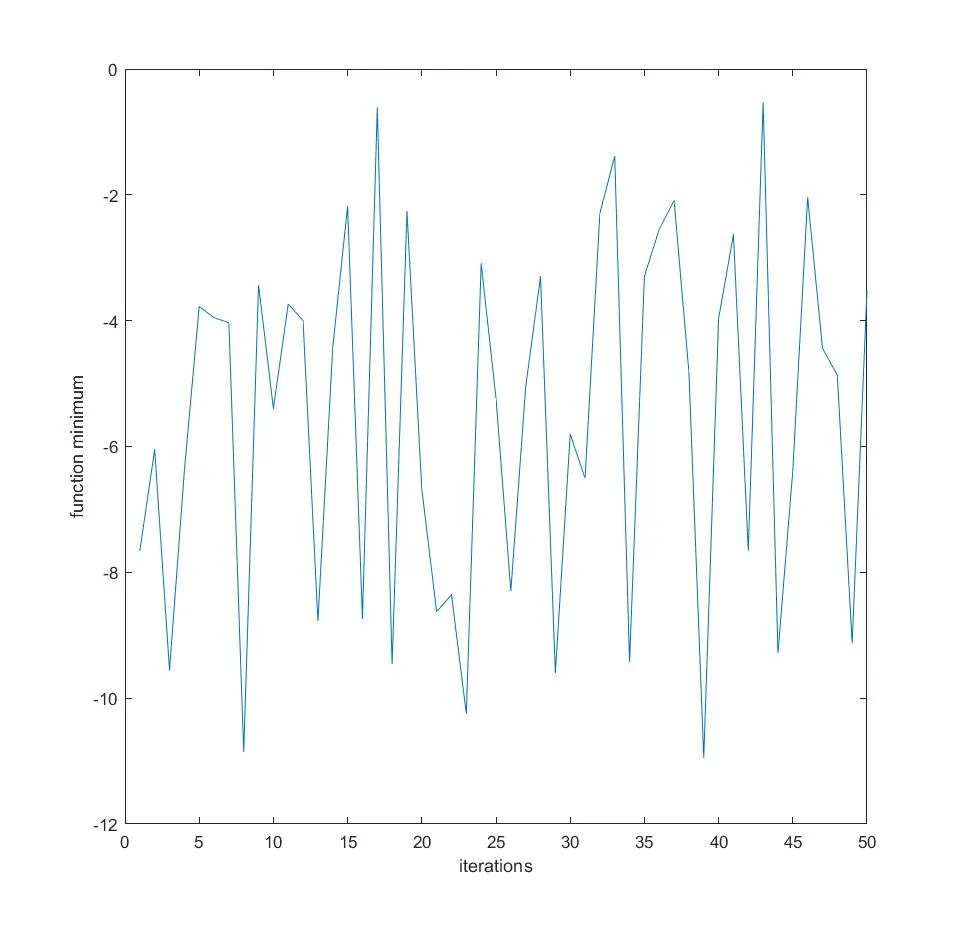
here the selected points go outside the defined range.its hard to finhd the minmum and maximum points.
Bounded inputs
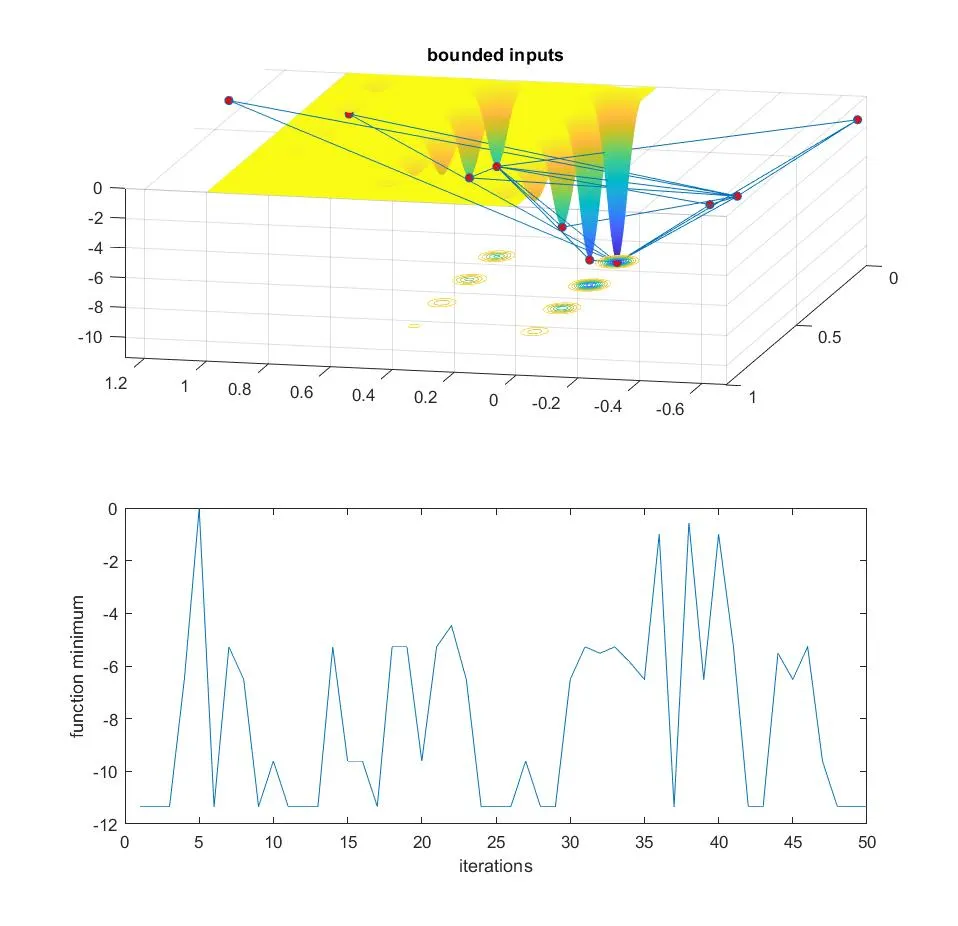
here the number of points outside the defined range are less.how ever the values are proper and all peak points are converged.
Bounded inputs with popilation strength
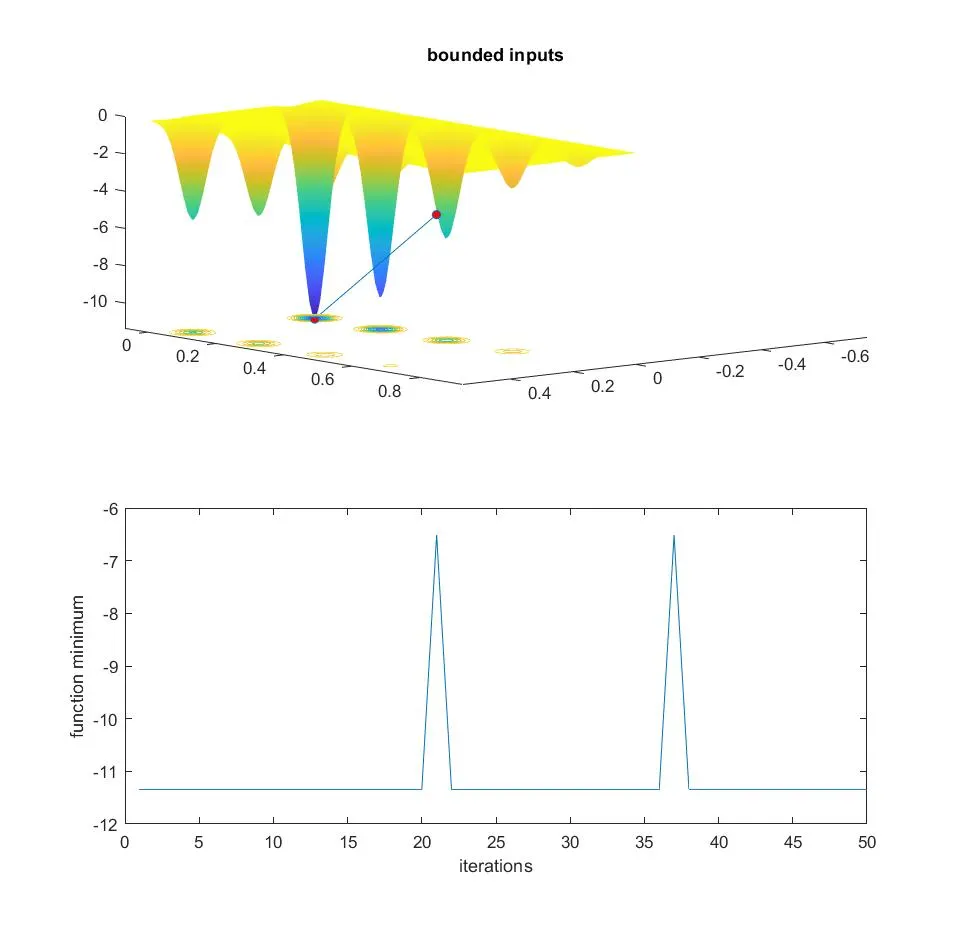
This program took more time to operate as the number of iterations are more.here we get accurate points and proper size. the peaks are high and its easy to find the minimum and maximum points.
ERRORS
Aa i got very minor errors am not presenting it.
PREFERENCES
Matlab,skilllync ebook