Week - 4
AIM
1 To Implement control logic of a washing machine using stateflow as per give sequence.
SEQUENCES
If the power supply is on system should work.
if water supply is not available the system should not work.
soaking time = 200sec, washing time = 100 sec, rinsing time = 20 sec and drying time = 50 sec.
After all process turn on LED.
PROCEDURE
Stateflow
state flow enables you to design and develop supervisory control, task scheduling, fault management, communication protocols, user interfaces, and hybrid systems.
Stateflow is a graphical diagram which solves state transition tables and flowcharts. by creating a stateflow diagram as per the given conditions is the solutiuon.
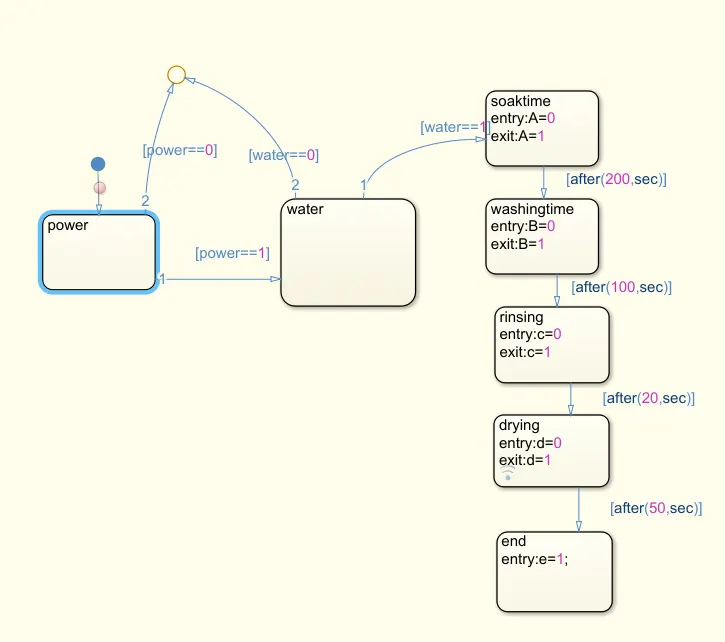
stateflow model for given sequences.
MODEL EXPLANATION
The model is built in such a way that firstly power input is given and by using condition statements if the power is on then goes to water block.
In water block it checks whether the input is on or off. ifthe input is on then goes to soaking or else its returned to the end as its given conditions.
Aa per the given timing for soaking,washing,rinsing and drying are done step by step.atlast for indicating the completion end is also provided.
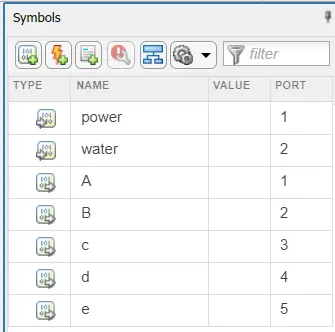
The output datas and input datas are sorted in the symbols.
FULL MODEL
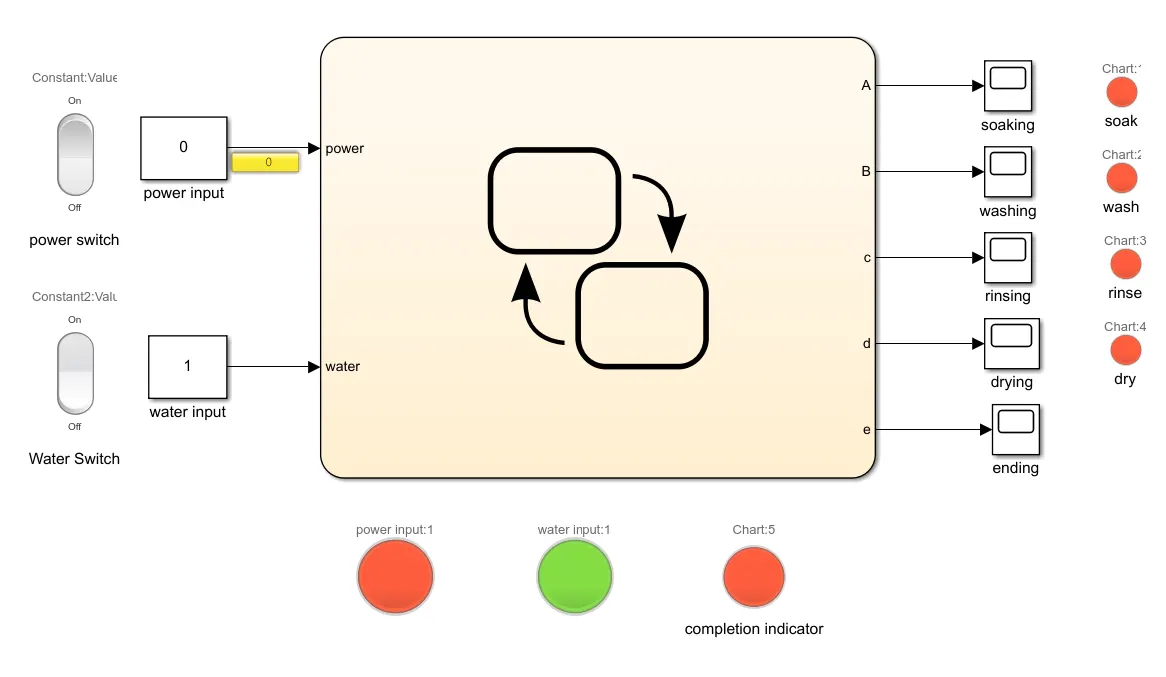
1. power and water is off.
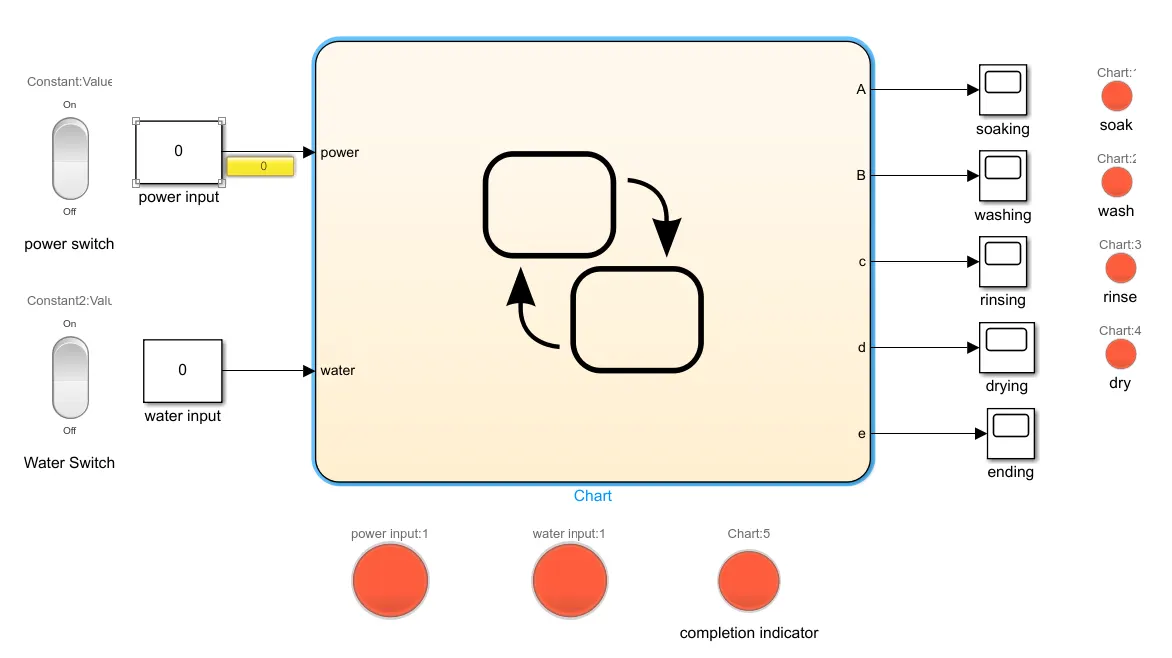
HERE In addition to the stateflow diagram power and water inputs are given by a rocker switch.
power input and water inputs are indicated by led indicators where red is off and green is on.
five scopes are connected to the output for each works.led indicators are also connected to output.
In this figure as both inputs are off hence all leds are red.
2. power on and water off.
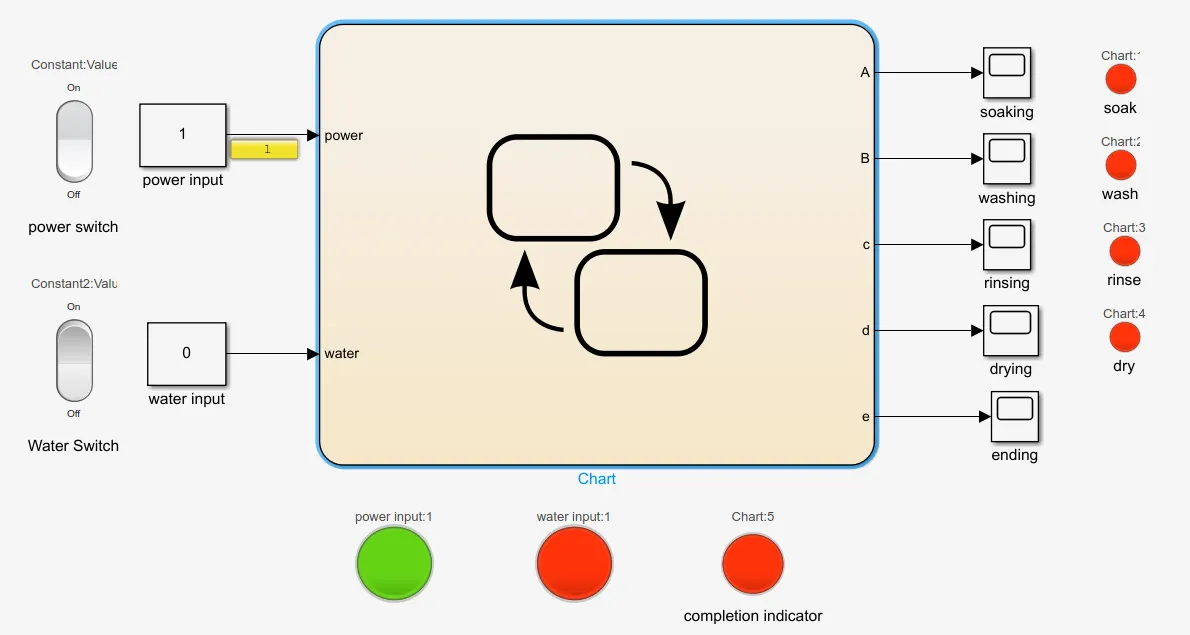
Here all indicators are off except the power indicator which on and system gets activated.
3. power off and water on
 +
+
here only the water is on so the machine doesnot works as per the given conditions. the non availability of water supply stops the process hence soaking indicator is also off and the process ends.
4. power on and water on
step1 after 200 seconds
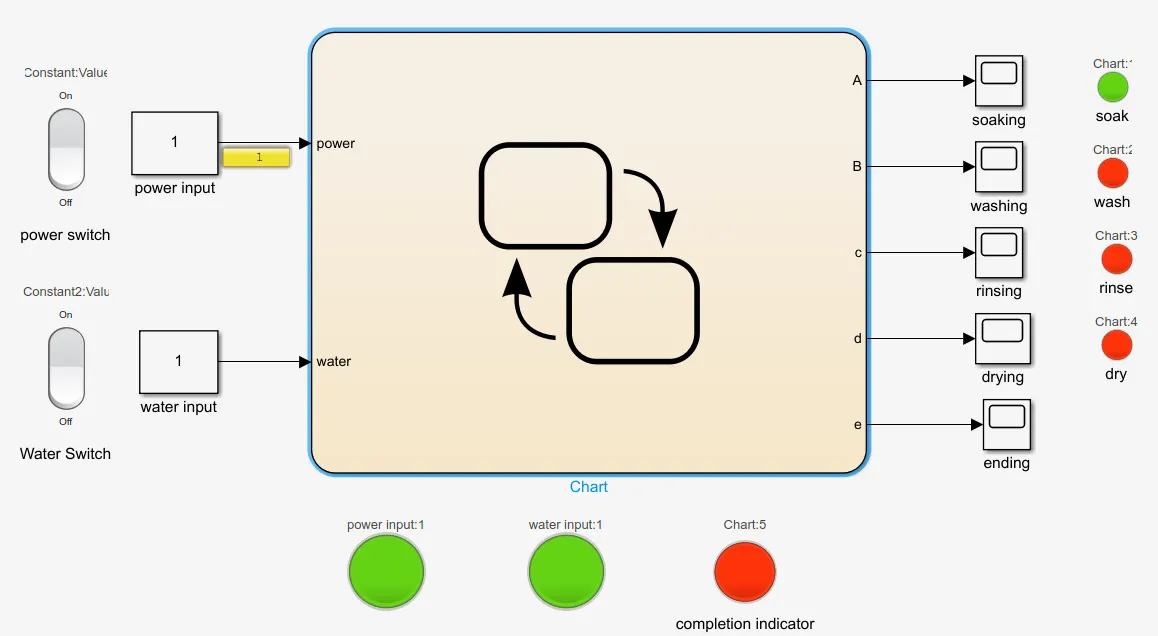
from this figure it is very clear that after 200 seconds the soaking is on and the very next process is going to start which is washing indicated by red led.
figure after whole process
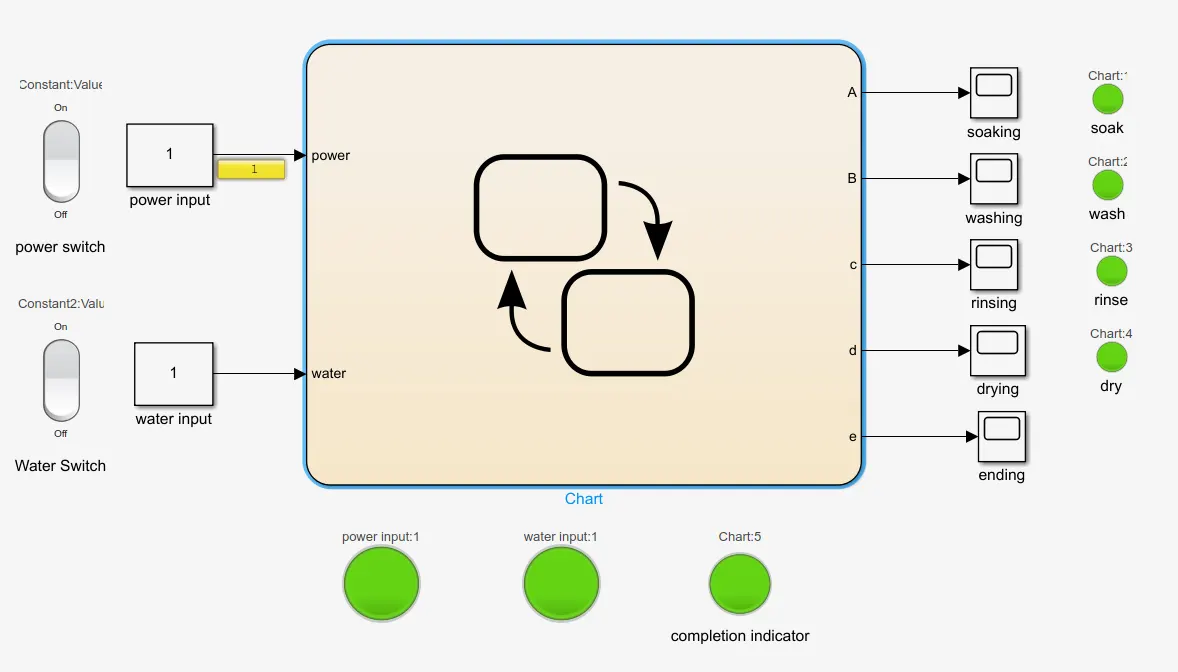
Here all the process are completed hence all the indicator led's are green.after all the completion indicator is also on.
AIM 2
To create a simulink chart for the gear shift logic as per the given conditions.
| speed range(km/hr) | gear |
| 0-15 | 1 |
| 16-25 | 2 |
| 26-40 | 3 |
| 41-60 | 4 |
| above 61 | 5 |
PROCEDURE
This gearshift chart can be made by stateflow chart in which state transitions are entered.
stateflow chart.
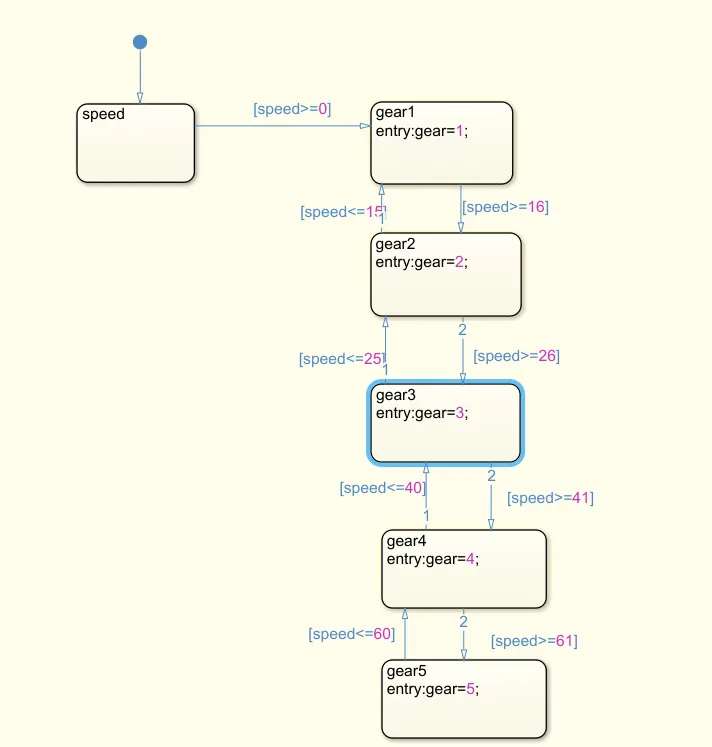
Here the flowchart is as simple as only the greater than or equal to conditions are only used
each blocks are built for each speed which refers each gears.
a flow to reverse direction is also made inorder to calculate gears while slowing down the speed.
entry:gear=3 code directly displays the gear for corresponding speed.
MODEL
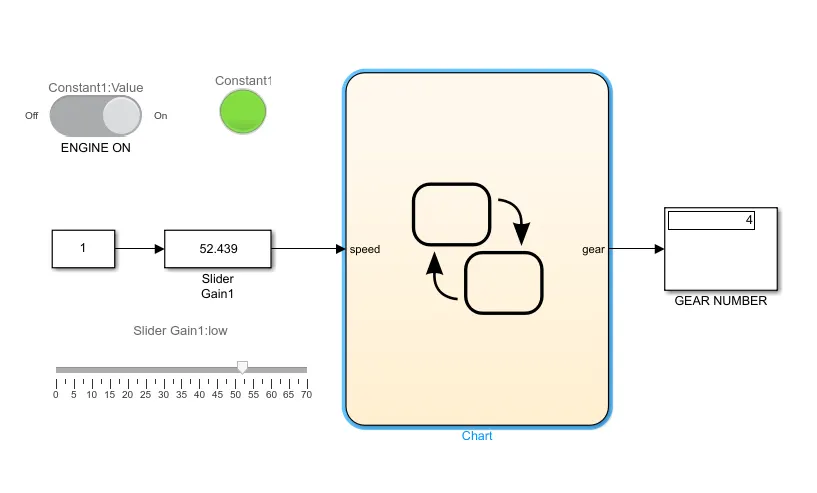
A slider gain is connected to the input for varying the speed while running.
a switch for engin on and a led indicator for indications
the output are shown as the gear number in the display.
here the speed is 52 and the respective gear 4 is shown in the output.
CONCLUSION
stateflow chart makes the work easier and practical.