Project 1 - Parsing NASA thermodynamic data
AIM
To Extract the coefficients of the polynomials of a given NASA Thermodynamic data.
To Evaluate Thermodynamic properties such as Enthalpy, Entropy and Specific Heat for all the species
To calculate molecular weight for every species and to plot cp,h,s for the temperature ranges
THEORY
File parsing
Parsing is the process of reading or analysing the strings of pariticular language or computer codes.
It can be also explained as breaking down of the data structures in to its component parts of speech with an explanation of the form.
NASA themodynamic file is analysed by programming which is a THERMO.dat file which contains the temperature ranges and 14 coefficients in each species to find entalpy entropy and specific heat.
The temperature ranges were split in to 300,1000 and 3500 as low temperature,mid temperature and high temperature respectively.
Specific heat (cp)
it is the amount of heat required to add to the one unit of mass of substance to increrase temperature by 1 degree celcius.
CP/R = a1 + a2*T^2 + a3*T^3 + a4*t^4
Enthalpy(H)
it is defined as the sum of systems internal energy and product of its pressure and volume
H/RT = a1 + a2 *T/2 + a3*T^2/3 + a4*T^3/4 + a5*T^4/5 + a6/T
Entropy(S)
it is the measure of a systems thermalenergy per unit temperature which is unavailable to do useful work. because work is obtained from a ordered molecular equation.
S/R = a1 lnT + a2 T + a3*T^2/2 + a4*T^3/3 + a5*T^4/4 + a7
here R = Universal gas constant
T = Temperature
Cp = Specific heat(KJ)
S = Entrtopy(KJ/mol-k)
H = Entalpy(KJ/mol)
a(i) = coefficients where i = 1:14.
The moloecular weight of each species are calculated by taking atomic weight of each elements.
PROCEDURE
NASA Thermodynamic datas are read by using fopen and fgetl commands
Splitting the temperatures and making it as low,mid and high temperatures.
By calculating the position of E the 14 coefficients of each species are found by using loop.
Finding values for entalpy,entropy and specific heat and plotting it.
Making each folders for every species and saving it seperately.
According to the atomic weight of each species molecular weights are calculated.
PROGRAM
clear all
close all
clc

file=fopen('thermo.dat','r');
%checking for the sign of file identifier
if file<0
    fprint('error occured since file cannot be negative. end./n')
end

heading=fgetl(file);

% converting global low mid and high temperatures as string
temperatue=fgetl(file);

%skipping the next three lines since its unwanted
fgetl(file);
fgetl(file);
fgetl(file);

temp=strsplit(temperatue,' ');  %getting tht global low, med and high as numbers
global_low_temp=str2num(temp{2});
global_mid_temp=str2num(temp{3});
global_high_temp=str2num(temp{4});


for i=1:53

%reading first linhje of species as string
line_1=fgetl(file);
s=strsplit(line_1,' ');
species_name=s{1};%getting species names
z=length(s);

% converting temperature values as numbers
local_low_temp=str2double(s{z-3});
local_mid_temp=str2double(s{z-2});
local_high_temp=str2double(s{z-1});

t1=local_low_temp;
t2=local_mid_temp;
t3=local_high_temp;

%a1 to a5 coefficients
%reading the second line
line_2=fgetl(file);
position_E=findstr(line_2,'E');
% creating a vector of 'E' index

a1=line_2(1:position_E(1)+3);
%calculating the position of to get a1 as string
a1=str2num(a1); %converting a1 to number and storing to a1.

a2=line_2(position_E(1)+4:position_E(2)+3);
a2=str2num(a2);

a3=line_2(position_E(2)+4:position_E(3)+3);
a3=str2num(a3);

a4=line_2(position_E(3)+4:position_E(4)+3);
a4=str2num(a4);

a5=line_2(position_E(4)+4:position_E(5)+3);
a5=str2num(a5);

% a6-a10 coefficients

line_3=fgetl(file)   % same as a1-a5 except now it is line 3 and coeff a6-a10
position_E=findstr(line_3,'E');

a6=line_3(1:position_E(1)+3);
a6=str2num(a6);

a7=line_3(position_E(1)+4:position_E(2)+3);
a7=str2num(a7);

a8=line_3(position_E(2)+4:position_E(3)+3);
a8=str2num(a8);

a9=line_3(position_E(3)+4:position_E(4)+3);
a9=str2num(a9);

a10=line_3(position_E(4)+4:position_E(5)+3);
a10=str2num(a10);

% a11-a14 coefficients

line_4=fgetl(file)
position_E=findstr(line_4,'E')

a11=line_4(1:position_E(1)+3);
a11=str2num(a11);

a12=line_4(position_E(1)+4:position_E(2)+3);
a12=str2num(a12);

a13=line_4(position_E(2)+4:position_E(3)+3);
a13=str2num(a13);

a14=line_4(position_E(3)+4:position_E(4)+3);
a14=str2num(a14);

% creaing a new folder with species name to store its plots
% builiding a folder to store the plots of species.
mkdir(species_name);
cd(species_name);

T = linspace(t1,t3,1000);
R=8.314;
for j=1:length(T)
    % a1-a7 ---> high temp coeff
    %comparing with m,id temperature
    if T(j)>t2

     %calculation of entalpy,entropy and specific heat.
    Cp=(a1+a2.*T+a3.*T.^2+a4.*T.^3+a5.*T.^4)*R;
    h=(a1+(a2.*T)/2+(a3.*T.^2)/3+(a4.*T.^3)/4+(a5.*T.^4)/5+(a6./T))*R.*T;
    s=(a1.*log(T)+a2.*T+(a3.*T.^2)/2+(a4.*T.^3)/3+(a5.*T.^4)/4+a7)*R;

    else  % low temp coeff
        Cp=(a8+a9.*T+a10.*T.^2+a11.*T.^3+a12.*T.^4)*R;     % calc of Cp, h and s
    h=(a8+(a9.*T)/2+(a10.*T.^2)/3+(a11.*T.^3)/4+(a12.*T.^4)/5+(a13./T))*R.*T;
    s=(a8.*log(T)+a9.*T+(a10.*T.^2)/2+(a11.*T.^3)/3+(a12.*T.^4)/4+a14)*R;
    end

end


 %plotting 3 graphs
    figure(1)   % heat vs Temp
    plot(T,Cp,'linewidth',3,'color','b');
    grid on
     title(species_name);
    ylabel('Specific heat,Cp(kJ/kgK)');
    xlabel('Temperature');

    figure(2)
    plot(T,h,'linewidth',3,'color','y');
    grid on
     title(species_name);
    ylabel('enthalpy,h(kJ/kgK)');  % enthalpy vs Temp
    xlabel('Temperature(K)');

    figure(3)
    plot(T,s,'linewidth',3,'color','k'); %entropy vs temp
    grid on
     title(species_name);
    ylabel('entropy,s(kJ/kgK)');
    xlabel('Temperature');

    %changing directory and saving the file
     %cd(['D:x',species_name]);
    saveas(1,'Enthalpy.png');
    saveas(2,'entropy.png');
    saveas(3,'sp_heat.png');
    cd ..

    %calculating molecular weights
    elements=['H','C','O','N','A']; % element names for comparison
    atomic_weight=[1 12 16 14 40]; % weight assigned for each element
    mol_wt=0;
    for k=1:length(species_name)
        for l=1:length(elements)
            if strcmp(species_name(k),elements(l))
%comparison of the chracters, and proceed if yes
                mol_wt=mol_wt+atomic_weight(l);
                position=l; %storing the position for reference outside loop
            end
        end
    end

    n=str2double(species_name(k));
    if n>1
        mol_wt= mol_wt+atomic_weight(position)*(n-1); % adding the extra atoms' weights
    end


   mol{i}=sprintf('Molecular weight of %s: %f ',species_name,mol_wt);
end
mol'  % to display all the molecular weights in cammand window
Program Expalanation
In the begining the file is opened by using fopen and stored to file then checks whether any fault in file opening if bychance any fault occurs then the system displays error occured.
heading = fgetl(file) is used to read the first line and stores to heading and next the temperatures are read and locates to temperature.
fgetl(file) is used 3 times inorder to skip the unwanted three lines.
temp = strsplit(temperature) for splitting the temperatures to three parts.
global_low_temp = str2num(temp{2}); here the strings are converted into numbers where the low,mid and high global temperatures are stored respectively.
now by using for loop for 53 times and line_1 = fgetl(file) where the first line of first species is read then s=strsplit(line_1) inorder to split the firstline to s.
species_name = s{1} where the name of species is stored and z=length(s) where the z value is untill the firstline finishes.
Now local_low_temp = str2double (s{z-3}) are written to convert string to double precision values are done for mid and high local temperatures respectively and stored to t1,t2 and t3 accordingly.
from here the first 5 coefficients are read by reading the second line.
position_E = findstr(line_2,'E') where the location of all the E in the second line are found.
a1 = line_2(1:position_E(1)+3) this code is the pivotal index of the program where the position of a1 is calculated to get as string
a1 = str2num(a1) here the a1 is converted to number and store in a1.
these 2 codes are used for upcoming a2,a3,a4 and a5 respectively by changing the E vector and position of next coefficients.
Now for reading a6 to a10 line 3 is read and position of E is found and stored as E vector.
a6=line3(1:position_E(1)+3); a6 =str2num(a6)
a7=line3(1:position_E(1)+4:position_E(2)+3)
where the a7 coefficients are taken by varying position_E(1)+4:positiom_E(2)+3 these values keeps varying for coming a7,a8 till a14.
For the upcoming line are read and a10 to a14 are found by using the steps above.
mkdir(species_name);cd(species_name); to create a new folder with species name to store its plots.
T = linspace(t1,t3,1000) where the temperature are splitted to 1000 times and R= 8.314 which is universal gas constant.
for j = 1:length(T) where the loop works till the temperature range here a1-a7 are high temperature coefficients and a7-a14 are low temperature coefficients
if T(J)>t2 then enthalpy,entropy and specific heat of high temperature coefficients are calculated else low temperature coefficients are calculated
The equation for enthalpy(H),Entropy(S),specific heat(Cp) are calculated by
H/RT = a1 + a2 *T/2 + a3*T^2/3 + a4*T^3/4 + a5*T^4/5 + a6/T
S/R = a1 lnT + a2 T + a3*T^2/2 + a4*T^3/3 + a5*T^4/4 + a7
CP/R = a1 + a2*T^2 + a3*T^3 + a4*t^4.
Next step is to plot the graphs where plot(T,cp);plot(T,s);plot(T,cP) are used and plotted respectively.
saveas(1,'Cp','jpg'); saveas(2,enthalpytemp','jpg'); and saveas(3,'entropytemp",jpg') are processed to change the directory and save the file.
the final aim is to calculate the molecular weight
elements = ['H','C','O','N','A'] which are the basic five elements are stored to elements and atomic_weight=[1 12 16 14 40] to assign weight for each element.
for k=1:length(species_name); for l=1:length(elements); where the loop is run in 2 limits of length of species name and length of elements.
mol_wt= 0 ; if strcmp(species_name(k),elements(l)) here the string comparison with species name and elements
if its true then mol_wt=mol_wt+atomic_weight(l); the molecular weight is added. position=l; for storing the position for rteference outside the loop.
n=str2double(species_name(k)); to store the double precision value of species_name to n.
if n>1 then mol_wt = mol_wt+atomic_weight(position)*(n-1) where the molecules which have more than one element are calculated here by adding the atomic weight of each element and storing it to to mol_wt.
mol{i} = sprintf('molecular weight of %s:%f',species_name,mol_wt) where the molecular weighjt of each molecules are printed
OUTPUT
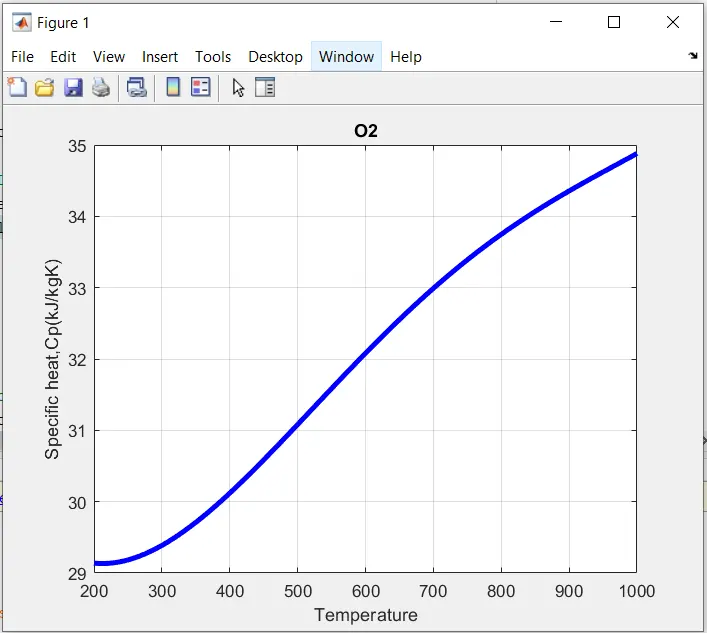
Graph plots of o2
Temperature vs specific heat
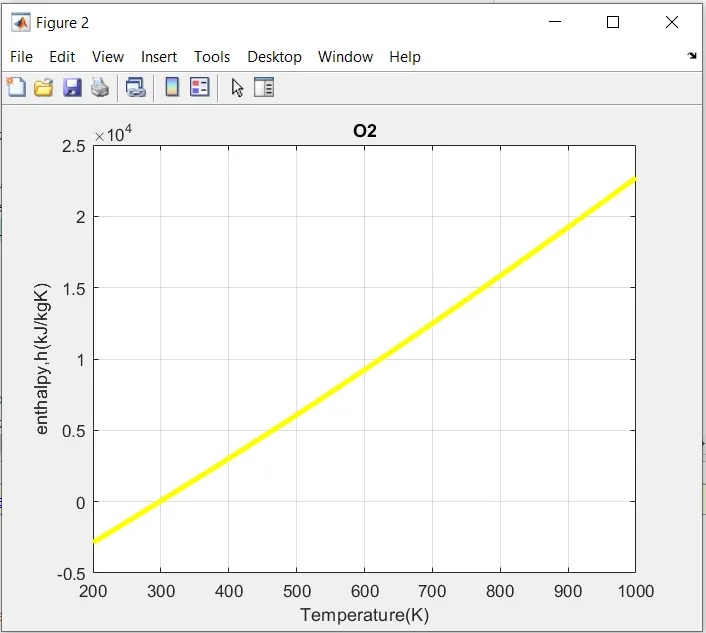
Temperature vs Enthalpy
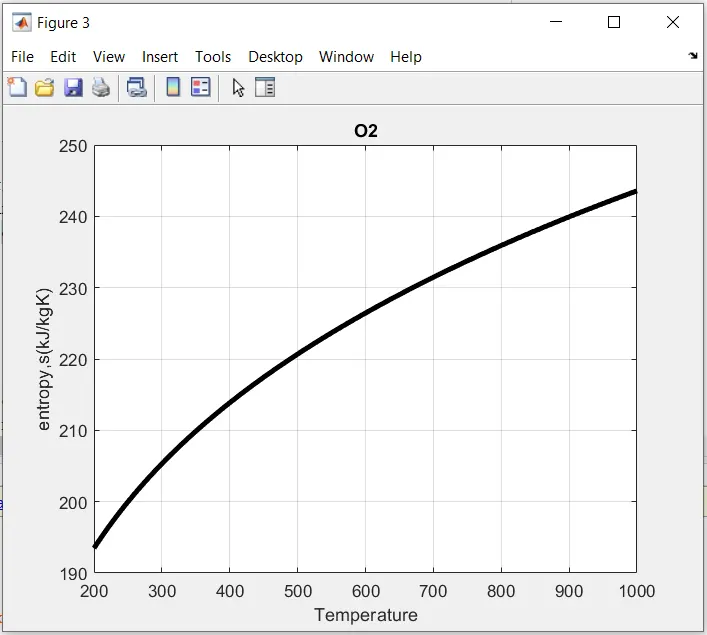
Temperature vs entropy
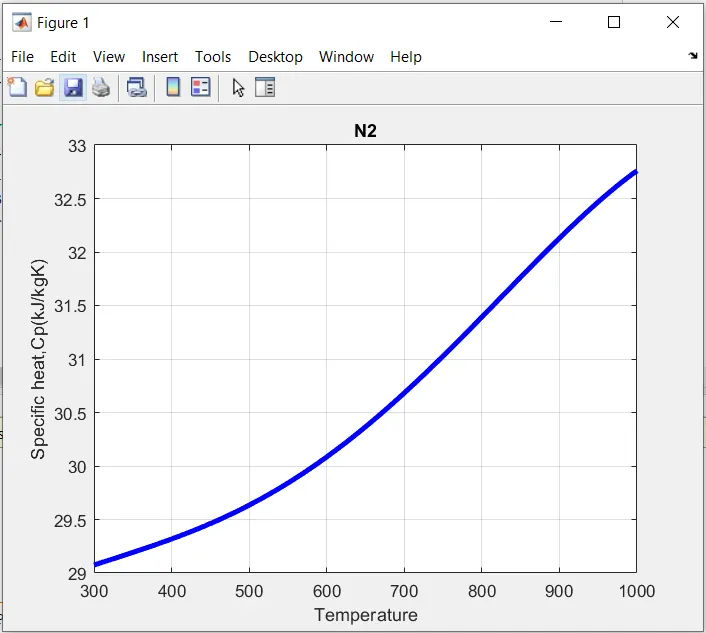
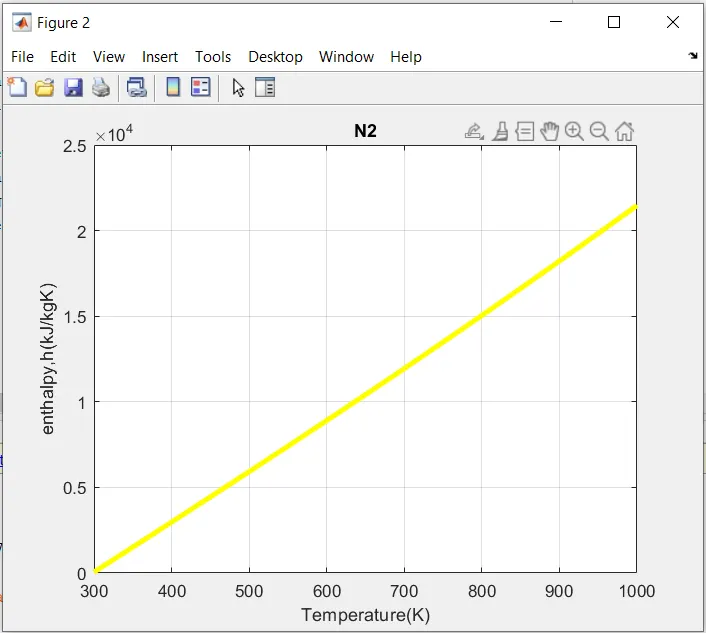
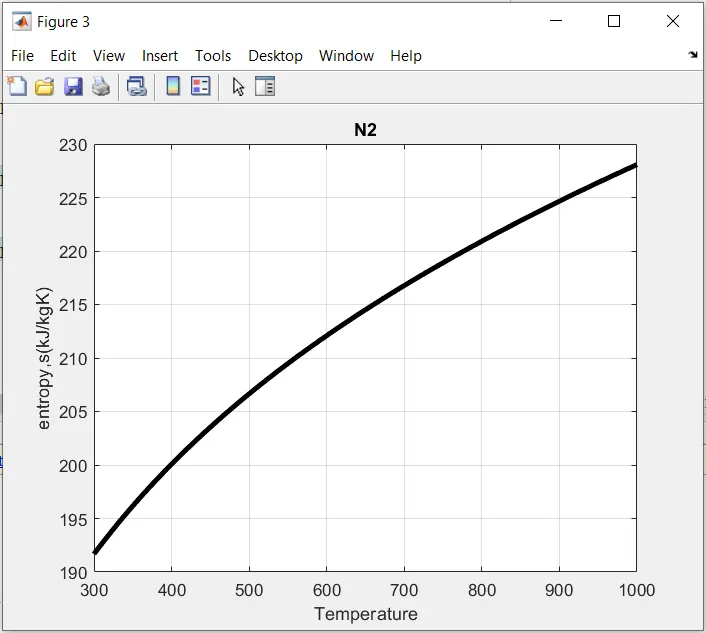
Graph for N2
Temperature vs specific heat plot
temperature vs enthalpy graph
temperature vs entropy graph
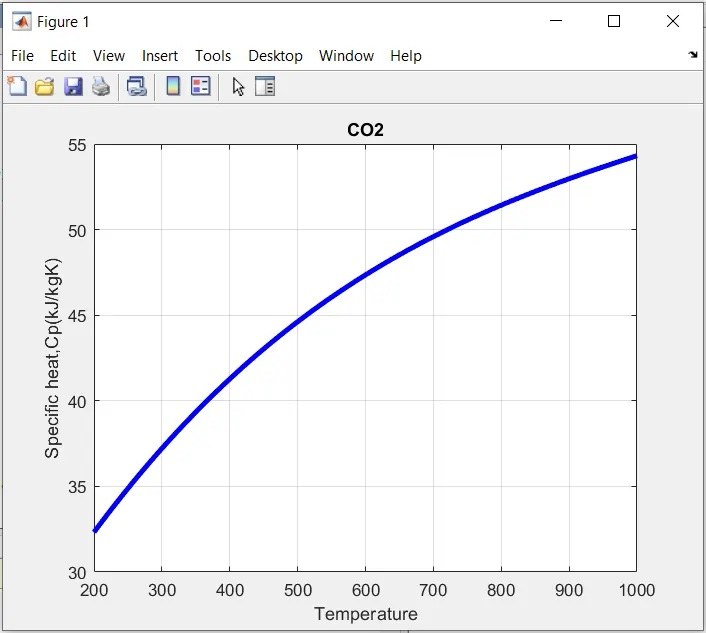
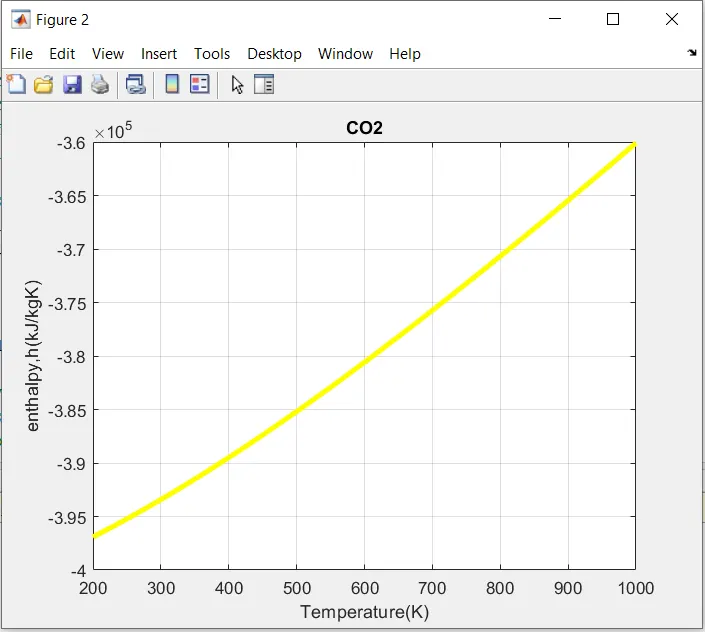
Graph for CO2
Temperature vs specific heat plot
Temperature vs entalpy plot
Temperature vs entropy plot
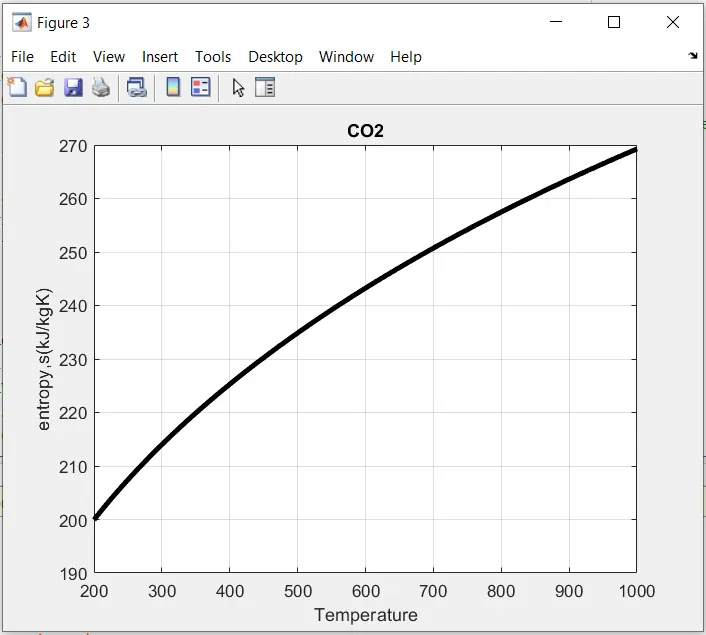
The output for enthalpy to temperature is a straight line that is its directly proportional to each other where as temperature vs entropy and temperature vs specific heat is curved line however its also proportional to each other for the species above.
Automatically Generated Folders for each Species

Folder for each and every species are created in the system by the MATLAB program.
MOLECULAR WEIGHT
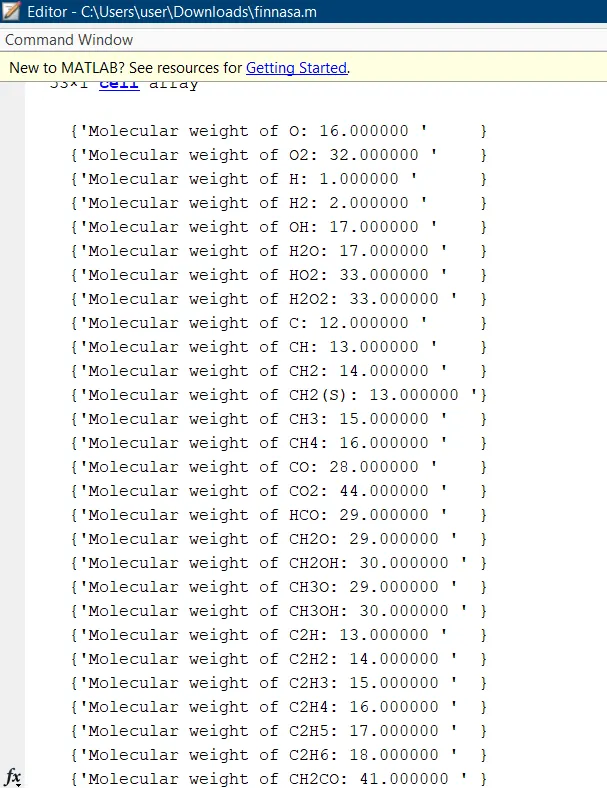
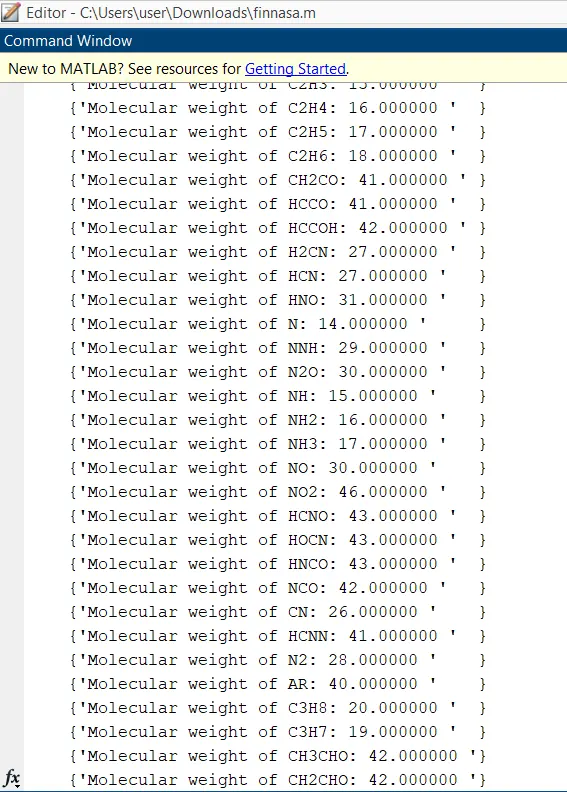
Molecular weight of each species are printed in command window.
Overall i have parsed the NASA thermodyanamic file and found enthalpy,entropy and specific heat and plotted it.
also found molkcular weight for each species and created each folders for every species.
ERRORS FACED
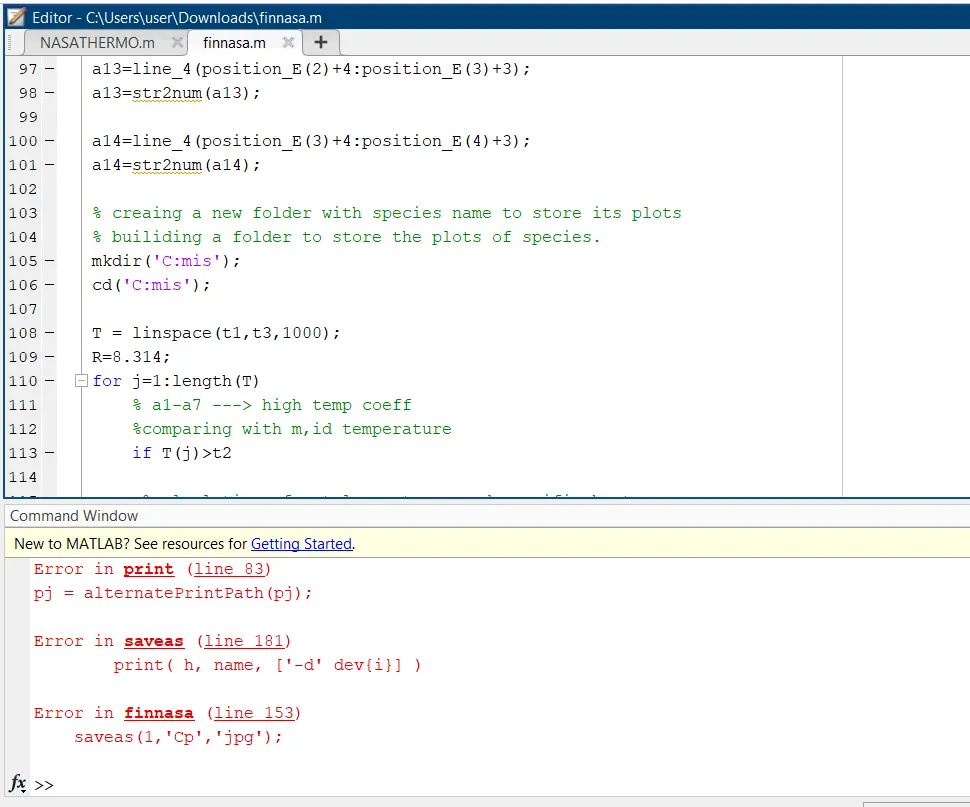
There was a problem with sacing the file then i changed the code from saveas(1,'h''jpg') to saveas(1,'enthalpy.png');
so that error was solved.
ERROR 2
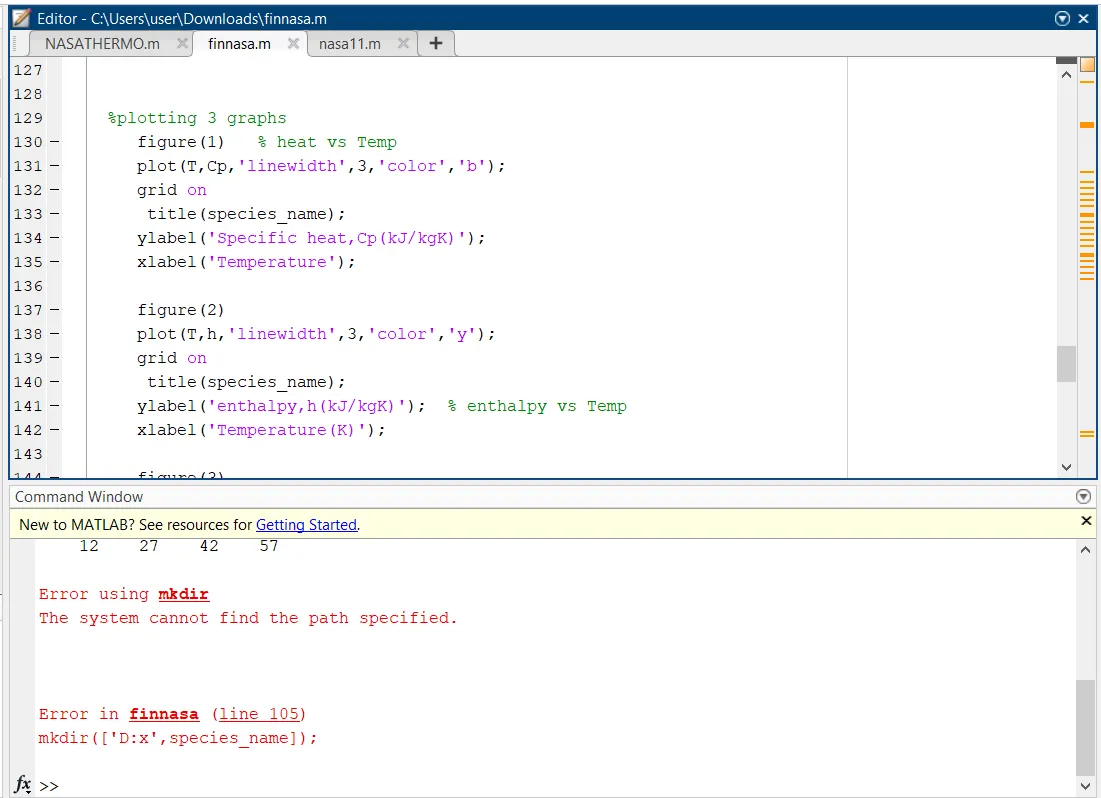
This was a mojor issue that i faced during the program then i changed the mkdir([D:x',species_name]) code to mkdir(species_name) and hence the problem was solved.
REFERENCES
www.mathworks.com , skilllync ebook.