Week - 4 - crash box simulation
Crash box Simulation
Aim
To simulate a crash box impact on a rigid wall.
Explanation / Case Setup
The setup of the .k file for simulation is as follows:
The geometric shape of the crashbox along with the meshing is initially provided.
Units
The units used for the simulation are gm/mm/ms
Material
Material is chosen using MAT and steel is modeled as elastic material for the crashbox using the following properties:
- Density (RO) = 0.00785
- Young’s Modulus (E) = 2.1e5
- Poisson’s Ratio (µ) = 0.3
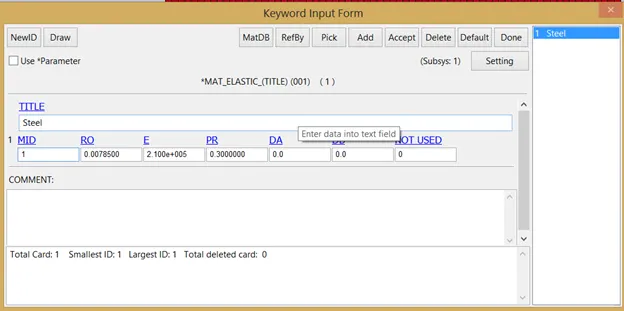
Figure 1 Steel modeled as Elastic material
Section
The section of the crashbox is modeled as shell, because crashbox is meshed with shell element.
The parameters utilized are shown in figure below.
- Thickness of shell element = 1.2 mm / 1.5 mm
- ELFORM = 2
- else is default
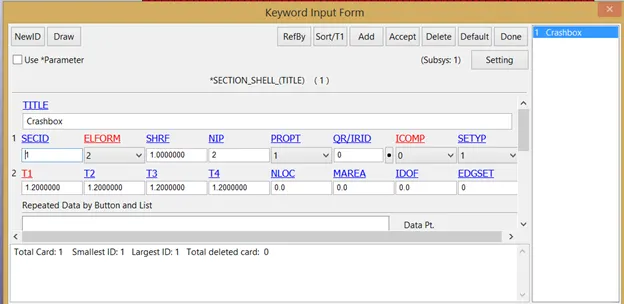
Figure 2 Shell formulation for crashbox elements
Hourglass
To avoid hourglass effect hourglass card is used with following parameters shown in figure
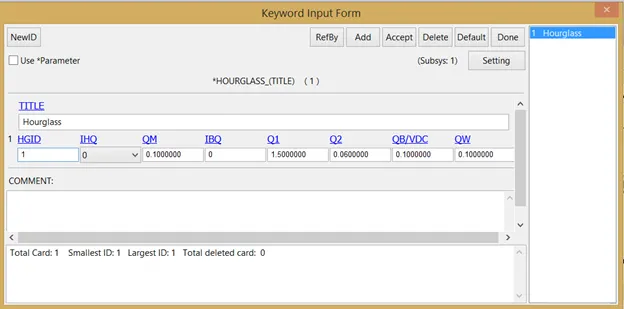
Figure 3 Hourglass card to counter hourglass effect
Part
Under this card, the part id is compiled with material properties, section details and hourglass parameters as shown in figure:
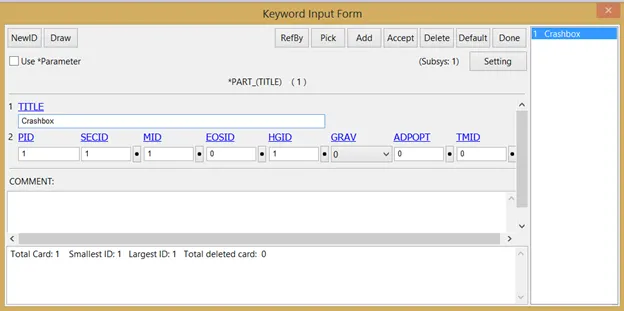
Figure 4 Part card for compilation of properties into Part
Boundary
Using Prescribed_Motion_Set under the Boundary card, the initial velocity in X direction is provided to the end nodes along the cross section of the crashbox.
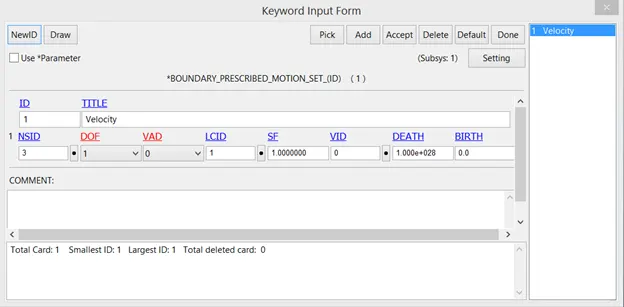
Figure 5 Motion card for end nodes of crashbox
- NSID specifies the node set subjected to motion
- DOF =1, defines motion in x direction
- VAD =0, defines value input for motion as velocity
- LCID defines the velocity vs time plot
- SF defines the scale factor for velocity output.
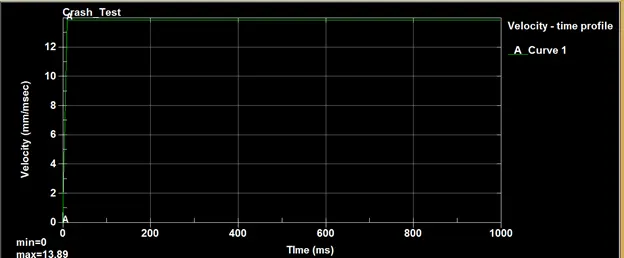
Figure 6 velocity vs time plot (LCID)
Rigidwall
Rigidwall is modeled with Rigidwall_Planar card with following parameters and the normal of the Rigidwall is opposite to the direction of motion of crashbox.
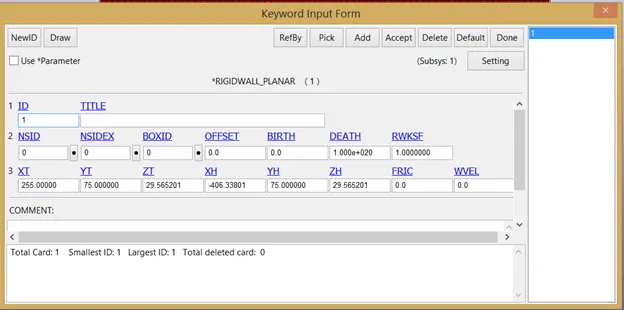
Figure 7 Planar Rigidwall with given parameters
Contact
Contact between crashbox and rigidwall is automatically taken care of with the Rigidwall_Planar card. However the self-contact of crashbox is defined using AUTOMATIC_SINGLE_SURFACE card with parameters defined in the figure below:
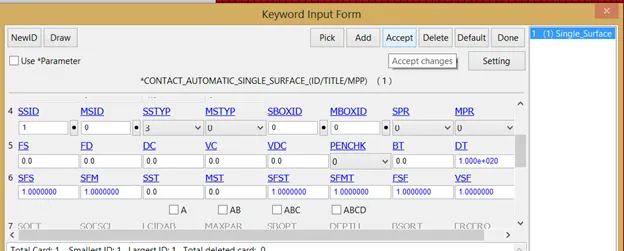
Figure 8 Contact_Automatic _Single_Surface card
Crashbox is input as slave part under SSID and the rest is considered as default.
Control
Two control cards are defined for the simulation:
Control_Termination
It defines termination time for the simulation, and is input as 200.
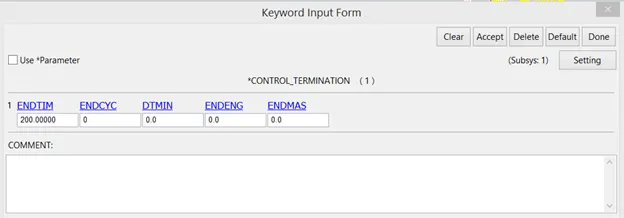
Figure 9 Termination time for simulation
Control Energy
It defines the energy modes to be incorporated in GLSTAT and MATSUM. For the simulation, energies incorporated are:
- HOURGLASS ENERGY (HGEN)
- STONEWALL ENERGY (RWEN)
- SLIDING INTERFACE ENERGY (SLNTEN)
- RAYLEIGH ENERGY (RYLEN)
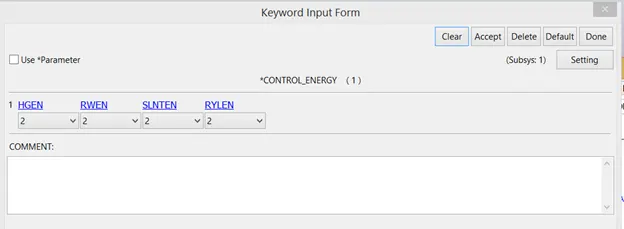
Figure 10 includes various energies in calculation using CONTROL_ENERGY
Database
This card provides output data for post processing.
Various Sub cards used under this category are
- BINARY_D3PLOT
- ASCII_GLSTAT
- ASCII_SECFORCE
- ASCII_NODOUT
- ASCII_RCFORC
- ASCII_SLEOUT
- CROSS_SECTION_SET
- HISTORY_NODE
- Extent_Binary
Time interval between outputs (DT) is taken as 0.1 ms.
Here Cross Section Set is defined for defining the nodes for calculating cross sectional force using ASCII_SECFORCE generated in the middle of the crashbox (along its length).
History Node is used to specify the selected node in NODOUT for nodal acceleration.
GLSTAT is used to plot the energies involved in the system.
D3PLOT is used to animate the simulation.
Extent_Binary Card is used to call the strain tensor values.
Results
The following deliverables are considered in the results section:
- Cross-sectional force generated in the middle of the crashbox (along its length)
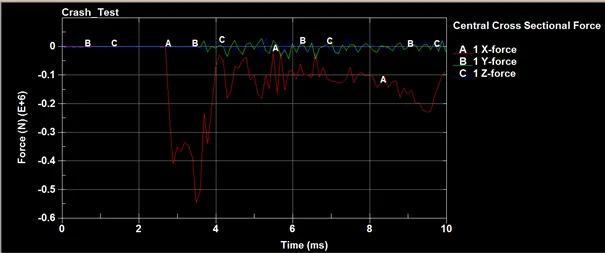
Figure 11 Central Cross sectional forces for thickness (t=1.2) mm
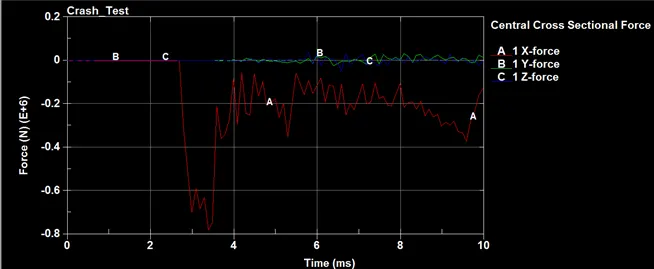
Figure 12 Central cross sectional force for thickness (t=1.5) mm
In the above figures, the plots for Cross sectional forces for different shell thicknesses i.e. t=1.2 and t=1.5 mm are shown. The cross section considered is at center, along the length of the crashbox, and the forces considered at the cross section are along the length of the crashbox (x-direction) and y & z directions.
From the plots, it can be concluded that the x-directional force (along the length of the crashbox) is dominant and is compressive in nature.
Also for larger shell thickness (t=1.5 mm), the magnitude of x-directional force is larger in comparison to corresponding force for shell thickness (t) = 1.2 mm.
- Acceleration plot of a node in the middle of the crashbox (along its length)
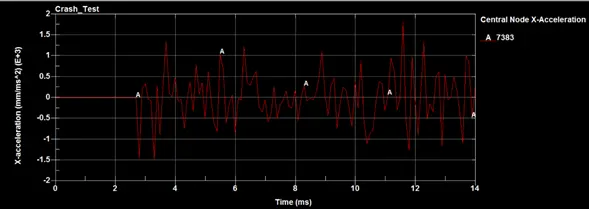
Figure 13 Central node X-acceleration for t=1.2 mm
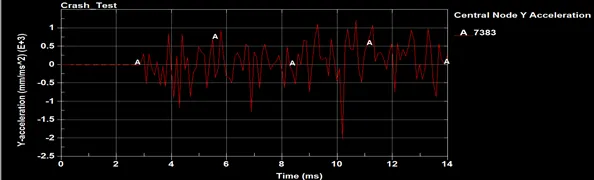
Figure 14 Central node Y-acceleration for t=1.2 mm
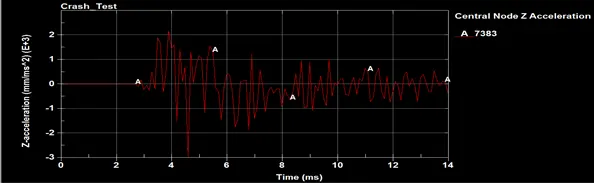
Figure 15 Central node Z-acceleration for t=1.2 mm
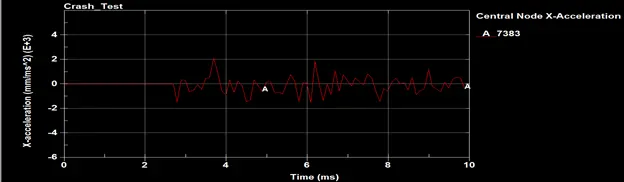
Figure 16 Central Node X- acceleration for t=1.5 mm
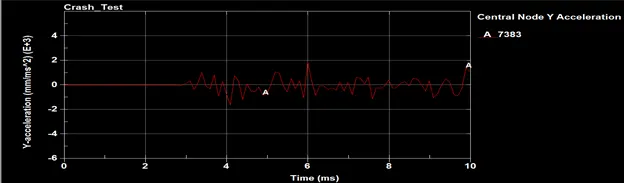
Figure 17 Central node Y- acceleration for t=1.5 mm
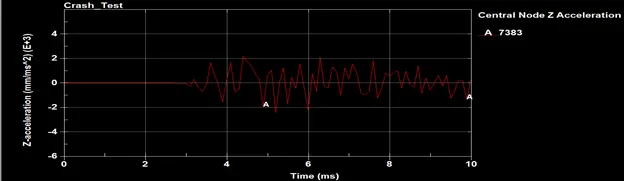
Figure 18 Central node Z-acceleration for t=1.5 mm
The acceleration plots show very high acceleration values after the impact of the crashbox with the rigid wall, and the magnitude of acceleration in all directions and all thicknesses is of comparable magnitude.
- Stress and strain in an element
Element no. 7734 is selected from the crashbox shell for computation of stresses and strains as shown in figure, the element no. 7734 is at the corner edge of the crashbox and is on the side of impact of crashbox with the wall.
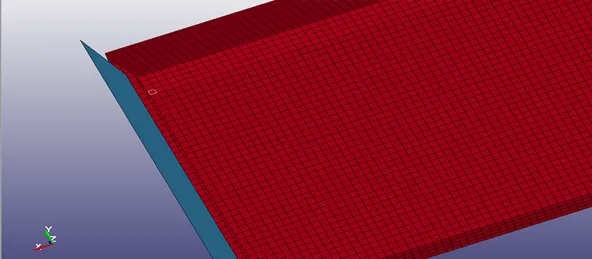
Figure 19 the highlighted element is element no. 7734
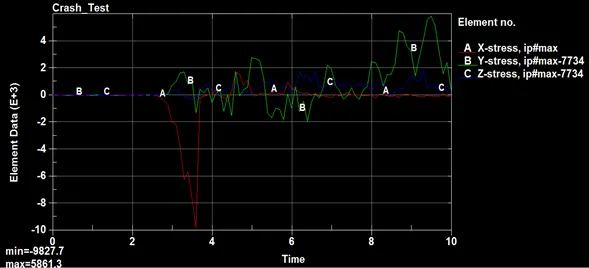
Figure 20 Stress for element no. 7734 for t=1.2 mm
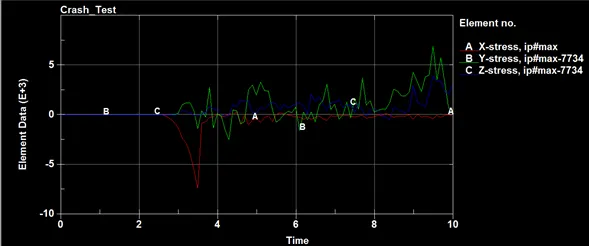
Figure 21 Stress for element no. 7734 for t=1.5 mm
The magnitude of x-directional stress in both cases rises abruptly after impact, however for t=1.2 mm, the magnitude of x-directional stress is slightly higher than the corresponding x-directional stress for t=1.5 mm.
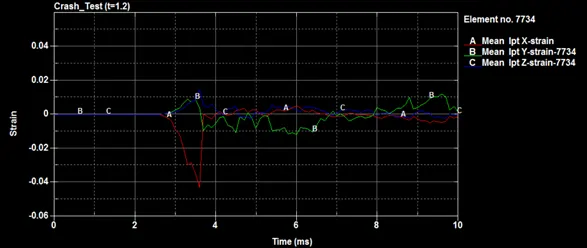
Figure 22 Strain plot for element no. 7734 for thickness (t) = 1.2 mm
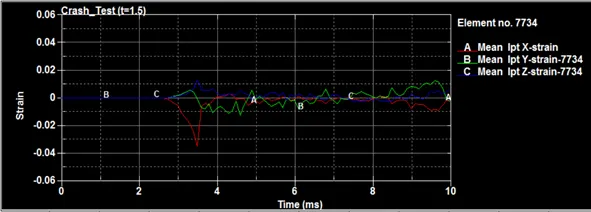
Figure 23 Strain plot for element no. 7734 for thickness (t) = 1.5 mm
From the strain figures it can be cross checked that negative strain in x-direction (along length of the crashbox) increases rapidly after during initial moments of crash. Also elemental strain values for t=1.2 mm are higher than the corresponding elemental strain values for t=1.5 mm, due to the higher elemental stresses for t=1.2 mm.
- Plot of all energies (total, internal, kinetic, hourglass, sliding)
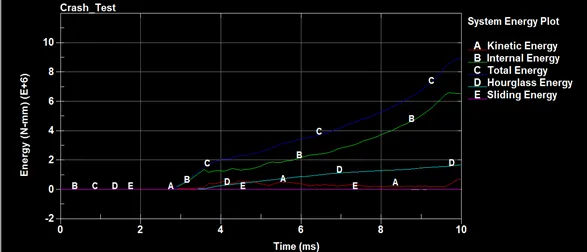
Figure 24 Energy plots for thickness (t) = 1.2 mm
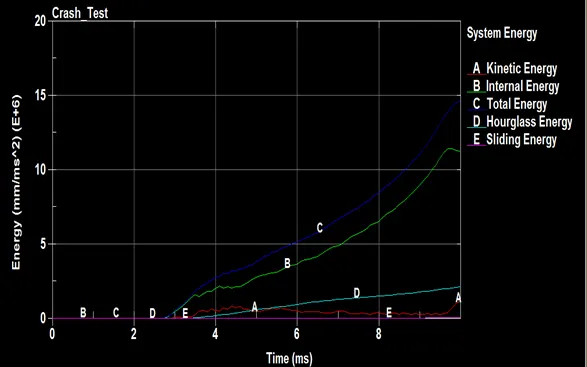
Figure 25 Energy plots for thickness (t) = 1.5 mm
The energy plots show that internal, hourglass and sliding interface energies have increased healthily after the impact for both t=1.2 and t=1.5 mm, as shown in the above plots.
- Animation
Conclusion
The animation of D3PLOT files shows the crashing of crashbox into rigidwall, so as to distort enormously and leading to self-contact, however in the later stages of the animation, the crashbox distorts unrealistically (probably due to instability in the explicit solution in later stages).