Week-4 Challenge WOT Condition Part-2
Task-1
Difference between Mapped and Dynamic model of Engine:
- Mapped model uses that macro statistics and mostly run the simulation based on data presented in lookup tables. It needs less time to simulation compared to dynamic model. Efficiency of components for near-instantaneous prediction of fuel consumption and performance.
- Dynamic model uses the detailed experiments and analyse the individual engine components level data. It needs more time to simulation and simulator perform detailed sub-second transient simulation for detailed experiment and analyse performance.
Difference between Motor and Generator:
- Motor is an electric source to drive the wheels. Which consumes the battery power and output mechanical power to run the vehicle wheels.
- Generator is a one of the source to powerup/charge the battery system. In EV type, motor act as generator in re-generative braking. In HEV type, When engine drive the vehicle, the excess power is diverted/ convert to generator and then to charge battery system.
How to change model type:
Initially engine is in mapped model :
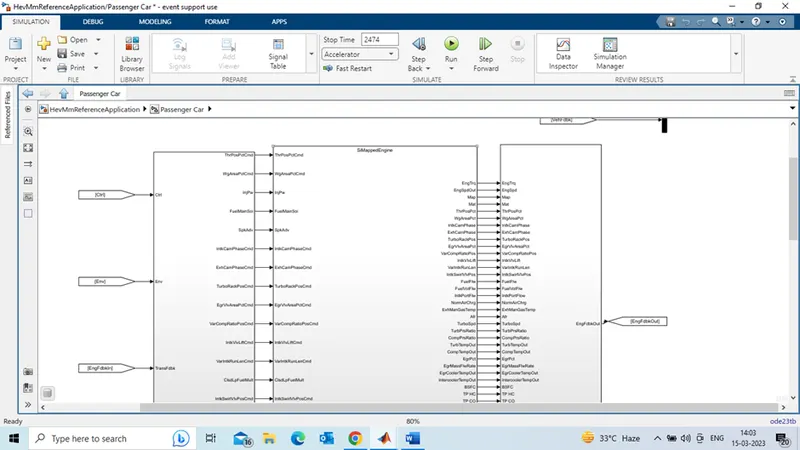
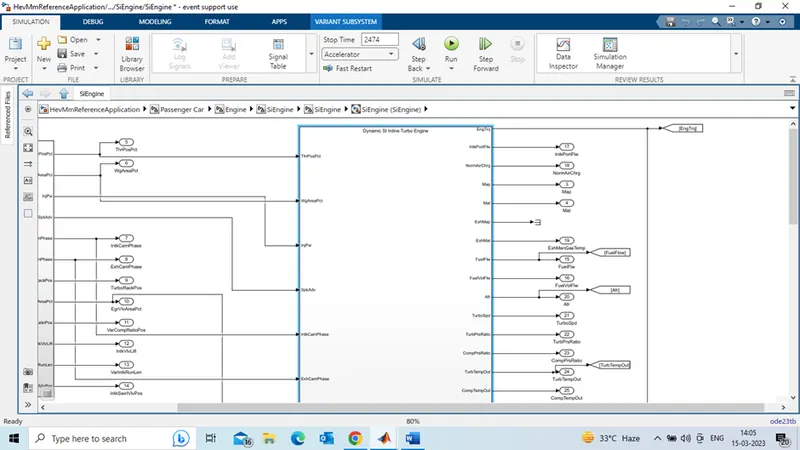
Below step shows change simappedEngine model to siEngine (dynamic engine) model


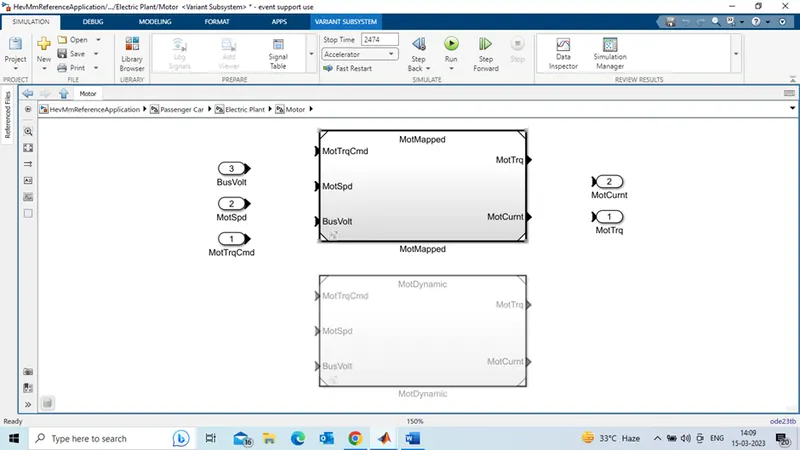
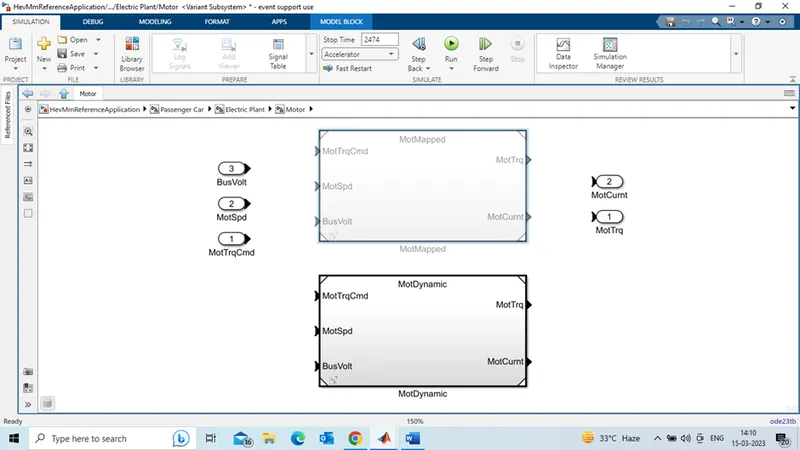
motor mapped model change to motor dynamic model:
In below Attachment, Motor mapped model is selected one initially. Which is highlighted in thick black colour.
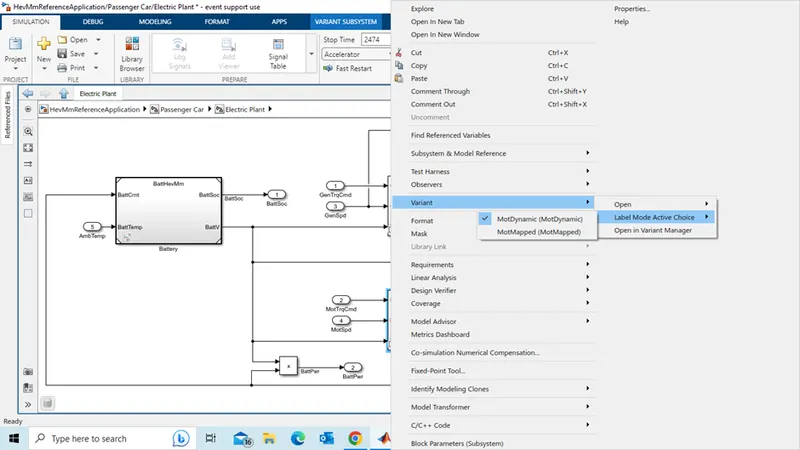
In below Attachment, Motor mapped model is changed to motor dynamic model. Which is highlighted in thick black colour.
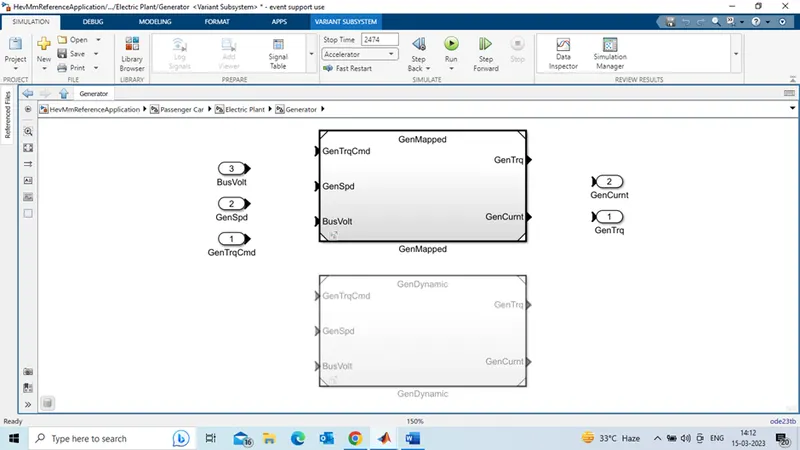
Generator mapped model change to Generator dynamic model:
In below Attachment, generator mapped model is selected one initially. Which is highlighted in thick black colour.

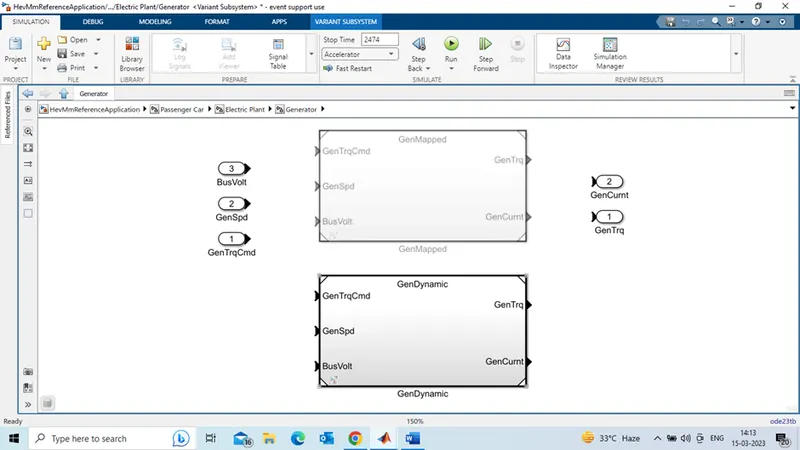
In below Attachment, generator mapped model is Changed to generator dynamic model. Which is highlighted in thick black colour.
Task-2
Model to calculate Miles per Gallon
In HEV reference model --->Visualization ---> Performance calculation
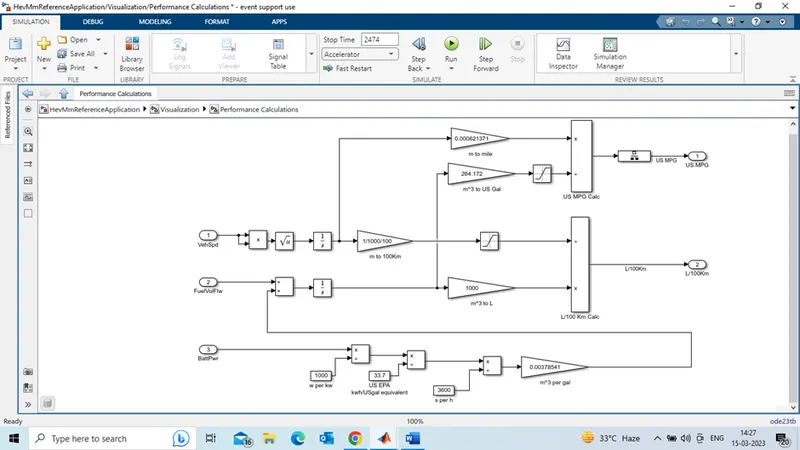
From Above Attachment, Miles per Gallon is calculated from Vehicle speed in meters converted to miles and Fuel flow in M^3 converted to Gallon. Both are product and get Miles per Gallon.
Factors to be consider for model fuel flow:
- Battery power (In above shows that battery power gives feedback signal to model fuel flow)
- Vehicle speed (In above shows that vehicle speed in Km gives signal to model fuel flow)
Task-3
HEV reference Application with WOT drive cycle:
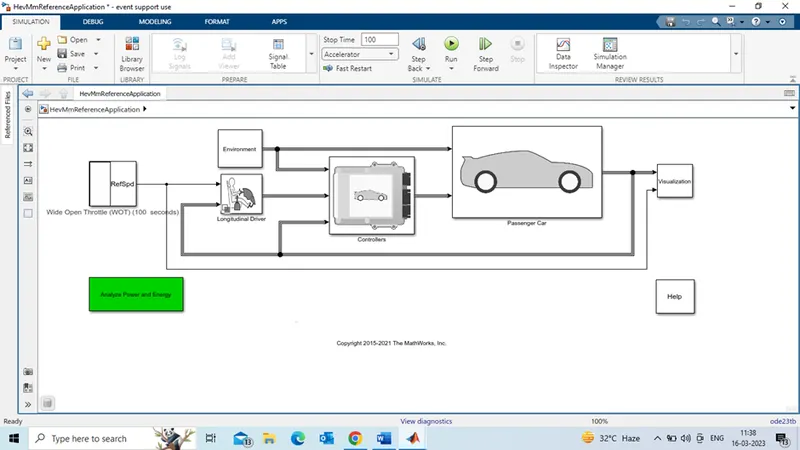
WOT Parameters:
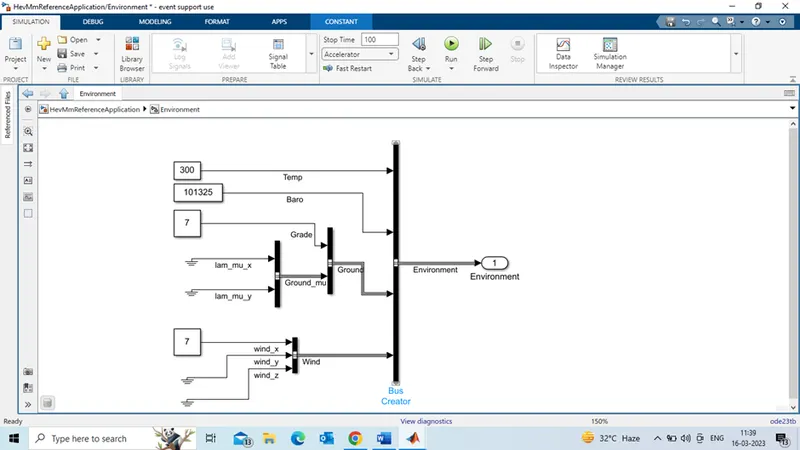
Consider start time 1sec and reference speed 50 m/s, time to start deceleration is 60 sec and simulation time is 100 sec.

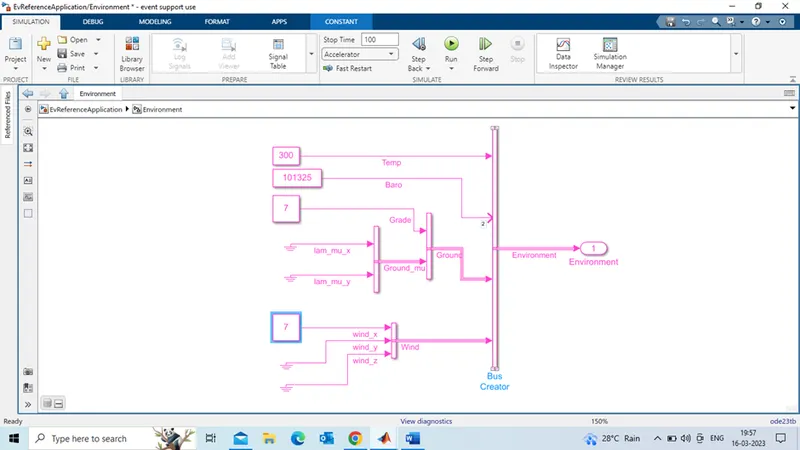
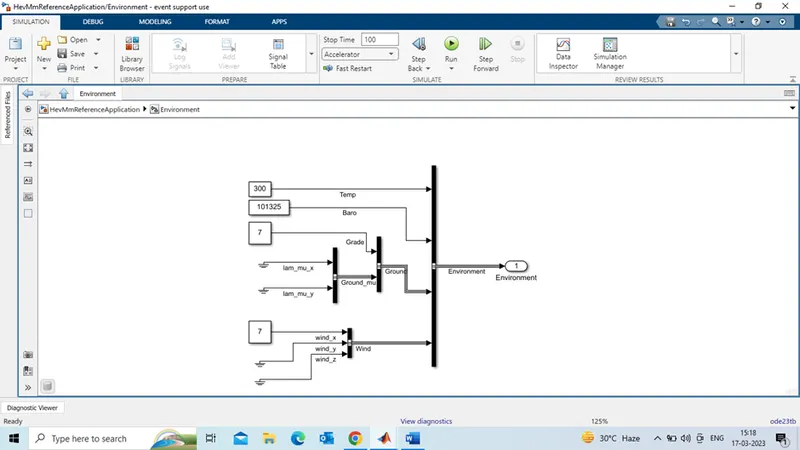
Consider 7% gradeability and 7 m/s Wind velocity in Environmental block.
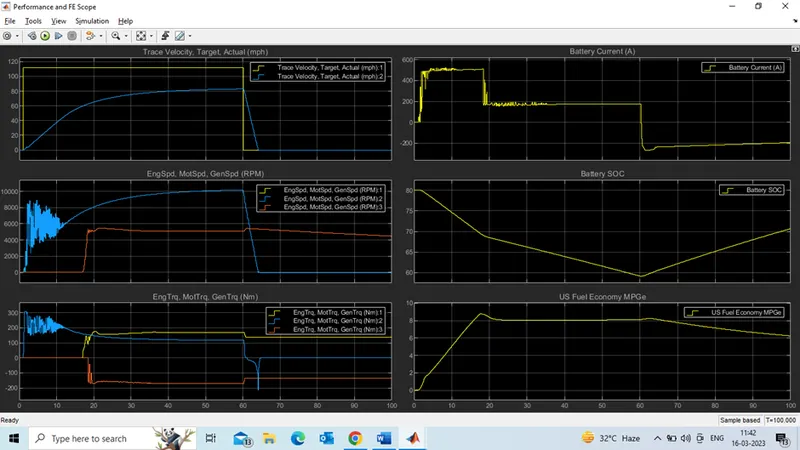
OUTPUT:
Comments:
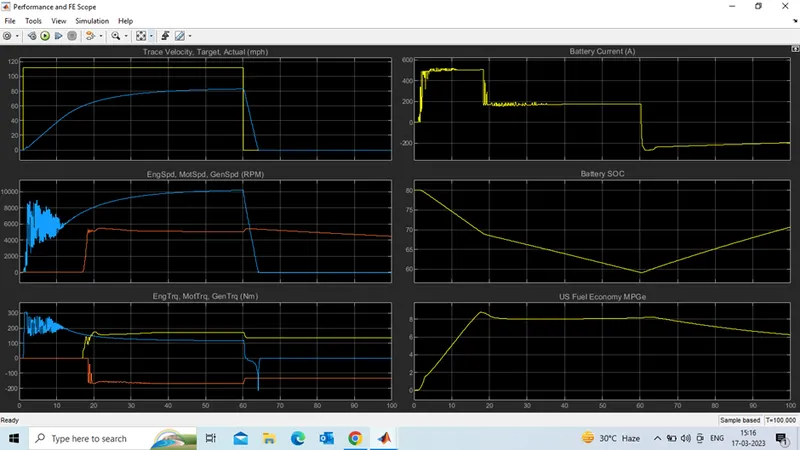
From the above results, Vehicle reaches to maximum velocity 80 mph in 60 sec. the required velocity is 110 mph. vehicle can’t reach the required speed due to limitation in vehicle power.
We Know, Speed of the vehicle decreases by increasing gradeability and also we increases the air drag or wind velocity.
We can observe that, Battery current reaches maximum to 500 Amps from(01 sec to 19 sec) at that point vehicle reaches nearer to maximum constant speed. And after vehicle start to deceleration battery current reaches to maximum negative value(-220 Amps). Which is in re-generative braking condition. Battery goes to charge mode.
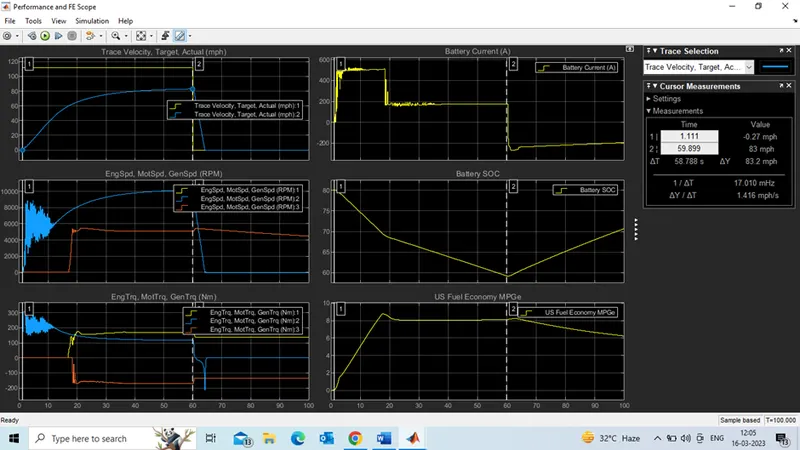
Attachment-1
Attachment-2
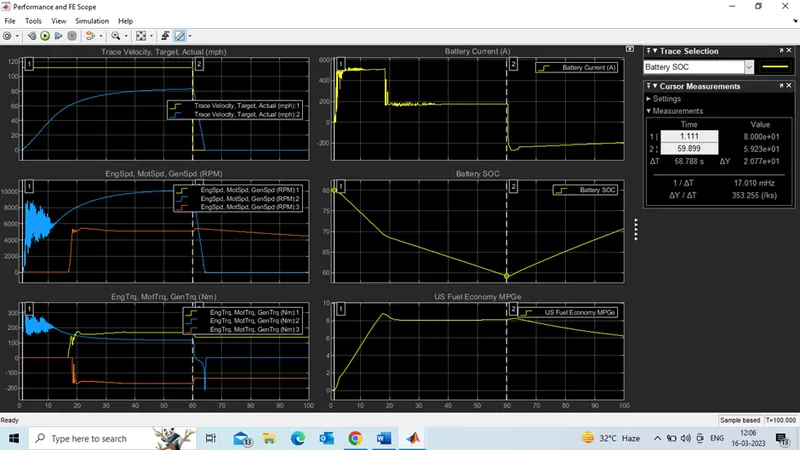
From the attachment -1, Vehicle reaches to its Maximum speed – 83 mph with WOT in 58.7 sec.
From the attachment -2, Vehicle consumes SOC -20.7 % in 58.7 sec. After vehicle starts deceleration (after 60 sec) SOC Increases (due to regenerative braking).
We can observe the Fuel economy MpG: From 1sec to 19 sec fuel economy efficiency is ~90 %. After 19 sec Engine starts and Effect on fuel economy efficiency reduces to 80 %. (At these point Battery current consumption also decreases due to engine start). After 60 sec vehicle goes to deceleration, then engine only running. So fuel economy decreases. Battery charging from both Engine and re-generative braking).
TASK-4
EV MODEL: Consider WOT drive cycle.
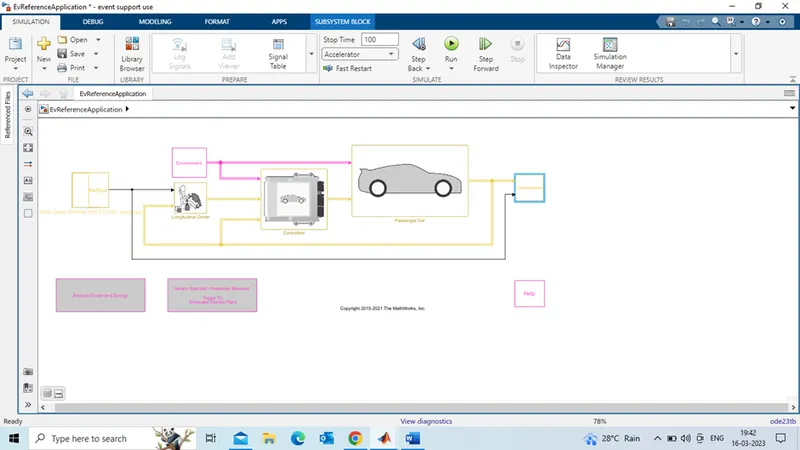
WOT Parameters:
Consider start time 1sec and reference speed 50 m/s, time to start deceleration is 60 sec and simulation time is 100 sec.
Consider gradeability 7%, wind velocity 7 m/s and keeping all other parameters same.
OUTPUT:
HEV model: Consider WOT drive cycle
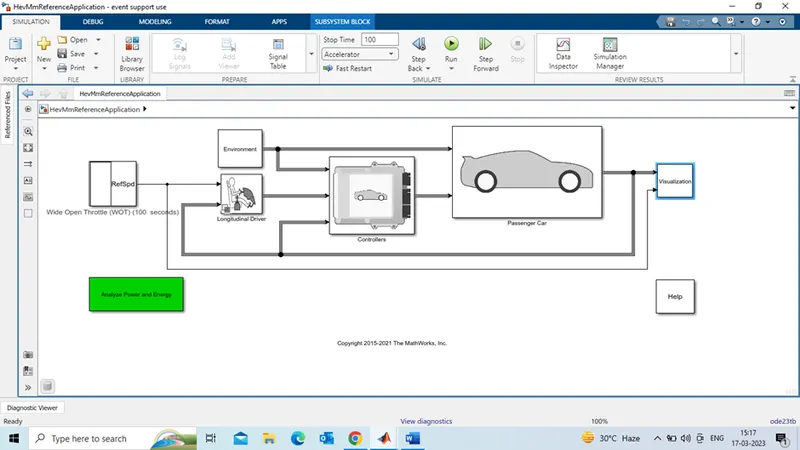
WOT Parameters:
Consider start time 1sec and reference speed 50 m/s, time to start deceleration is 60 sec and simulation time is 100 sec.
Consider gradeability 7%, wind velocity 7 m/s and Keeping all other parameters same.
OUTPUT:
Here, I am Simulated EV reference model and HEV reference model. Which results are shown above.
Comparision:
Comparison of velocity (mph):
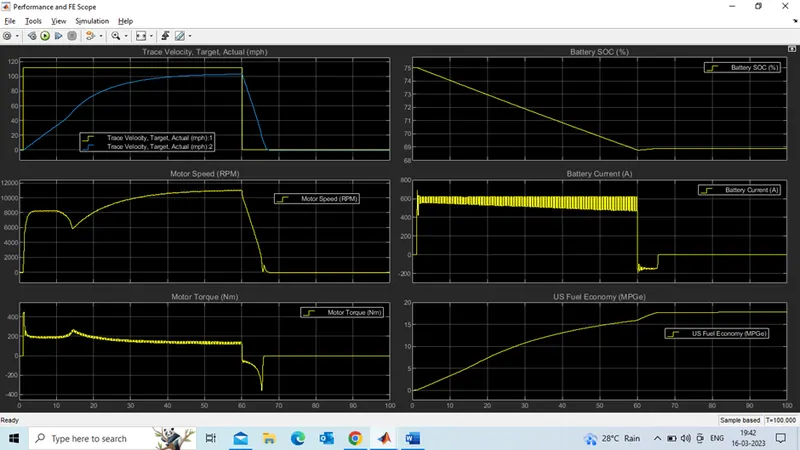
From the results, EV model Reaches its top speed 103 mph with WOT drive cycle in 58.6 sec. HEV model reaches its top speed 83 mph with WOT drive cycle in 58.9 sec.
Here EV model reaches more velocity (mph) than HEV model in WOT drive cycle. Due HEV model have battery power limitations (lower and upper limit).
Comparison of speed (RPM):
From the results, EV model reaches to 11000 RPM in ~58 sec. HEV model reaches to 10000 RPM in 59 sec. In HEV model Engine get started and run the vehicle parallelly with motor @17 sec.
Here EV model reaches more speed (RPM) than HEV model.
Comparison of torque (Nm):
We know that; motor speed proportional to motor torque.
From the above results, EV model torques decrease (437 Nm to 118 Nm) at the time of Acceleration (1 sec to 60 sec). after completion of acceleration Torque decreases to -300 Nm due to Re-generative braking (for 5 sec). In HEV model, motor torque decreases (300Nm to 116 Nm) at the time of Acceleration (1 to 60 sec). After 60sec Motor torque decreases to 116Nm to -220Nm (for 5 sec) due to regenerative braking. After 65 sec it reaches to zero. whereas engine torque starts at 17 sec decreases to -170Nm until acceleration time (60 sec) and after completion of Acceleration time vehicle gets deceleration, then torque increases (-170 Nm to -130 Nm) due to speed decreases. Engine torque maintained at -130Nm until the engine runs.
Comparison of Battery current(Amps):
From the results, EV model Consumes Battery current 700 Amps for initial Acceleration with WOT drive cycle and it decreases to 470 Amps at the end of Acceleration@60 sec. HEV model Consumes battery current 500 Amps for initial acceleration with WOT drive cycle until Engine get started (~17 sec) after engine get started @ ~17.0 sec it decreases to 180 amps to the end of acceleration @60 sec.
After 60sec vehicle get deceleration, In EV model after 60 sec to 65 sec Battery get charged due to re-generative braking Battery current shows -180 Amps, after 65 sec braking completed and battery current shows 0 Amps. In HEV model After 60 sec to battery get charged due to Re-generative braking and Engine generated power.
Here, EV model consumes more battery current than the HEV model.
Comparison of SOC(%):
From the results, EV model Consumes SOC 6.0% (75 % to 69%) at initial acceleration with WOT drive cycle. After Completion of Acceleration time (60 sec) its remaining SOC is 69 %. In HEV model consumes SOC 21% (80% to 59%) at Initial acceleration with WOT drive cycle. While Acceleration, time at 17 sec engines get started and Consumption on SOC % is decreased (not zero). Whereas after completion of acceleration (60 sec), battery get charged (SOC % increases) due to Re-generative braking and Engine generated power.
Here, EV model remains same SOC % after Completion of Acceleration , HEV model have a source(engine) to increase SOC% after Completion of Acceleration.
Comparison of Fuel economy:
From the results, EV model has Always good efficiency in fuel economy (Battery). In HEV model, at acceleration time (1 to 17 sec) motor drive the vehicle, then fuel economy is 90%. after 17 sec engines get started parallelly to drive vehicle with motor, then fuel economy is 80 %. after acceleration time (60 sec) motor reaches to steady state but engine still in running then fuel economy decreases.
For these I conclude that fuel economy efficiency is less in Engine drives compared to motor(battery) drives