Project - Data Handling and Interpolation
PROJECT:
SCRIPT:
%matlab project%
clear all;
close all;
power=xlsread("vi"); %reading excel file to variable power%
x=power(:,1); %assign first column and all rows in to 'x' variable%
y=power(:,2); %assign second column and all rows in to 'y' variable%
xq1=(-17.3:0.1:0.9); %taken interpolation range%
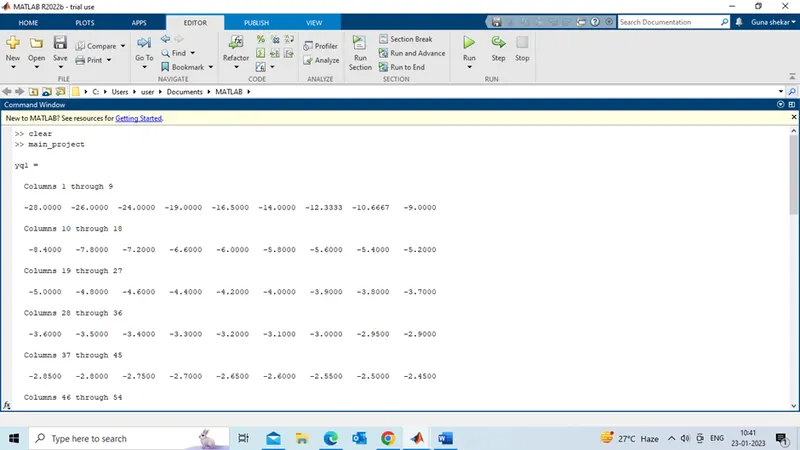
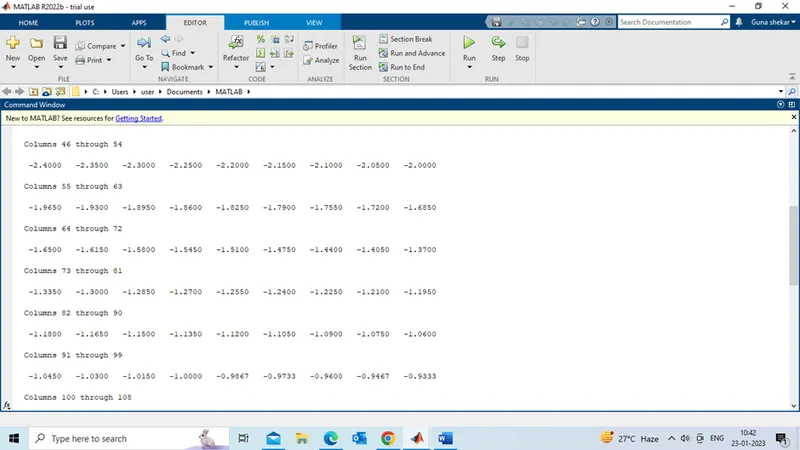
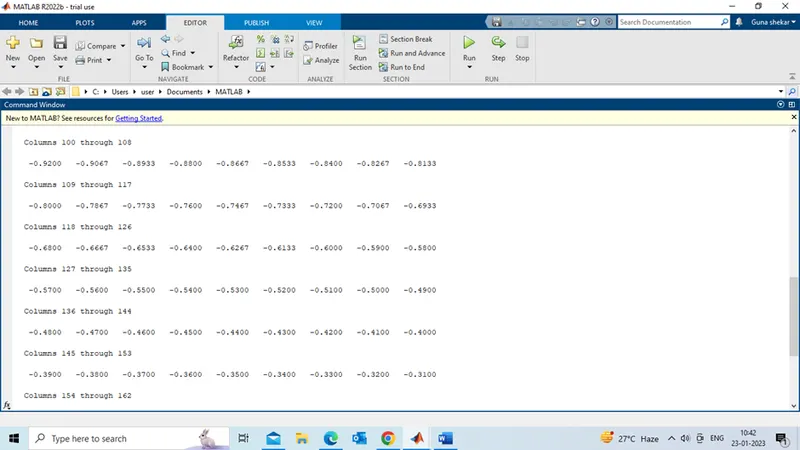
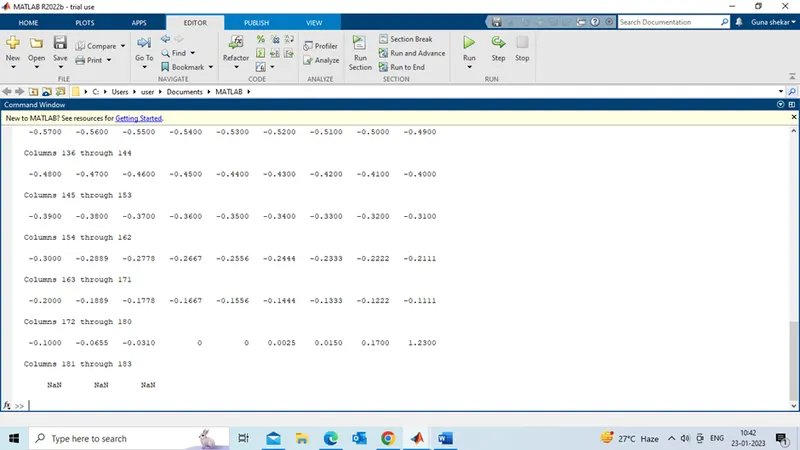
yq1=interp1(x,y,xq1) %linear interpolation data%
yq2=interp1(x,y,xq1,'spline'); %spline interpolation data%
figure(1);
plot(x,y,'o',xq1,yq1,':.'); %ploting and visualize difference of original data and linear interpolation data%
legend('original','linear interpolation'); %legend and labels%
grid;
xlabel('volts');ylabel('amps');
title('linear interpolation');
figure(2);
plot(x,y,'o',xq1,yq2,':.'); %ploting and visualize difference of original data and spline interpolation data%
legend('original','spline interpolation'); %legend and labels%
grid;
xlabel('volts');ylabel('amps');
title('spline interpolation');
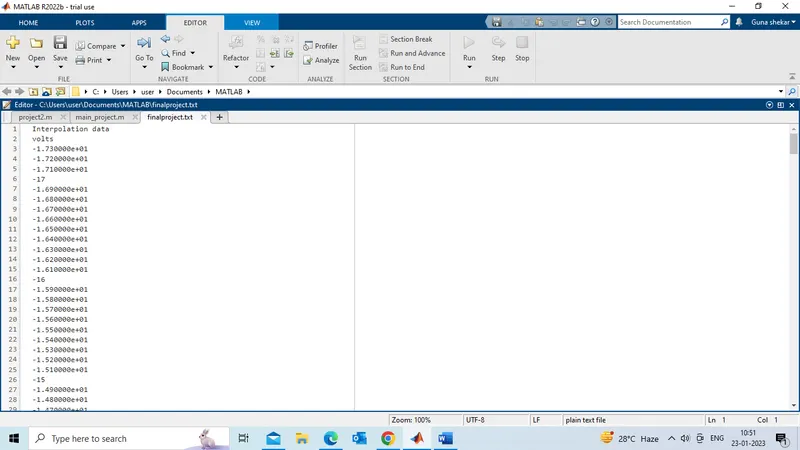
fid=fopen('finalproject.txt','w'); %opening text file to write data in it%
fprintf(fid,'Interpolation data'); %adding headline in text file%
fprintf(fid,'\n'); %new line%
fprintf(fid,'volts'); %adding headline to volts data%
fprintf(fid,'\n');
fprintf(fid,'%d\n',xq1); %writing volts interpolation data in to text file%
fprintf(fid,'\n');
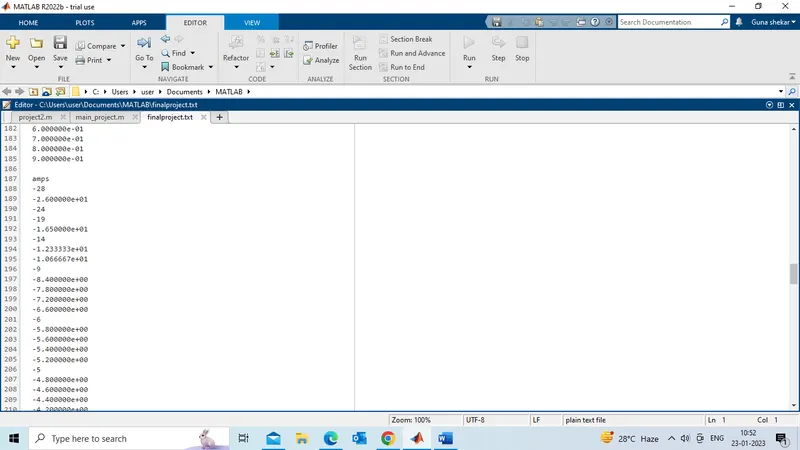
fprintf(fid,'amps'); %adding headline to amps data%
fprintf(fid,'\n');
fprintf(fid,'%d\n',yq1); %writing amps interpolation data in to text file%
fclose(fid); %closing the text file%
OUTPUT:
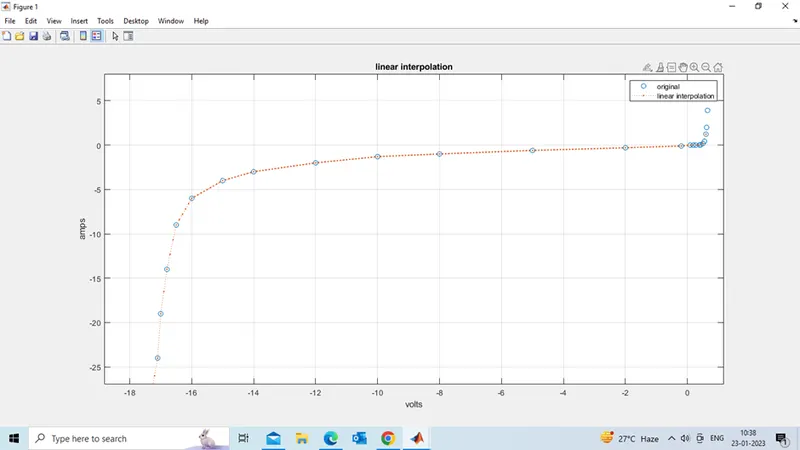
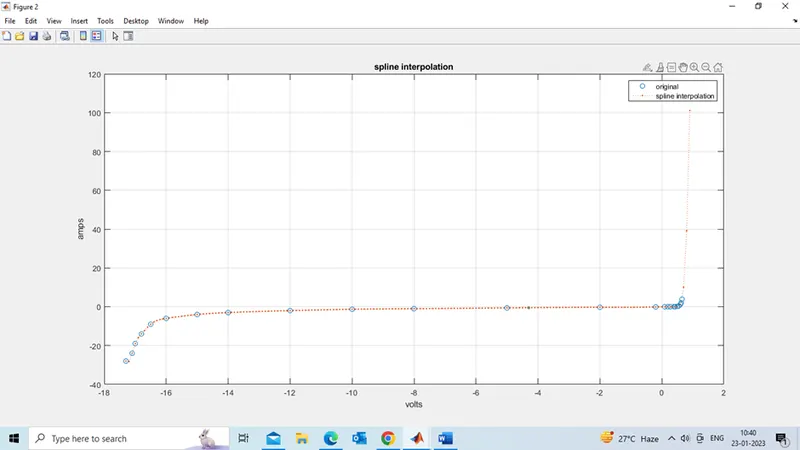
Note: Here we can observe the difference between the linear and spline interpolation. spline interpolation get more smoothy curves and lines compared to linear interpolation. example: amps range(-9,-6,-4,-3).