Week-3 Challenge: ADVISOR Tool
Task-1
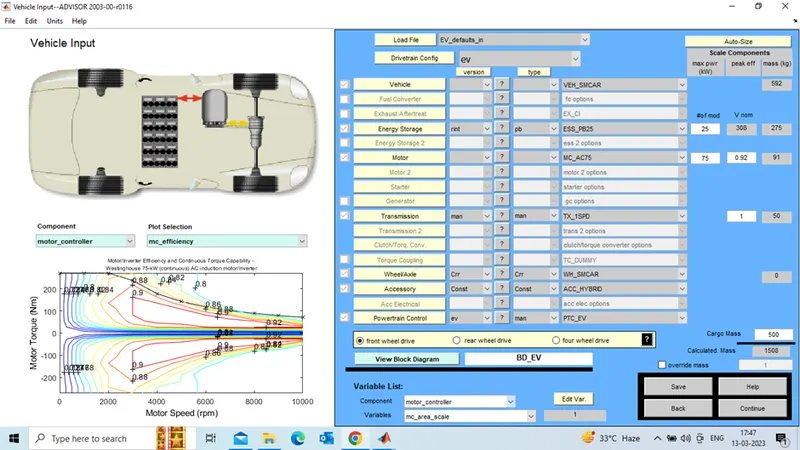
Consider file : EV_defaults_in , Cargo mass is 500 kg and battery modules 25 no’s , 308 volts
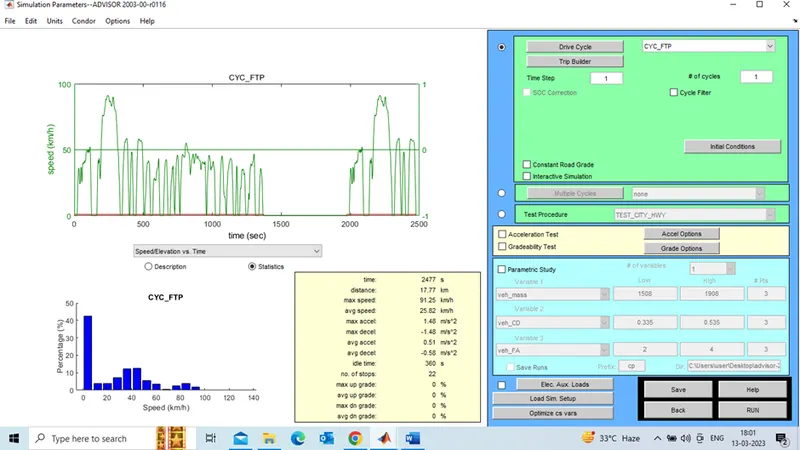
Consider FTP drive cycle
OUTPUT: For one drive cycle
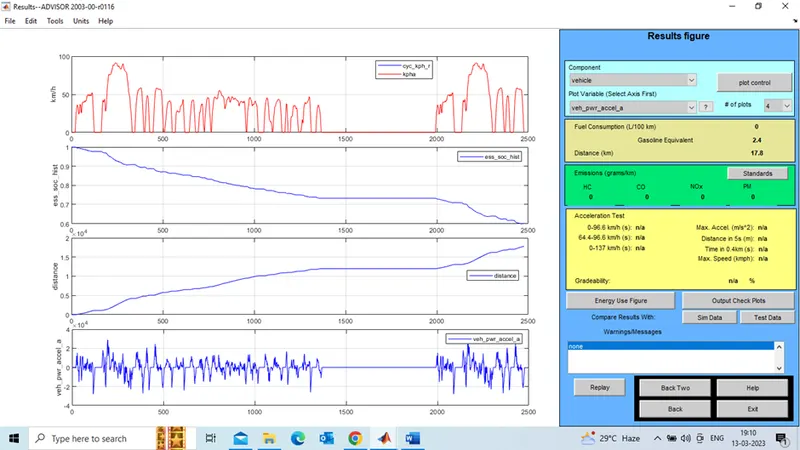
For one drive cycle, vehicle reaches to 17.8 KM and SOC reduces from 100% to 60%
No of drive cycles = 02
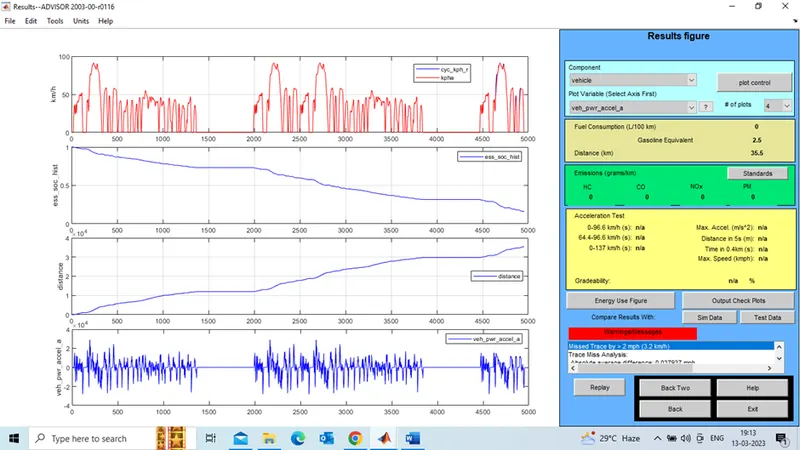
For two drive cycles, vehicle reaches to 35.5 KM and SOC reduces from 100% to 20 %
No of drive cycles = 03
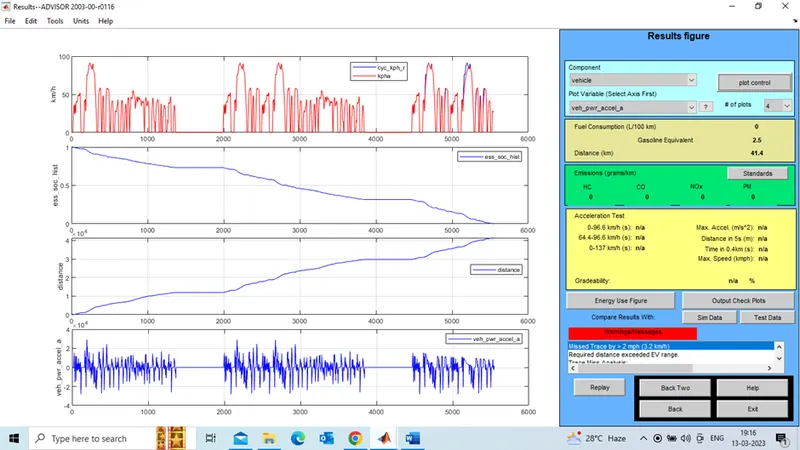
For three drive cycles, vehicles reaches to 41.4 KM but it exceeded EV range( warning show on output) SOC reaches to zero at 5500 sec , so With battery vehicles will travel approx. 41KM
Conclusion: My observation on above results to conclude that vehicle can’t travel 45KM with FTP drive cycle . SOC reduced to zero when vehicle reaches to 41.4KM (Mean vehicle can travel approx. 41KM with FTP drive cycle)
TASK:2
Consider the file : EV_defaults_in , Cargo mass is 500 kg and battery modules 30 No’s ,370 volts
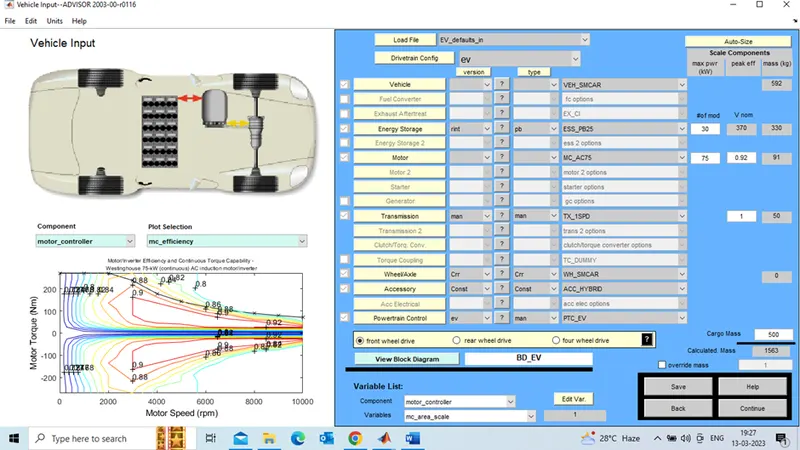
Consider FTP drive cycle
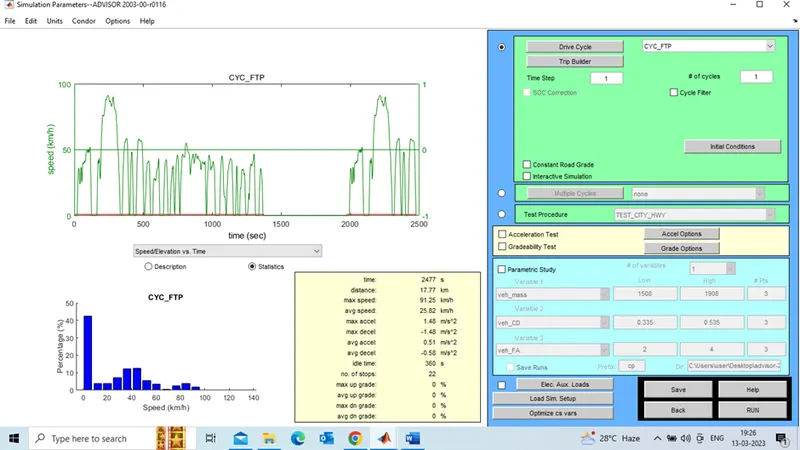
No of drive cycles = 01
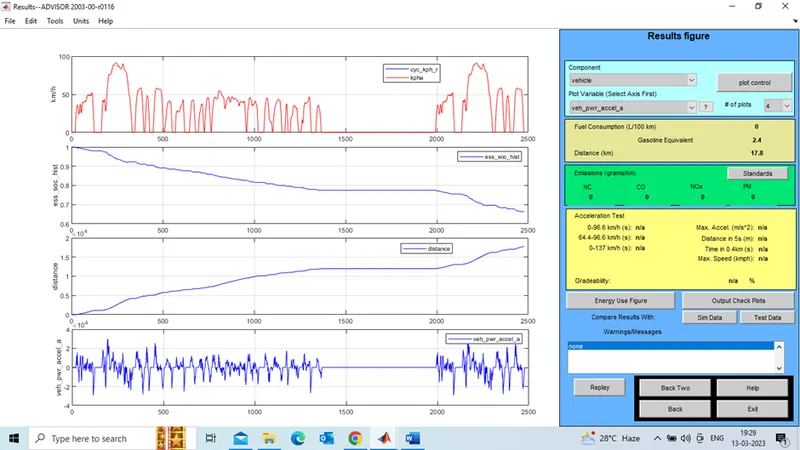
For one drive cycle, vehicle reaches to 17.8 KM and SOC reduces from 100% to 65%
No of drive cycles = 02
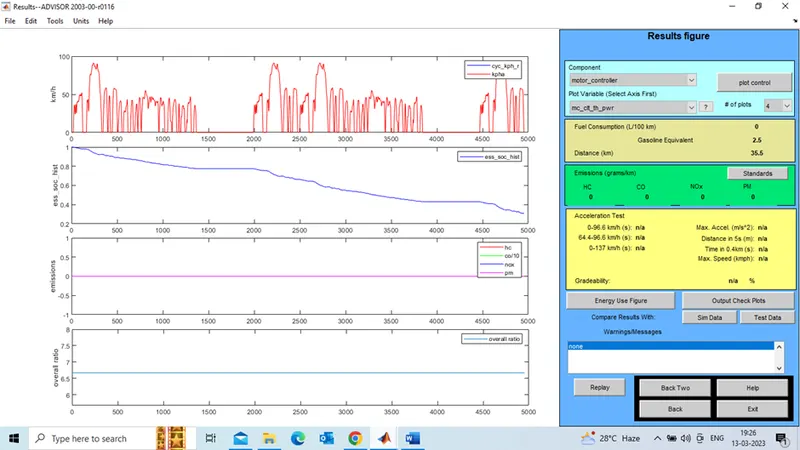
For two drive cycles, vehicle reaches to 35.5 KM and SOC reduces from 100% to 30 %
No of drive cycles = 03
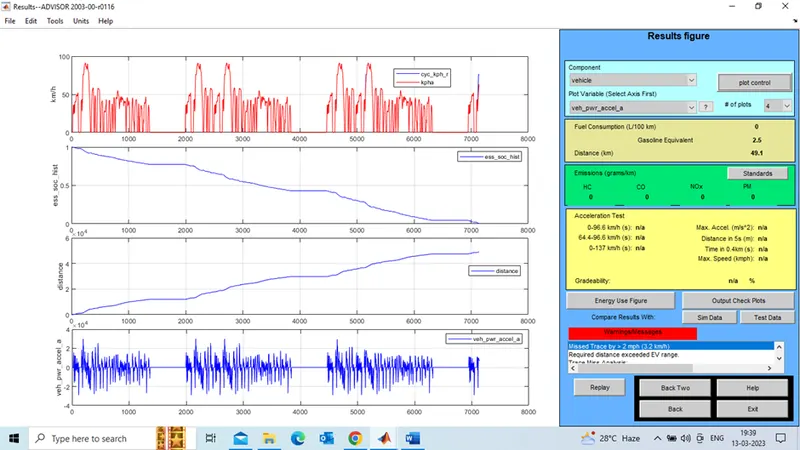
For three drive cycles, vehicles reaches to 49.1 KM but it exceeded EV range( warning show on output) SOC reaches to zero at 7200 sec , so With battery vehicles will travel approx. 49 KM @ 30 no’s of battery modules.
Conclusion: From the above results, Vehicle can travel the 45 KM with FTP drive cycle is possible when battery modules 30 no’s.
TASk-3
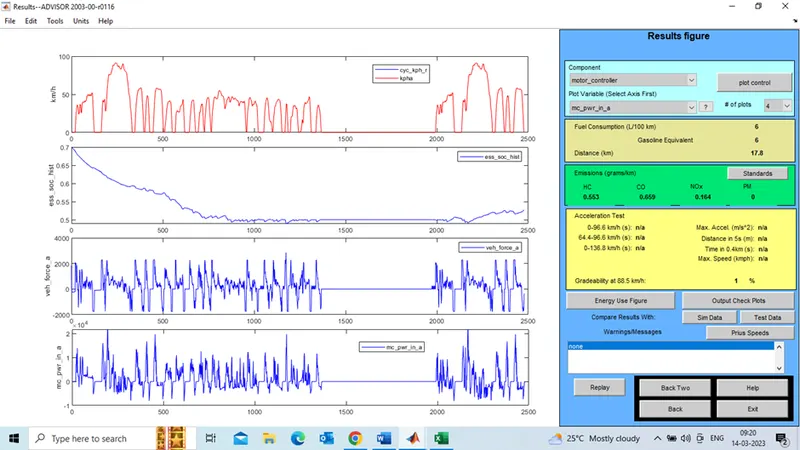
gradeability test with PRIUS_Jpn_defaults_in file
Gradeability @ 1%
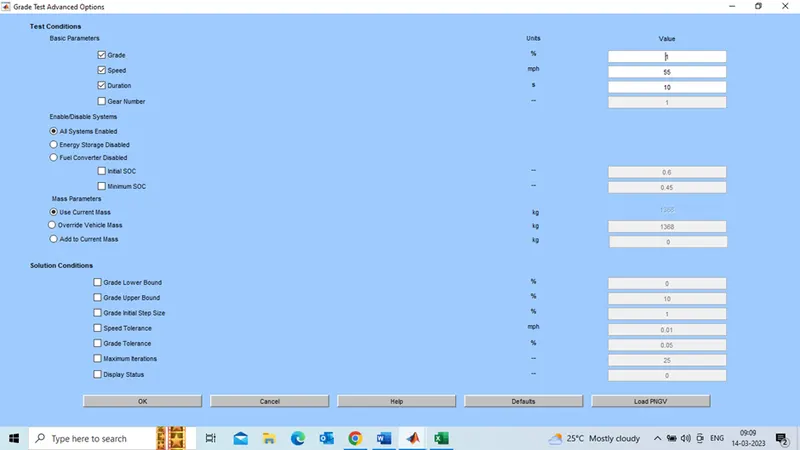
Result:
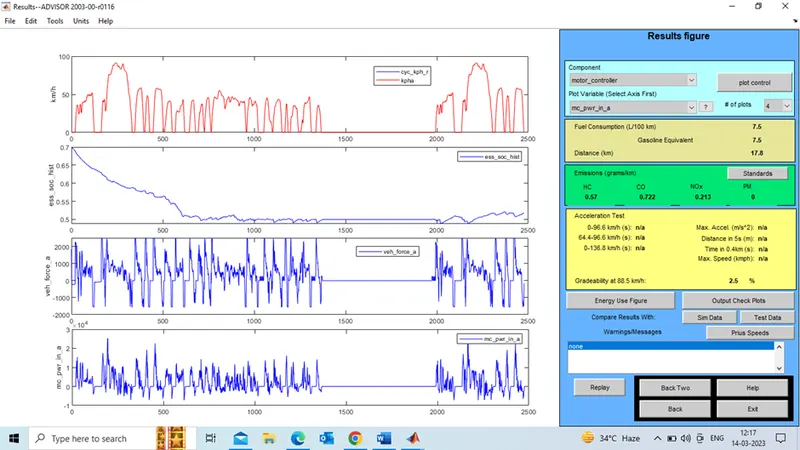
Gradeability @ 2.5%
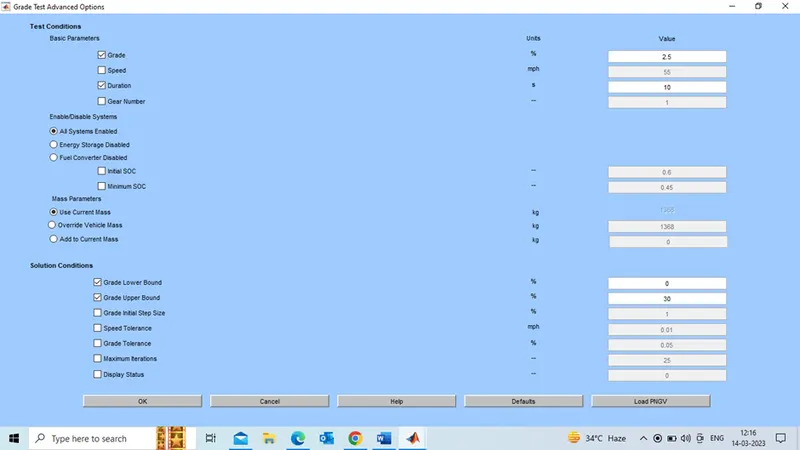
result:
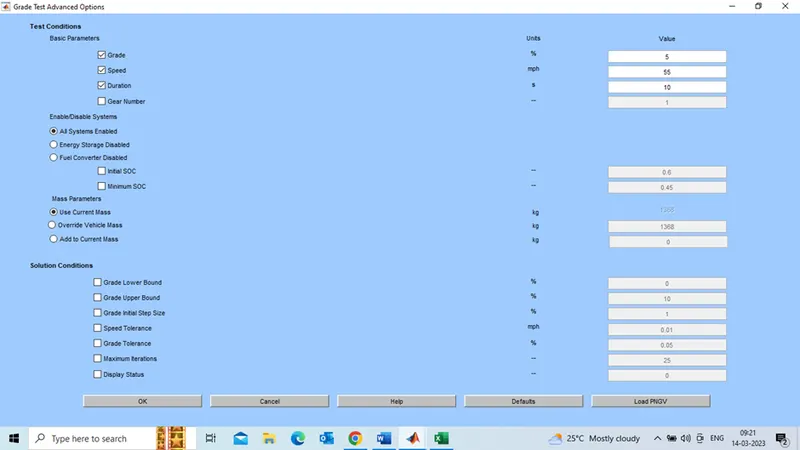
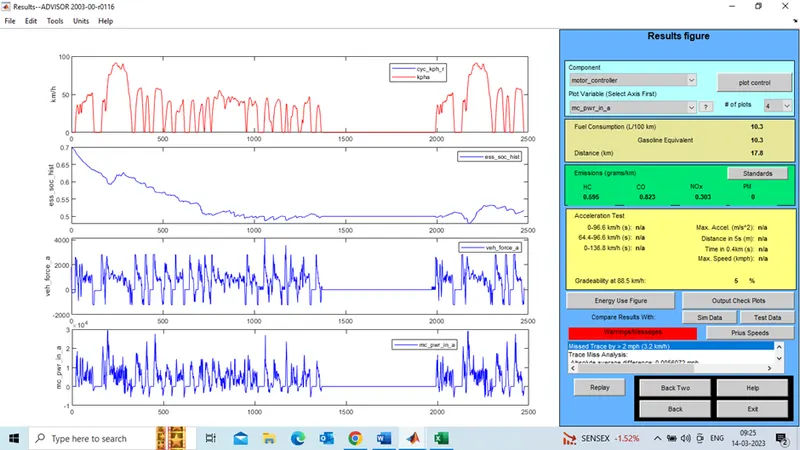
Gradeability @5%
Output:
Gradeability @ 8.5%
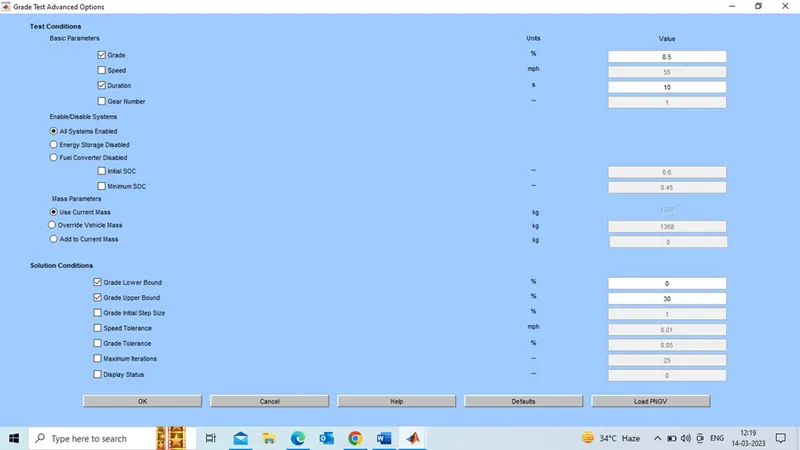
Output:
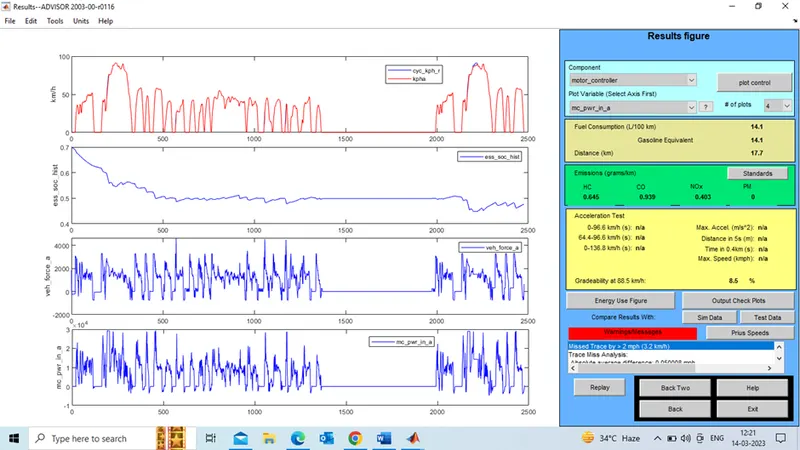
From the vehicle parameters , gradeability test goes in between 1 to 8.5 % with out change other parameters.
Camparision table:
|
Gradeability Test |
||||
|
parameters |
Gradeability @ 1% |
Gradeability @ 2.5% |
Gradeability @ 5% |
Gradeability @ 8.5% |
|
KM/hr |
90 |
90 |
90 |
85 |
|
SOC % start |
70 |
70 |
70 |
70 |
|
SOC % reduced initially |
50 |
50 |
50 |
50 |
|
time for discharge |
800 sec |
700 sec |
750 sec |
400 sec |
|
SOC % reaches to lower limit |
49 |
49 |
48 |
45 |
|
Lower limit@ time |
1200 sec |
1200 sec |
2200 sec |
2200 sec |
|
power (KW)@ top speed |
21 |
25 |
30 |
30 |
|
Distance(KM) |
17.8 |
17.8 |
17.8 |
17.8 |
Conclusion : From the camparision table, increases the required power with increasing the gradeability. SOC also decrease with increase in gradeability and speed also decreases with increases the gradeability ( at gradeability 8.5 % speed curve starts shows the variation to actual and required).