Week-4 Challenge WOT Condition Part-2
1.a.What is the difference between mapped and dynamic model of engine, motor and generator?
1.THE MAPPED MODEL
-
- The simulation of the powertrain block set model consists of data that is prebuilt in the lookup table is dealing with mapped data or mapped model.
- The mapped model calculation is very fast.
2.THE DYNAMIC MODEL
- The simulation of the powertrain block set model consists of data that is not prebuilt but it takes the real-time data by calculating every small individual like the movement of vehicle, drag, speed, velocity, wheel braking, etc. which is dynamic data or dynamic model for engine system or motor system or generator system.
- The dynamic model calculation is a time taken for a very long time for calculating every data.
1.b. How can you change model type?
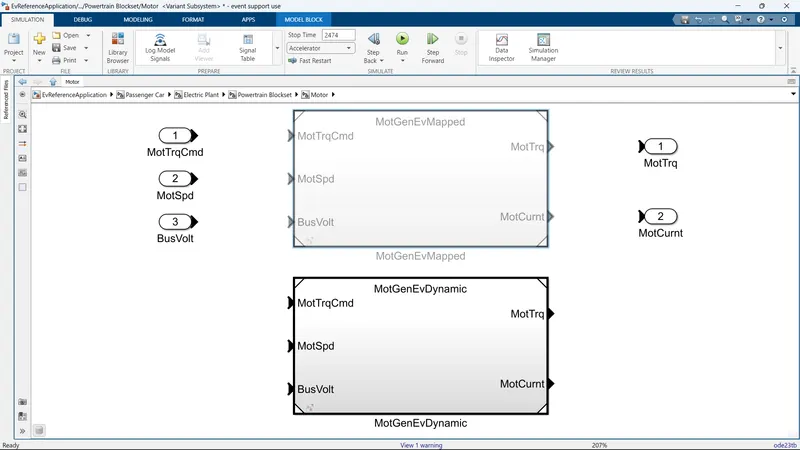
To change the variant type, Right click on the block and choose >> Variant>> Open in variant Manager.
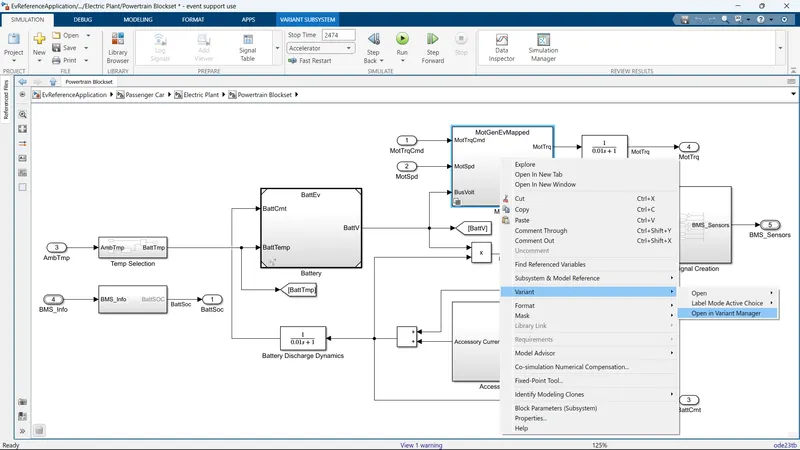
Open the Variant Manager file there we find all the names of the blocks of systems and sub-systems.
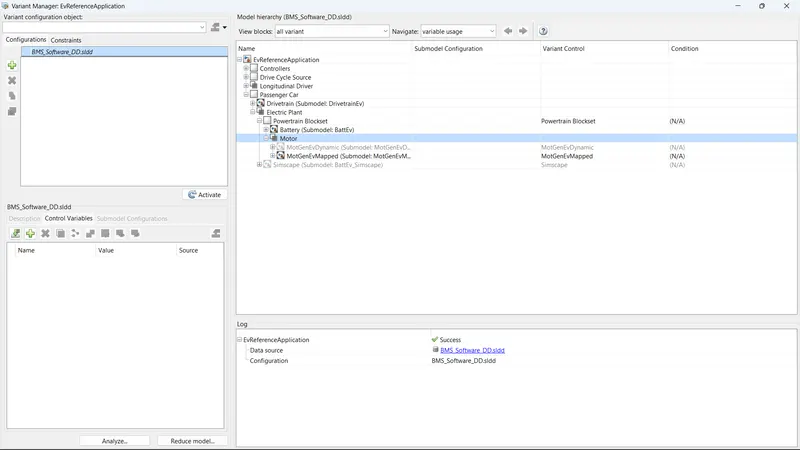
Variant manager for Motor has been opened and active variant is Mapped block. To change it to Dynamic block, right click on it and select set as Label mode active choice.
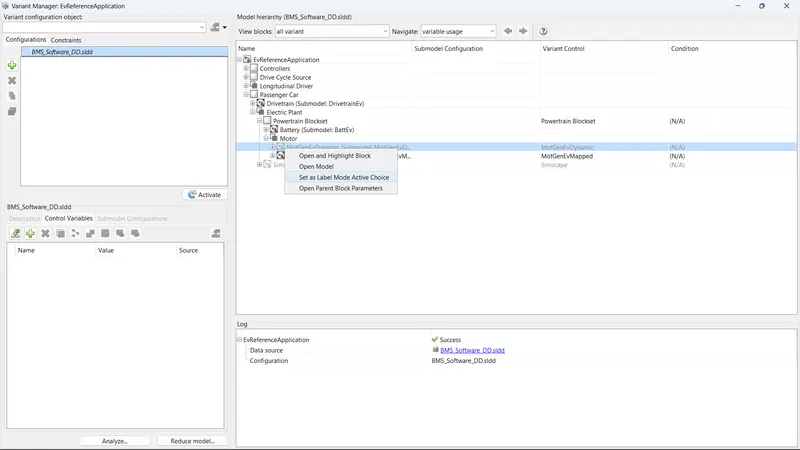
Now it changed to Dynamic mode.
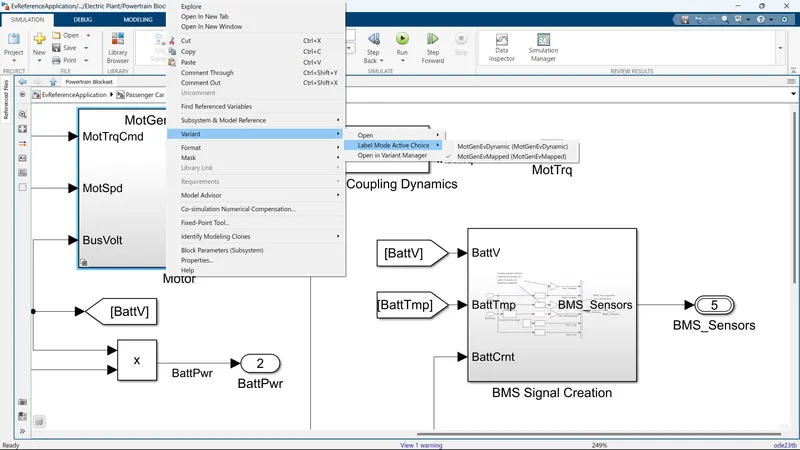
Or we can simply right click on the block and select variant>> Label Mode Active choice >> select desired mode to be active
2. a. How does the model calculate miles per gallon?
- The model calculate miles per gallon in a way that, it uses the battery power in Watts and FuelFlow in Kg and Vehicle Speed in seconds and Vehicle Speed is integrated to get the displacement or Distance in meters
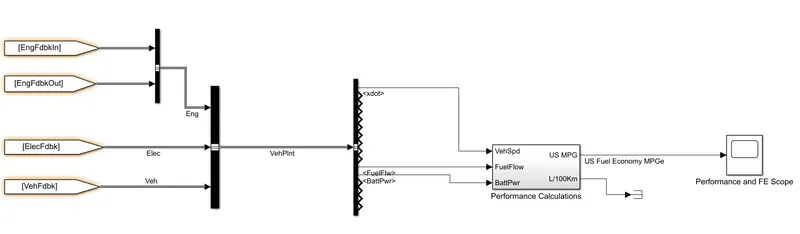
-
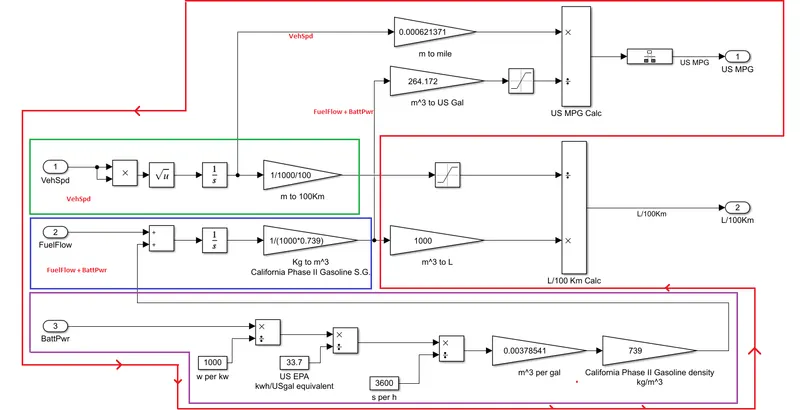
PERFORMANCE CALCULATION SUB-SYSTEM INSIDE:
- In side the subsystem of performance Calculation, It explains the The model calculation of miles per gallon.
- The part of Red color flow deals with the Calculation of miles per gallon.
- The part of Green color flow deals with the Vehicle Speed.
- The part of Blue color flow deals with FuelFlow and Battery power.
- The part of Perple color flow deals with Battery power.
- The Red color flow is the main aim to know how to calculate the miles per gallon.
- First, The battery power (x) in Watts is divided by 1000 to get Kilo Watts and Kilo Watts is Divided By 33.7 Kwh/US gallon which is the Equivalent of US EPA (Environmental Protection Agency) for US gallon Equivalent in Kilo Watt Hours.
- Then Kilo Watt Hours is converted in to Kilo Whatt second by divided by 3600 to Kilo Watt Hours.
- Now the US EPA value and 3600 Kilo Watt second is multiplied by 0.00378 which gives the `m^3/(gallon)` and multiplied by 739 to convert `m^3/(gallon)` into `(Kg)/m^3` and added to FuelFlow.
- Then Fuel flow and battery power are added to get `(Kg)/m^3` to `m^3` and multiplied by 264.172 to convert `m^3` into Us Gallon.
- Then Lastly, Vehicle Speed is taken from xdot which is the Vehicle speed and under go into integration to get distance, We know that by integrating the speed we get distance in Meters (m), by Multiplied by 0.00062137 is going to convert the meter in to miles.
- Now Miles is divided by gallon we get miles per gallon. In a way `(Veh_(speed))/(Fuel+Bat_(power))` we get miles per gallon.
- In side the subsystem of performance Calculation, It explains the The model calculation of miles per gallon.
2. b. Which factors are considered to model fuel flow?
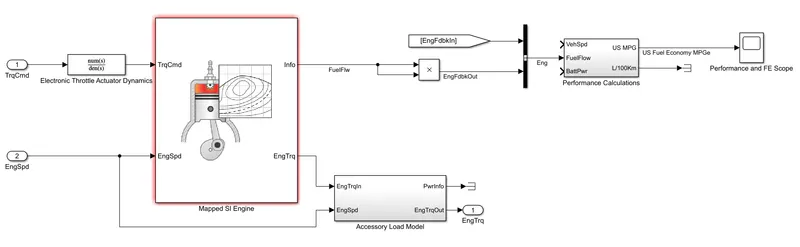
- The factors to consider to model the fuel flow are CI Engine or SI Engine, Flue mass Flow Rate (Kg/s), Engine feedback out, Fuel flow.
- The Fuel Mass Flow Rate is the Fuel Flow which is coming from Engine info.
3. The HEV Reference Application with the WOT drive cycle:
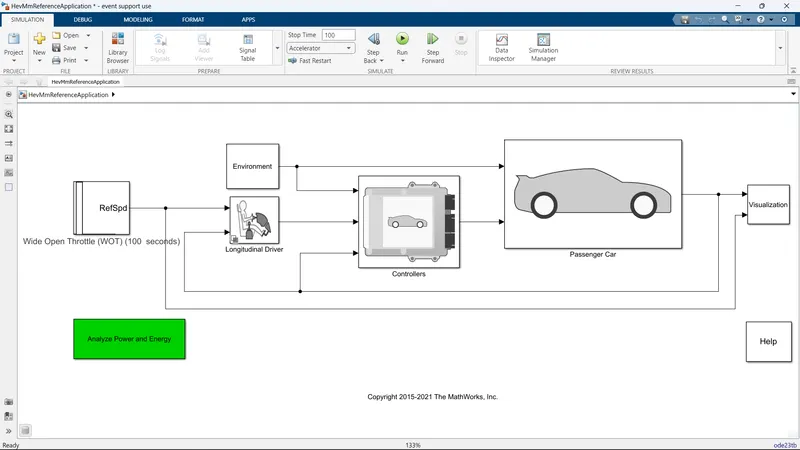
- In the below simulation is regarding The HEV Referance Application with the WOT (Wide Open Throttle) Drive Cycle.
- It has Environment sub system, Longidudinal drive sub system, Passenger Car sub system, Controller sub system, etc.
- The grade and wind velocity is present in Environment sub system.
3. a. WOT WITHOUT CHANGE IN GRADE AND WIND VELOCITY:
- Without change in gradeability and wind velocity which is present in Environment sub system.
- In side the Environment sub system it has Temperture, Pressure, Gradeability, and Wind Velocity.
- The below data give that there is no change in grade at zero and wind velocity at zero data.
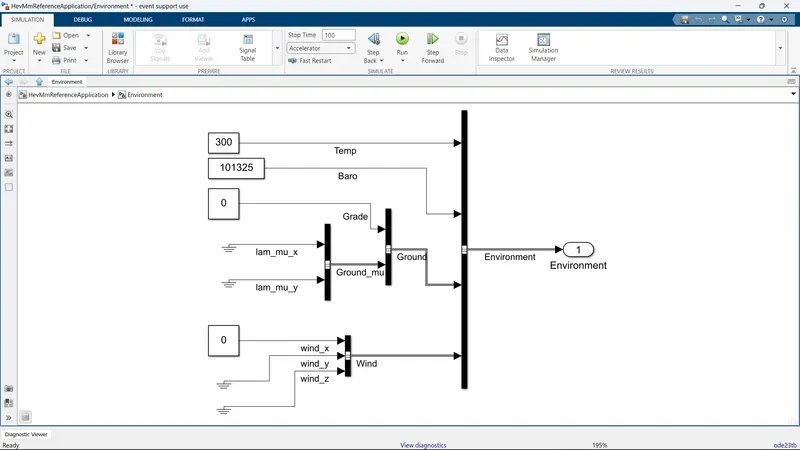
- The above data give that there is no change in grade at zero and wind velocity at zero data.
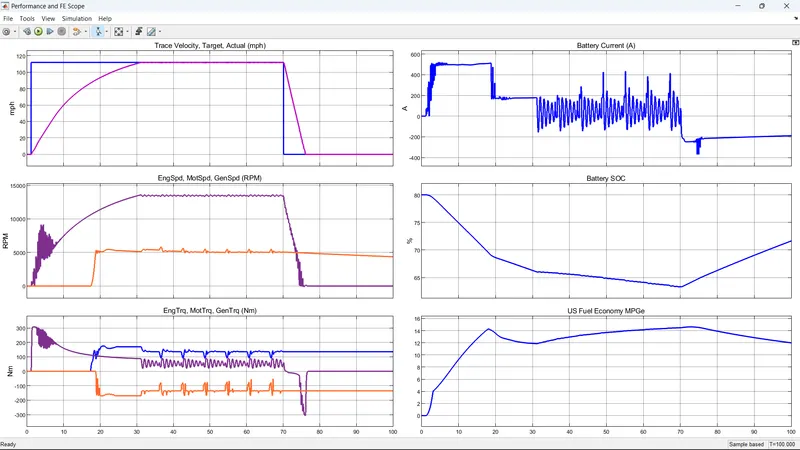
- The below 6 graphs represents the Trace Velocity and Actual Velocity, Engine speed and motor speed and generator speed, Engine-motor-generator torque, Battery Current, State Of Charge (SOC), and Fuel Economy (MPG).
- The Actual Velocity is attending the values of 0 mph to 50 mph and Trace velocity is similarly trying to achieve the Actual velocity.
- The flow of Battery Current from +500 amps to -150 amps is the range of the battery at the end of the speed become zero the battery is reaching the zero amps
- When the flow of Battery Current is making the Generator speed to run at constant speed at 5300 rpm to 4300 rpm.
- The Engine speed is at positively constant
- The Motor Torque is at constant 0
- The Motor speed is from Zero to 7000 rpm
- The Engine Torque is around zero to 130 Nm
- The Generator Torque is at 0 Nm to -135 Nm
- The State of Charge is at 80 and gradually decreases and becomes constant around 28 volt to 23 volt
- The Fuel Economy for mile per gallon around 14 gallons for 3000 seconds.
- The Fuel Economy is less and The State Of Charge is less
3. b. WOT WITH CHANGE IN GRADE AND WIND VELOCITY:
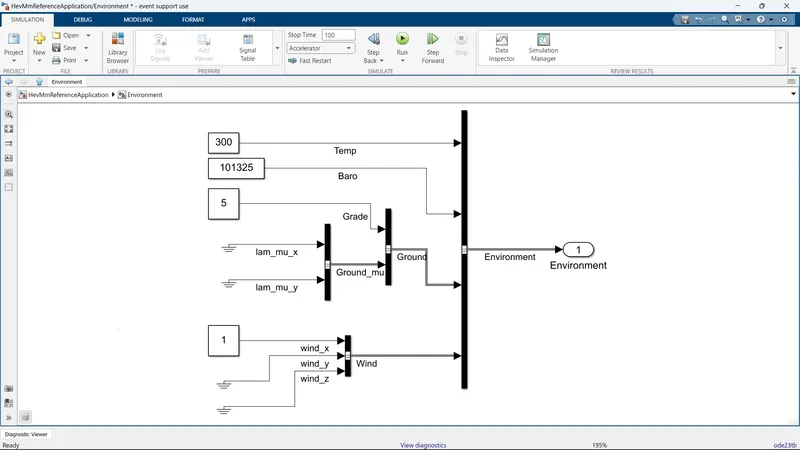
- With change in gradeability and wind velocity which is present in Environment sub system.
- In side the Environment sub system it has Temperture, Pressure, Gradeability, and Wind Velocity.
- The below data give that there is change in grade at 5 and wind velocity at one data.
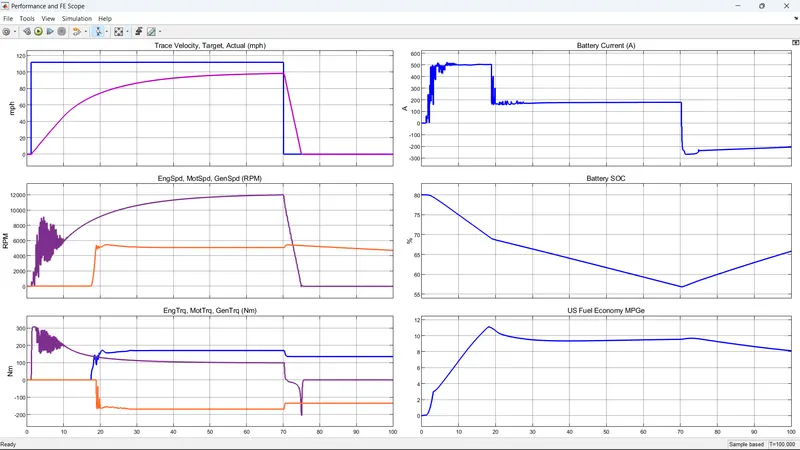
- The Actual Velocity is attending the values of 0 mph to 50 mph and Trace velocity is similarly trying to achieve the Actual velocity.
- The flow of Battery Current from +500 amps to -220 amps is the range of the battery at the end of the battery is reaching the -200A
- When the flow of Battery Current is making the Generator speed to run at constant speed at 0 rpm to 4500 rpm.
- The Engine speed is at positively constant
- The Motor Torque is at constant 0
- The Motor speed is from Zero to 15000 rpm
- The Engine Torque is around zero to 130 Nm
- The Generator Torque is at 0 Nm to -135 Nm
- The State of Charge is at 80 and gradually decreases and becomes constant around 28 volt to 23 volt
- The Fuel Economy for mile per gallon around 10 gallons for 3000 seconds.
- The Fuel Economy is less and The State Of Charge is less
4. COMPARE THE SIMULATED RESULT OF HYBRID ELECTRIC POWERTRAIN AND PURE ELECTRIC POWERTRAIN:
4. a. THE SIMULATED RESULT OF HYBRID ELECTRIC POWERTRAIN:
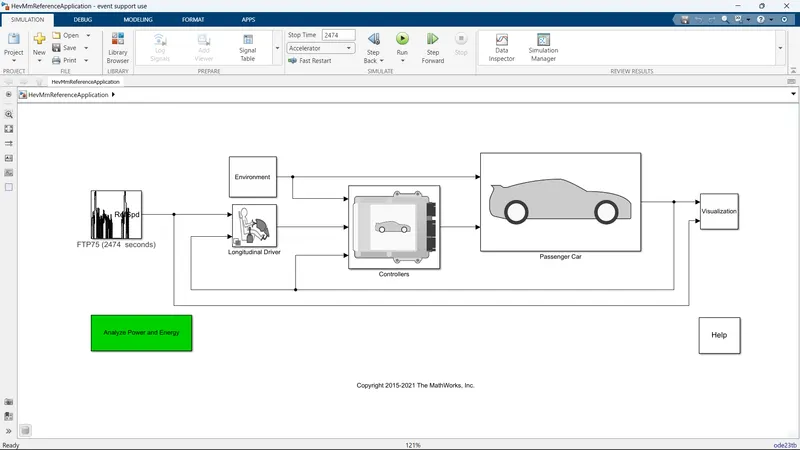
- In the below simulation is regarding The HYBRID ELECTRIC POWERTRAIN Referance Application with the FTP75 Drive Cycle.
- It has Environment sub system, Longitudinal drive sub system, Passenger Car sub system, Controller sub system, etc.
RESULT OF HYBRID ELECTRIC POWERTRAIN:
- The below 6 graphs represents the Trace Velocity and Actual Velocity, Engine speed and motor speed and generator speed, Engine-motor-generator torque, Battery Current, State Of Charge (SOC), and Fuel Economy (MPG).
- The Drive cycle of Actual velocity is as same as Trace Velocity.
- The Motor speed and the Velocity are identical but change in values
- The Motor Torque and Battery current are identical with same values
- The Engine speed is at positively constant
- The Generator Torque is at negatively constant
- The State of Charge is at 60 and gradually decreases and increases and comes to 45 volts at the end of 3000 seconds
- The Fuel Economy for mile per gallon around 45 gallons for 3000 seconds
The Fuel Economy is less and The State Of Charge is less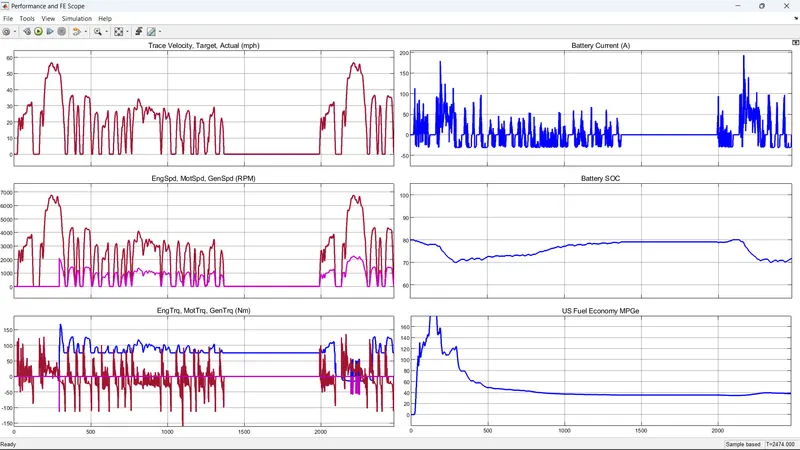
4. b. THE SIMULATED RESULT OF PURE ELECTRIC POWERTRAIN:
- In the below simulation is regarding The PURE ELECTRIC POWERTRAIN Referance Application with the FTP75 Drive Cycle.
- It has Environment sub system, Longitudinal drive sub system, Passenger Car sub system, Controller sub system, etc.
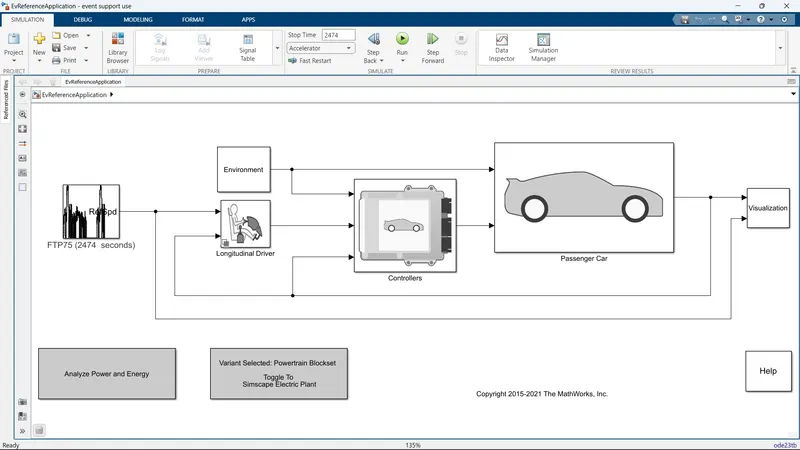
RESULT OF PURE ELECTRIC POWERTRAIN:
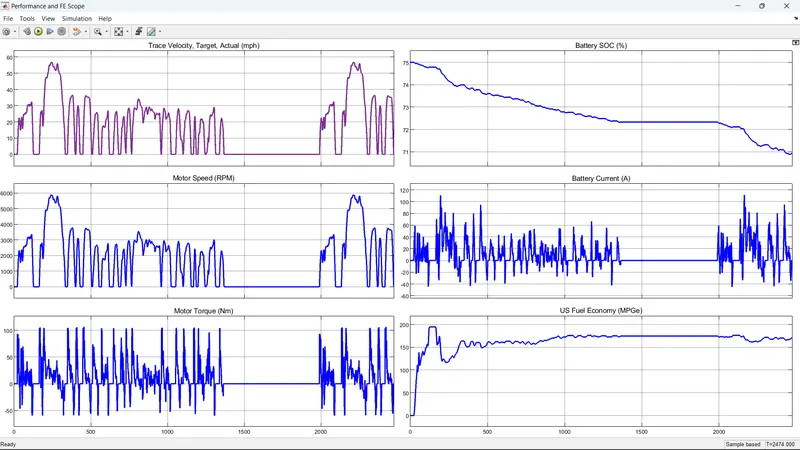
- The below 6 graphs represents the Trace Velocity and Actual Velocity, Engine speed and motor speed and generator speed, Engine-motor-generator torque, Battery Current, State Of Charge (SOC), and Fuel Economy (MPG).
- The Drive cycle of Actual velocity is as same as Trace Velocity.
- The Motor Torque and Battery current are identical
- The Motor speed and the Velocity are identical but change in values
- The State of Charge is at 60 and gradually decreases to 72 volts
- The Fuel Economy for mile per gallon around 170 gallons for 3000 seconds.
- The Fuel Economy is more and The State Of Charge is more