Project - Data Handling and Interpolation
% Reading data from excel file
data=xlsread("VI.xlsx");
%Importing values of voltage and current from excel file
v= data(:,1);
i =data(:,2);
% Defining interpolation range
xq= [-17.3:0.1:0.9];
yq1 = interp1(v,i,xq);
yq2=interp1(v,i,xq,'spline'); % Spline interpolation
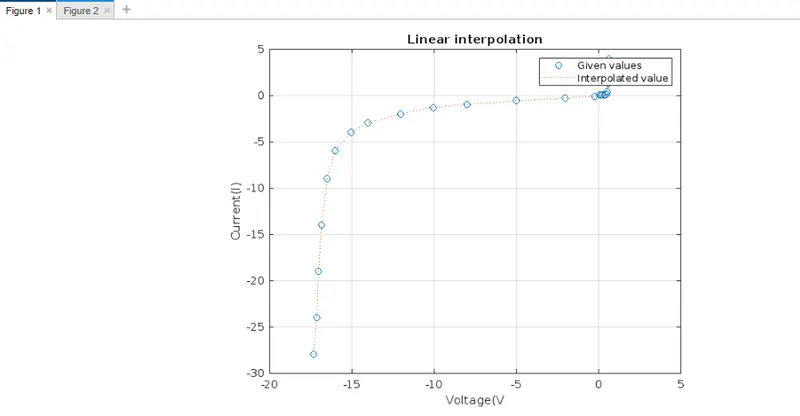
figure(1);
plot(v,i,'o',xq,yq1,':');
grid;
title('Linear interpolation');
xlabel('Voltage(V');
ylabel('Current(I)');
legend('Given values','Interpolated value');
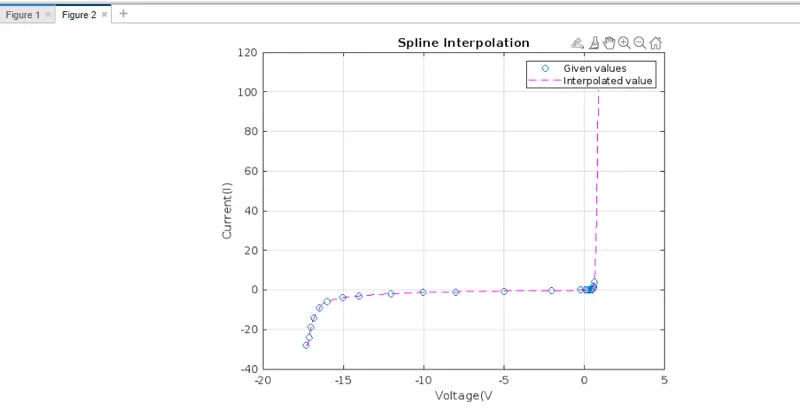
figure(2);
plot(v,i,'o',xq,yq2,'m--');
grid;
title('Spline Interpolation');
xlabel('Voltage(V');
ylabel('Current(I)');
legend('Given values','Interpolated value');
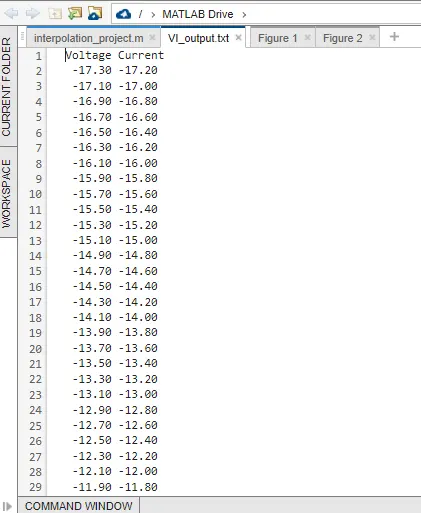
% Opening text file
V_I = fopen('VI_output.txt','w');
fprintf(V_I,'Voltage Current\n');
% Writing Voltage and Current values
fprintf(V_I,' %4.2f %5.2f\n',xq,yq2 );
%to save linear interpolation graph
savefig(1,'V_Ilinear.fig');
%to save spline interpolation graph
savefig(2,'V_Ispline.fig');
fclose(V_I);