Week-4 Challenge WOT Condition Part-2
Q1:
The difference between mapped and dynamic model is dynamic model uses all the input details and all the performance outputs are analysed but in the mapped model we will use a look up table mapped basically steady-state analysis and will analyse the quasi-steady state of it through simulation
we change the model type by clicking the model in that you have block options there we can change the model type
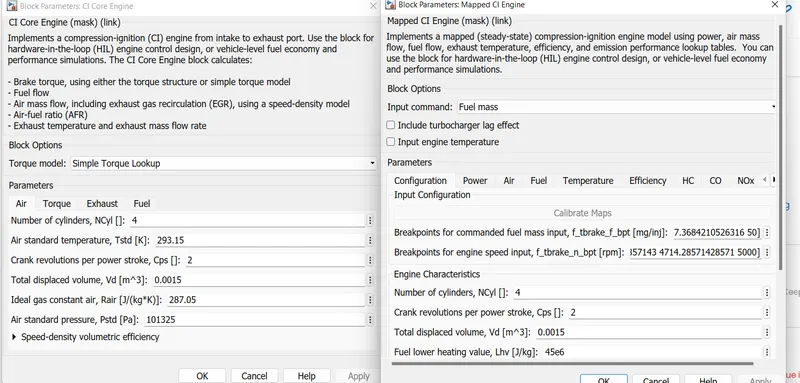
in the above picture also you can see in the description it clearly tells what is the difference between them .
Q2:
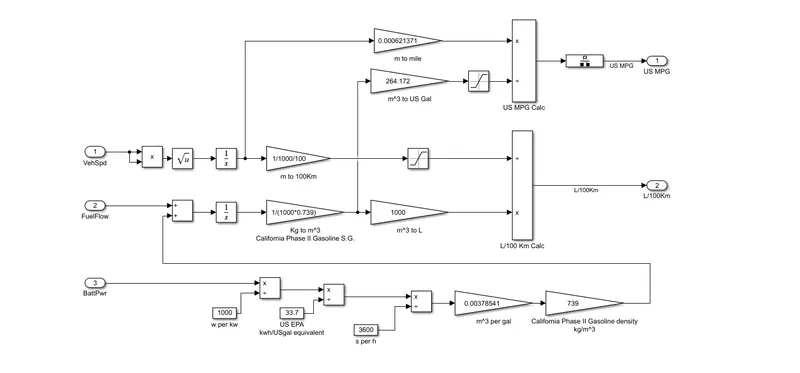
The above picture shows you how the mpg miles per galoon was calculated. first the speed is converted to distance by integrating it , converting m to miles then this is a hybrid model so fuel is calculated considering battery also by converting it to kwh and then dividing by 3600 sec because 1 hour consists of 3600 sec and converted to standard as they described it as california phase 2 and each instant is added so we are integrating it to get final value . mileage is generally ratio of distance to fuel used so we multiplying distance , second input fuel is send to saturation block which contains lower limit as 0.001 because any one divided by zero gives infinity to avoid that we are using this block . then we are using rate transition for transferring data
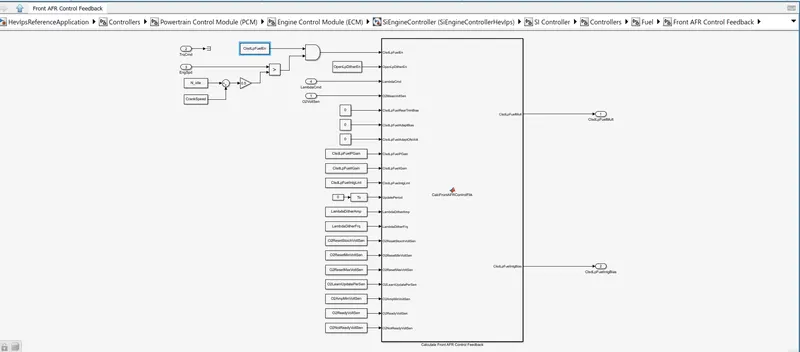
from front AFR control block which was in powertrain control module(PCM) which was in controllers blockset is only deciding the fuel flow . the main factors for the fuel flow are o2voltsen , torque command, engine speed , AFR command
Q3:
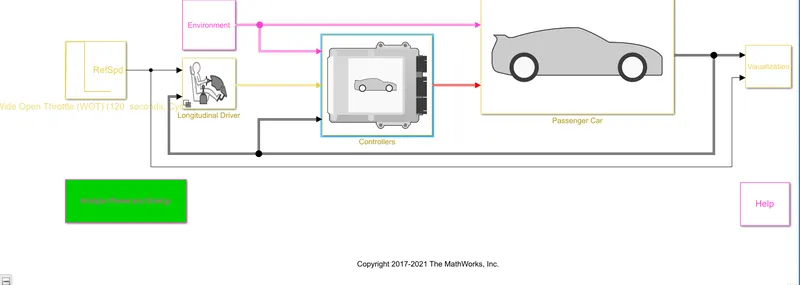
the above picture shows you the simulink model of hev and i have attached that file in the name of 'HevIpsReferenceApplicationwithoutchange01' and with change in windvelocity and grade in the name of 'HevIpsReferenceApplicationwithchange01'
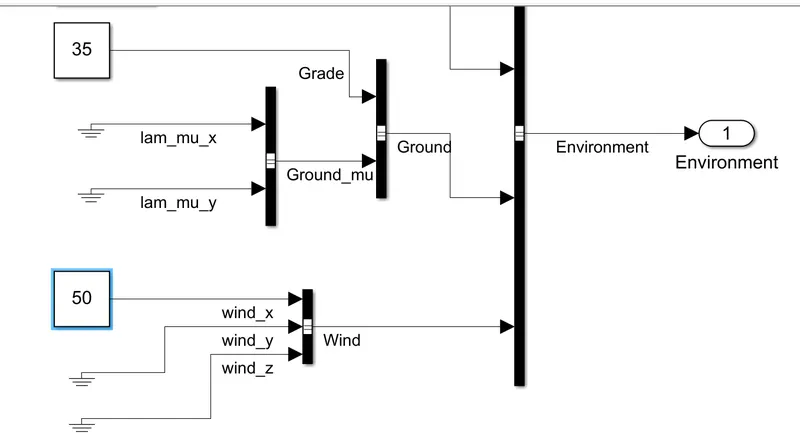
here i have changed the grade to 35 and wind velocity to 50 and it was shown above
Results:
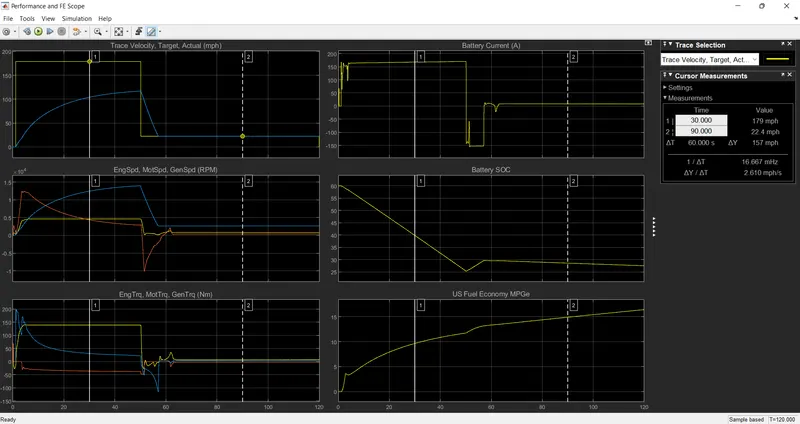
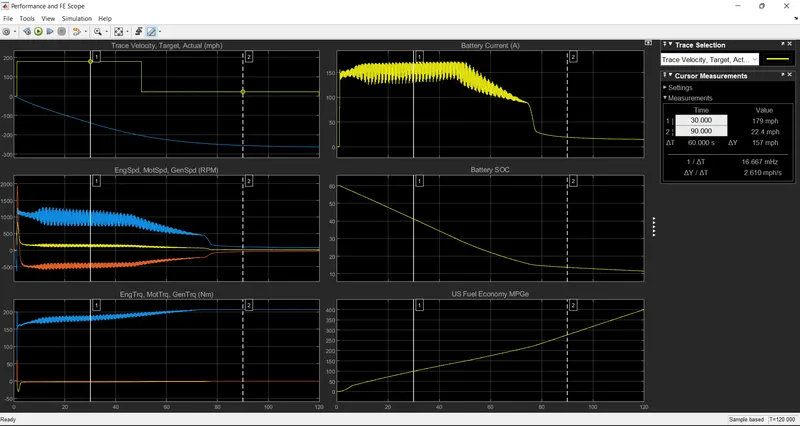
in the above picture you can see the difference the increase in grading and wind velocity decrease the speed and which in turn creating an adverse effects on other plots also
Q4:
pure EV:
simulink model:
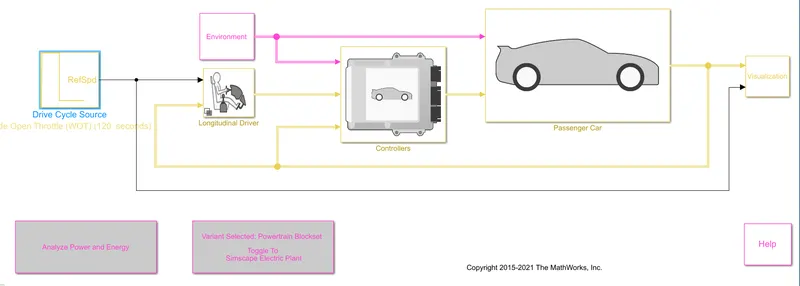
The above picture shows you the pure ev model and it is attached as 'EvReferenceApplication01'
Hybrid EV simulink Model:
The above picture shows you the pure ev model and it is attached as 'HevIpsReferenceApplicationwithoutchange01'
Results:
Pure EV:
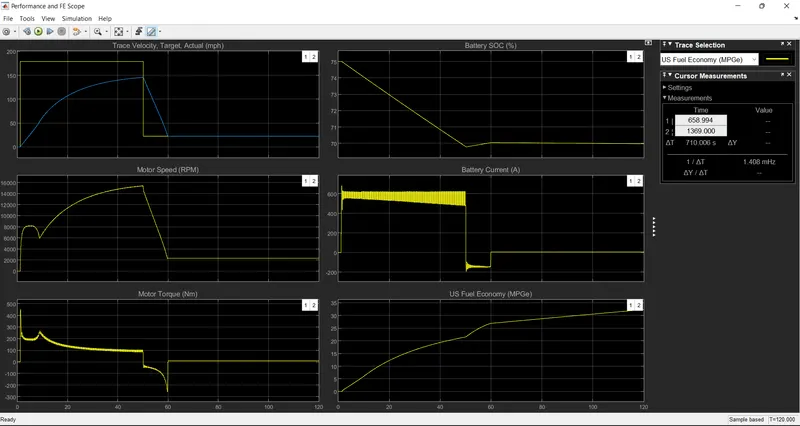
Hybrid EV:
In the above two pictures you can clearly see that both the hybrid and pure ev models graphs holds more or less same value in every aspects except battery current . in the case of hybrid ev the battery current variation is less but in the case of pure ev it is oscillating more.