Week-4 Challenge WOT Condition Part-2
CHALLENGE 4 – WIDE OPEN THROTTLE CONDITION USING POWER TRAIN BLOCKSETS
1) What is the difference between mapped and dynamic model of engine, motor and generator? How can you change model type?
Difference between mapped and dynamic model of engine
| Mapped Model | Dynamic Model |
| Model uses set of steady state look up tables to characterize engine performance. | The model represents the actual component data to characterize the engine performance. |
| Mapped engine models are faster while operating. | Dynamic engine model is usually slower while operating. |
| The table provides overall engine characteristics including actual torque, fuel flow rate, BSFC, & engine out exhaust emission | They are suitable to run the diagnostics or controlling the design parameter & are suitable for runnung. |
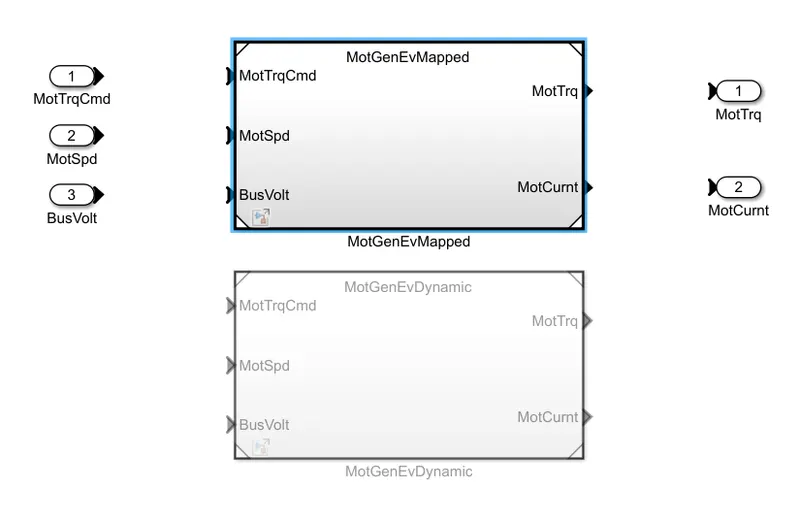
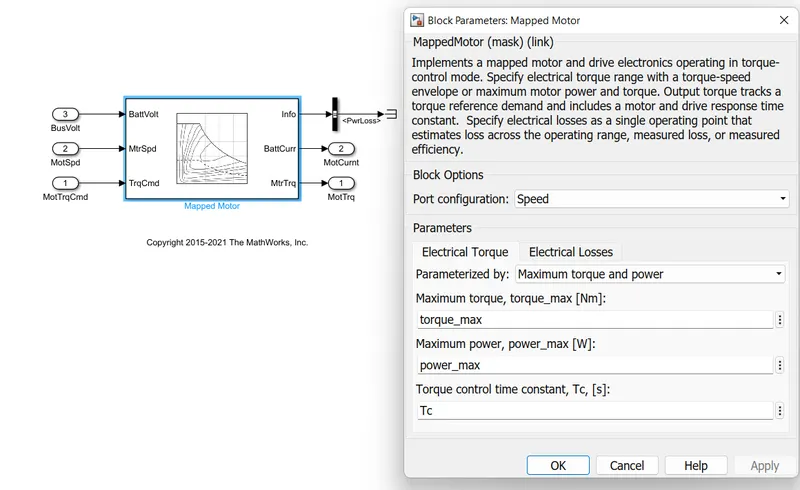
Fig- Mapped engine model
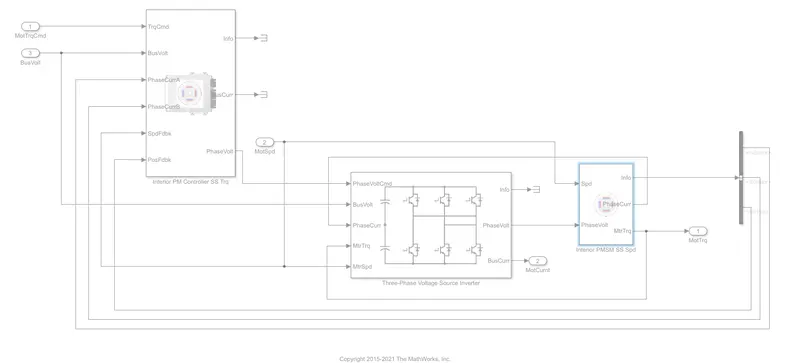
Fig-Dynamic engine model
How can you change model type?

For changing the model type simply Right click in blank space of model
then, select Varient
then, select Label Mode Active choice
then, select on which ever model you want between Motor Dynamic model or Motor Mapped model.
Difference between motor and generator?
| Motor | Generator |
| Motor converts electrical energy into mechanical energy. | Generator converts mechanical energy into electrical energy. |
| Electric motor follows Fleming's left hand rule. | Generator follows Fleming's right hand rule. |
| The working principle of a motor is based on the current-carrying conductor that experiences a force when it is kept in the magnetic field. | The working principle of the generator is based on electromagnetic induction. |
| In a motor, current is supplied to the armature winding. | In a generator, current is produced in the armature winding. |
| Eg- Ceiling fans, cars, etc. are all examples of motors. | Eg-In power stations, generators are used to generate electricity. |
2) How does the model calculate miles per gallon? Which factors are considered to model fuel flow?
Miles per Gallon is the fuel economy rating determined by how far the car can travel on a Gallon of Gasoline or Diesel for an engine powered car. In case of electric vehicles, this can be defined as the amount of distance travelled by engine powered car in a Gallon of a fuel and compared with the electric energy required by the electric vehicle to travel the same distance. i.e. equivalent energy required to propel the car through same distance.
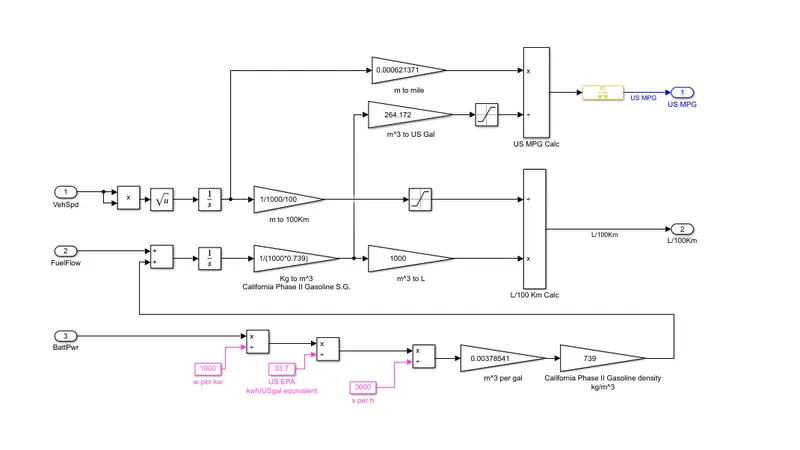
According to the model following 3 factors are involved in calculating the fuel economy rating,
- Vehicle speed.
- Fuel flow.
- Battery power.
Vehicle speed is integrated with respect to time to obtain distance travelled later which is converted to KM units. Saturation block is used bound upper & lower limits to the obtained value.
Total Battery Power is required to propel the vehicle the vehicle is simulated along the way; battery power is converted to ‘KW’ & battery rating is obtained in terms of ‘KWh’. Several gain blocks with constant values are used to get the mass flow rate of fuel in Kg/ m3.
The above value is fed back as input in the Fuel Flow back, using these values along with the gain blocks fuel consumption ‘Litres’ is calculated by the results obtained from vehicle speed and fuel flow, the total amount of fuel to run vehicle for 100 Km is obtained (L/ 100 KM).
For evaluation of MPG – Consider the fuel flow value in m^3, and convert it into US Gal by multiplying with 264.17 in gain block and saturate the limits.
3) Run the HEV ReferenceApplication with WOT drive cycle. Change the grade and wind velocity in the environment block. Comment on the results.
The simulation is been run for wide open throttle condition assuming grade & wind velocity to be zero.
Nominal speed – 80 Mph
Time to start deceleration – 60 Sec.
Simulation time – 100 Sec.
Wind velocity – 0 m/s.
Grade – 0.
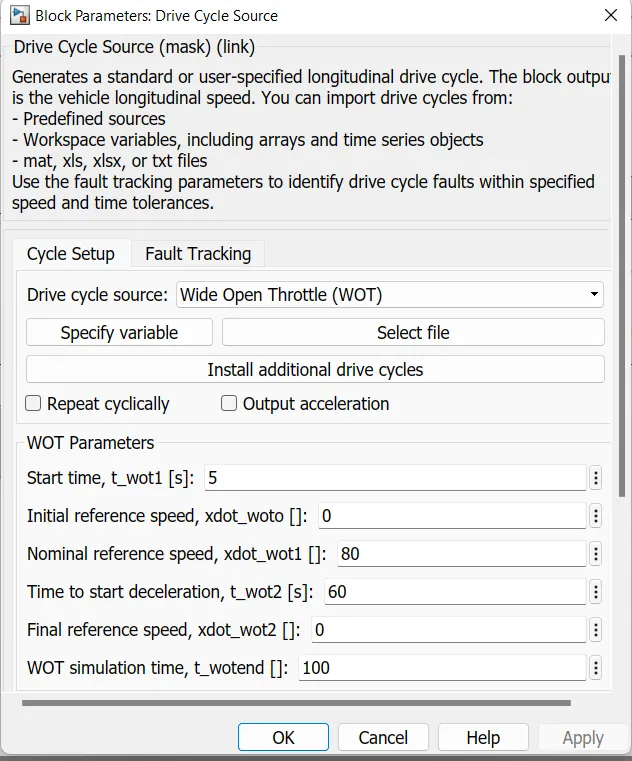
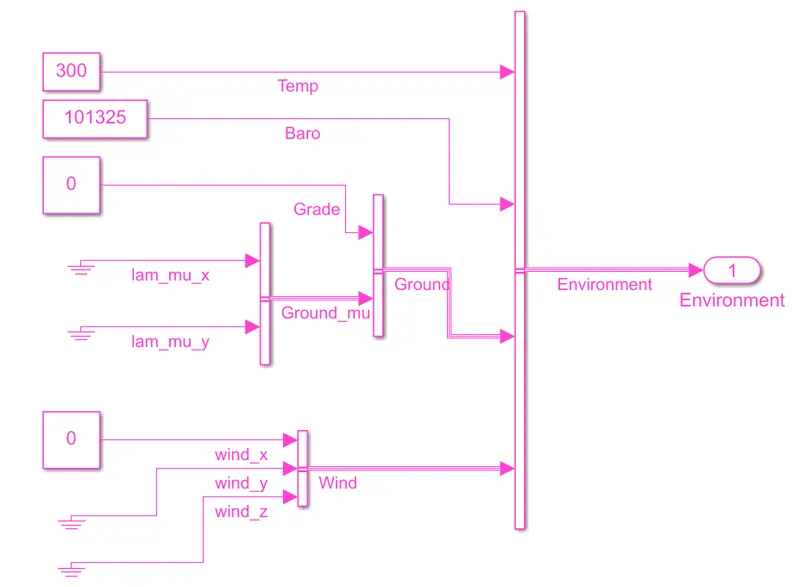
we got the simulation results for WOT Condition. Here we applied a step command of full velocity, this is called wide open throttle condition.
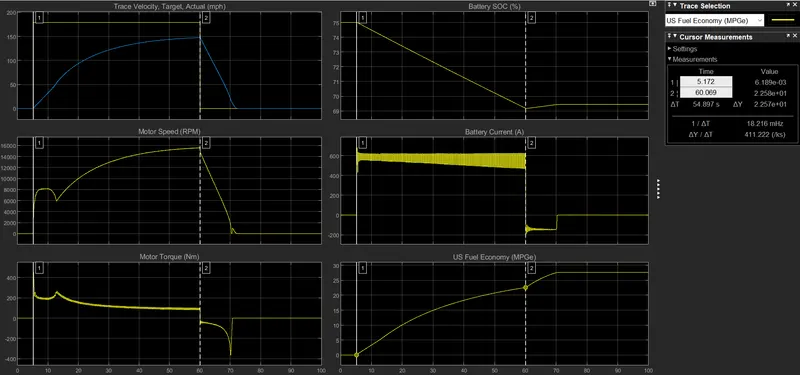
It can be be seen that the step command is been applies and we can see the acceleration in blue curve & followed by deceleration time. Acceleration time 54secs. It should be noted that here acceleration time is high because of maximum motor power. In this case the motor power is limited by certain value. Here limiting factor is current.
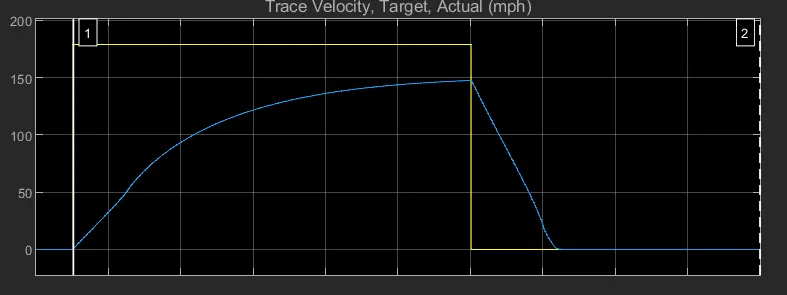
Plot – Trace & actual velocity
Maximum velocity achieved = 145 Mph
Time taken to attempt maximum acceleration – 54 sec.
Time taken to decelerate – 12 sec.
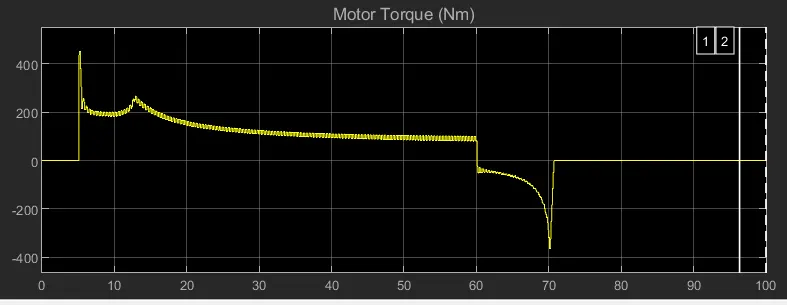
Plot – engine, motor, generator torque
while accelerating a positive torque is been observed, as soon as vehicle is been applied with brakes the vehicle starts to decelerates, thus the torque becomes negative, speed being positive this mode is called as regenerative braking mode. Here the motor acts as a generator thus charging the battery during this mode.
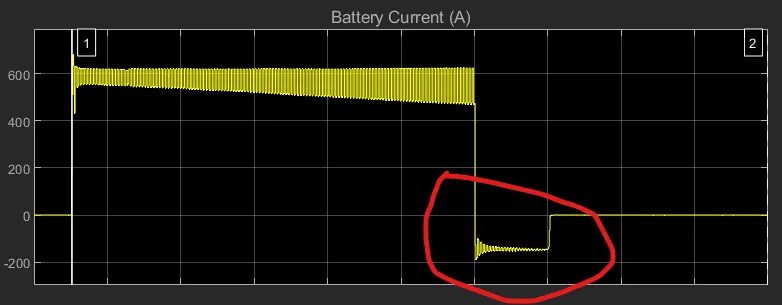
Plot – battery current
The negative current shows that the battery is charging during this mode. The battery will charge until the kinetic energy is present in vehicle as soon as further acceleration is applied the charging of battery stops at 70 sec . Further charging stops after 70secs.
Reduction in SOC from 75% - 69%. Therefore 6% SOC reduction.
Fuel economy can be seen to be 27.
Changing the parameters for WOT 2
Nominal speed – 80 Mph
Time to start deceleration – 60 Sec.
Simulation time – 100 Sec.
Wind velocity – 10 m/s.
Grade – 5.
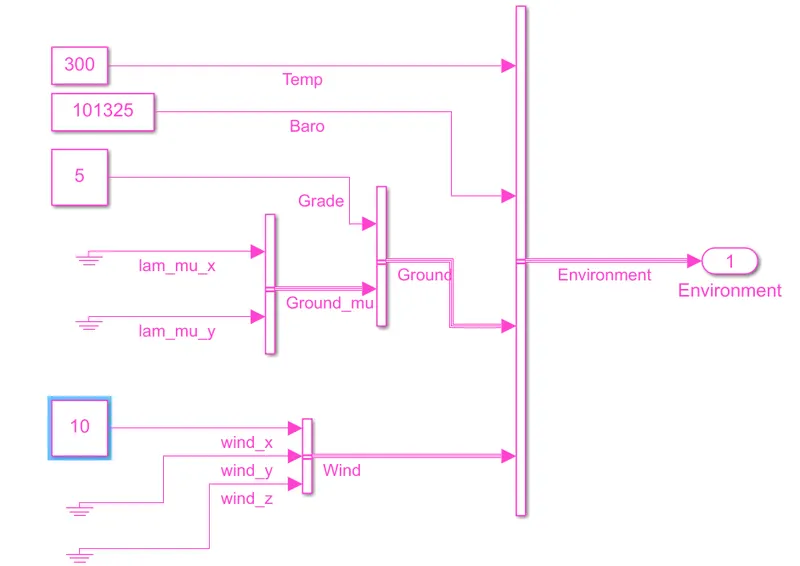
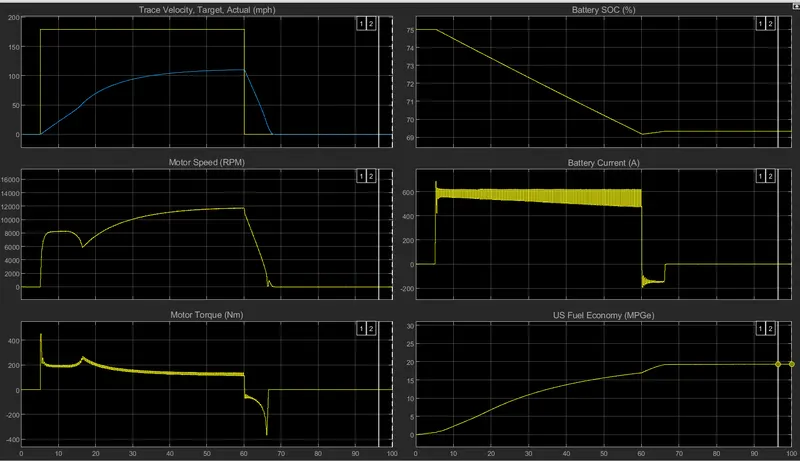
Plot – Trace & actual velocity
Maximum velocity achieved = 110 Mph
Time taken to attempt maximum acceleration – 55 sec.
Time taken to decelerate – 6 sec.
In this case because of addition of wind & Grade the maximum velocity achieved by vehicle in 55sec is reduced to 110mph which in previous case was 145mph. Also the deceleration time is reduced, so as the battery charging time is reduced to 6sec.
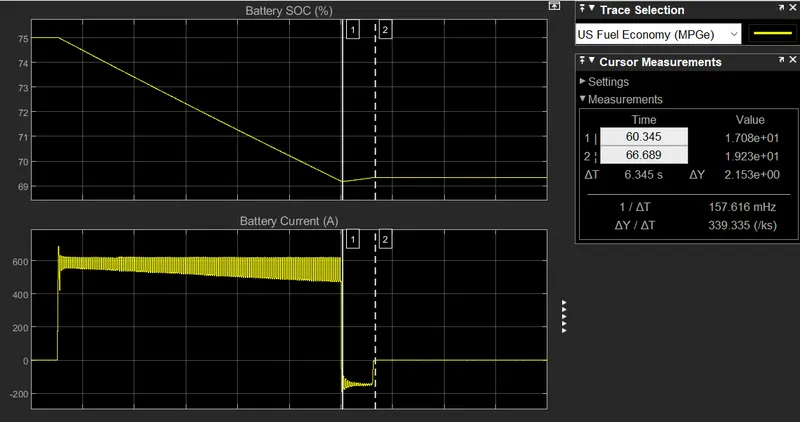
Fuel economy can be seen to be 19.
Following points can be concluded from above both the conditions.
- here exists a difference between actual velocity curve and the input curve due to the limitation on maximum power available from propulsion/ energy sources.
- Limiting factors involves current or battery module.
- The maximum speed achieved in simulation 2 is lesser compared with simulation simulation 1 because of opposing wind force & presence of grade angle.
- The battery SOC also decreases considerably with the increase in traction forces.
- Fuel economy falls to greater extent with the increase in demanding traction power.
4) Keeping all other parameters same, compare the simulated results of hybrid and pure electric powertrains.
The model for Hybrid vehicle is been run for WOT condition.
Nominal speed – 80 Mph
Time to start deceleration – 60 Sec.
Simulation time – 100 Sec.
Wind velocity – 10 m/s.
Grade – 5.
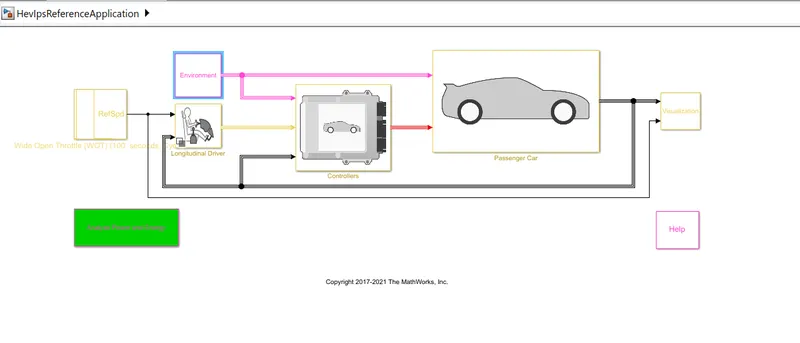
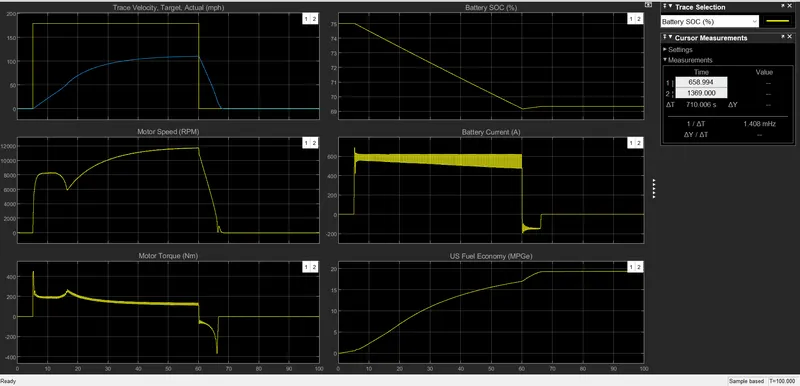
Plot1-Pure EV
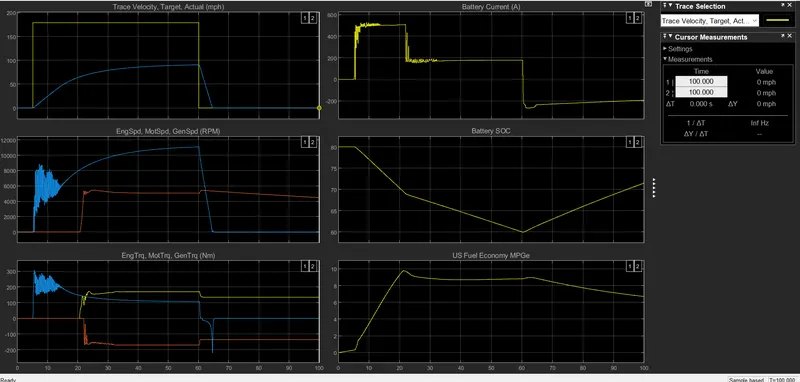
Plot2- For HEV
The results can be observed through the above graph plots.
Plot1 shows the simulation results for Pure EV with WOT Drive cycle with Grade angle of 5 & Wind velocity of 10m/s.
Plot2 shows the simulation results for HEV with WOT Drive cycle with Grade angle of 5 & Wind velocity of 10m/s.
In HEV it can be observed that the acceleration quit decreases in EV it was near about 110mph and in HEV it was near 90mph. So it can be said that EV has higher acceleration than HEV.
Talking about battery current in EV the battery current was maximum i.e 600Amp for 60sec. In HEV the max current was 600Amp for 20 secs, After 20sec the HEV starts using engine power along with Battery power upto 60sec.
The Battery SOC in case of EV from 0-60sec battery soc is reduced from 75 to 69%. In case of HEV it can be seen from 80% to 60% i.e 20% of SOC used for 60sec. But in case of Pure EV it is only 6%. Therefore Pure EV has better SOC% than HEV.
At 60sec the deceleration starts and now in this mode regenerative braking starts.The Pure EV charges through motor operating in generator mode until their is kinetic energy stored in vehicle then the charging stops and battery stops charing. In case of HEV The battery charges from generator and after that the battery charging is done by Vehicle Engine power & battery SOC can be seen increasing.
The advantage of HEV is that you have option when to use engine power & when to use Battery power for transmission.
Also battery can be charged in braking mode aswell as can be charged by engine power.
Talking about Fuel economy in case of EV it can be seen to be near about 18. In case of HEV it is greater when vehicle is operating on battery & decreases when vehicle is running on engine power. Fuel economy in case of HEV depends upon which power is been used by vehicle. Generally HEV has lower fuel efficiency than EV but higher then conventional CI engine vehicle.