Week-4 Challenge WOT Condition Part-2
QA:1
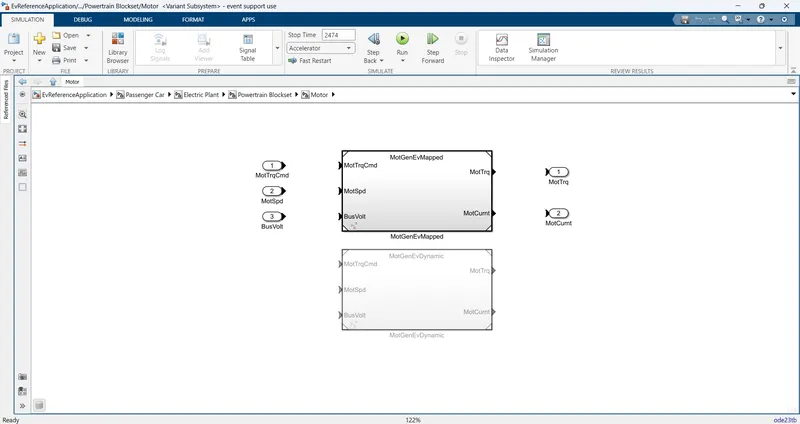
Mapped Model (Static model):
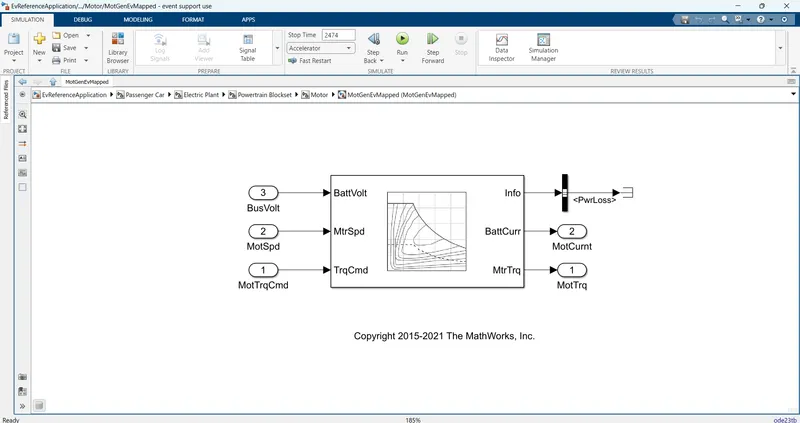
*The mapped model uses a steady-state lookup table (which is nothing but a set of predefined data sets) to characterize the engine/motor and generator's performance. It is generally used for the quasi-steady-state simulations.
* Run based on data even in the lookup table (Run faster) (Give available input).
*Lookup tables provide overall enginr characteristics,including actual torque,fuel flow rate,BSFC and engine-out exhaust emissions.
* The accuracy of this type is not that high but the simulation will be done in much less time as it does not run by real time parameters.
Mapped Model for Electric Motor :
Dynamic Model:
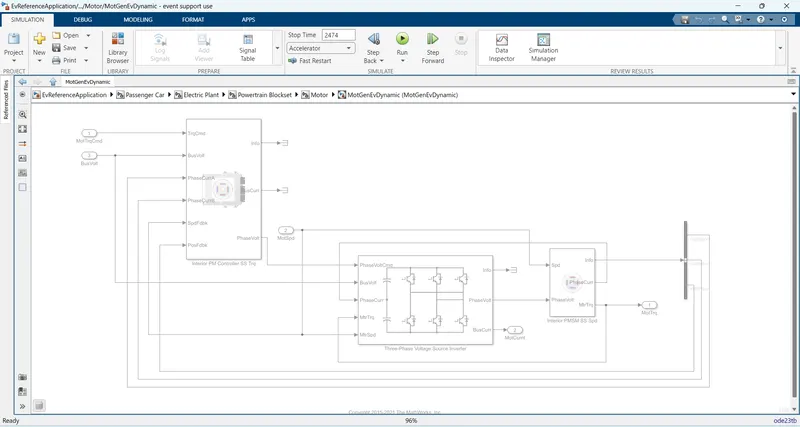
*Model decomposes engine behaviour into engine characteristics that are separated into lower-level components.By combining components in this way,the models capture the dynamic effect.
*uses the combination of the outputs from various subsystems to generate the output.
*It runs by real time simulation where the required input from the drive cycle is taken and for that individiual real time simulation gets performed and summing all the results of the subsystem gives the output for the simulation.
* Accuracy of this model is very high as it considers the real outputs from all the subsystem to generate the output.
* simulation will take very long time to complete as it has so many individual simulations running by all the subsystem of the engine , motor/generator.
Dynamic Model for Electric Motor :
To change the model type;
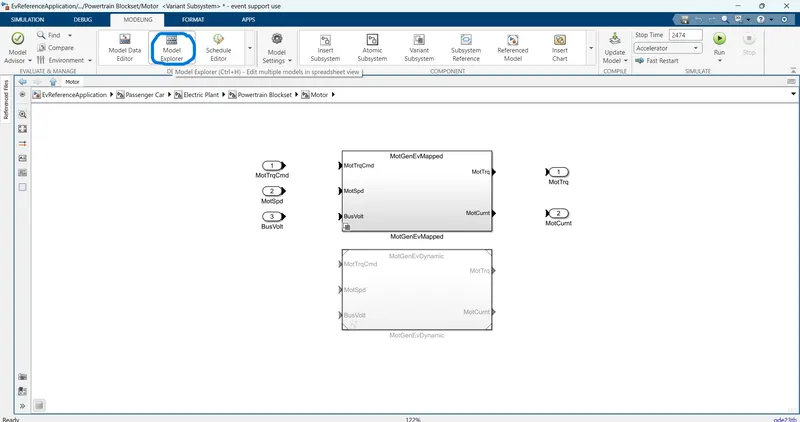
*Open the powertrain module blocks for the required vehicle.
*Click on passenger car/vehicle block and select an electric plant or engine.
*Right-click on Engine/EV motor/generator based on the vehicle model and select subsystem & model reference.
*In subsystem & model reference selecting option convert to the variant subsystem.
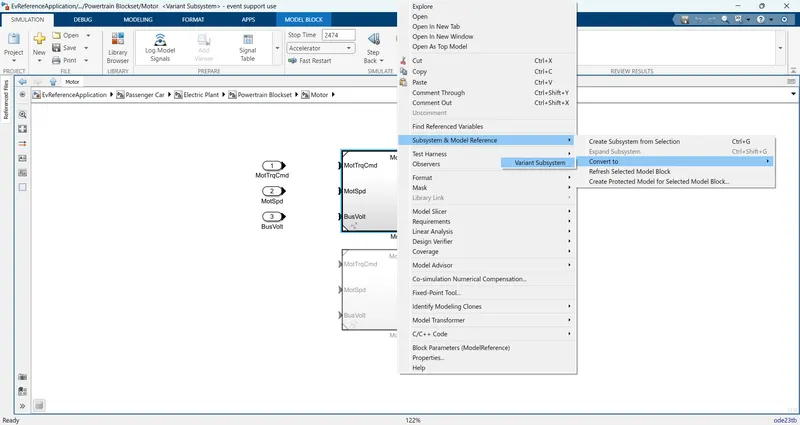
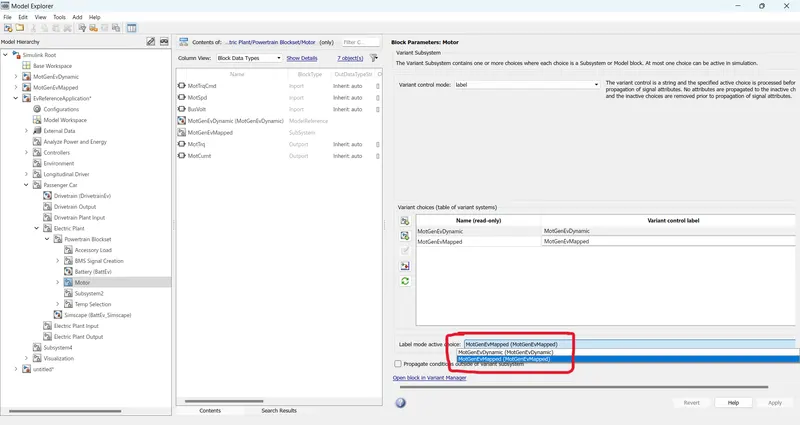
* Then by using model explorer;
* The model type can be changed as shown in the below;
QA:2
Miles per gallon :
MPG, or miles per gallon, is the distance, measured in miles that a car can travel per gallon of fuel. MPG is also the primary measurement of a car's fuel efficiency.The higher a car's MPG, the more fuel-efficient it is.In the case of an electric vehicle, this is a measure of how much electrical energy is consumed by the battery pack to travel a fixed distance.
Per gallon of gasoline-equivalent for electric cars:
Burning one gallon of gas produces 121.3MJ. To generate the same amount of heat by way of electricity, it takes 33.7 kilowatt-hours (kWh). So if an electric vehicle can travel 100 miles on 33.7 kWh of electricity, then we can rate it at as 100 MPGe.
The power train block set has a model that calculates the miles per gallon for all kinds of vehicles.
In the Visualisation block of HEV/EV while doubleclicking we can see performance calculation block as shown below;
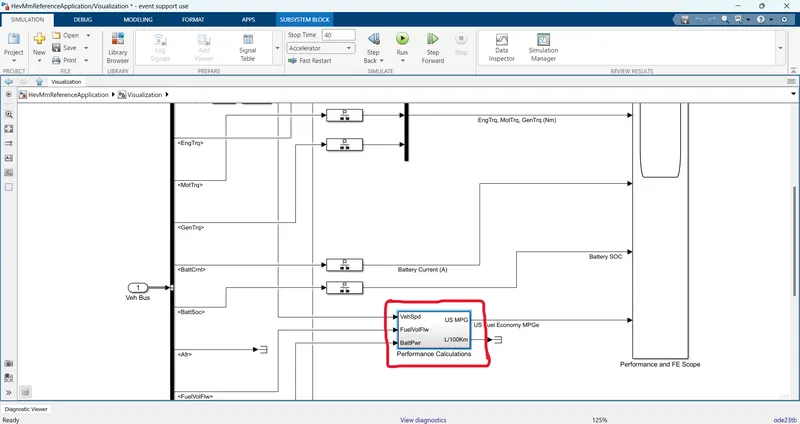
Inside the performance calculation block we can calculate the miles per gallon ;
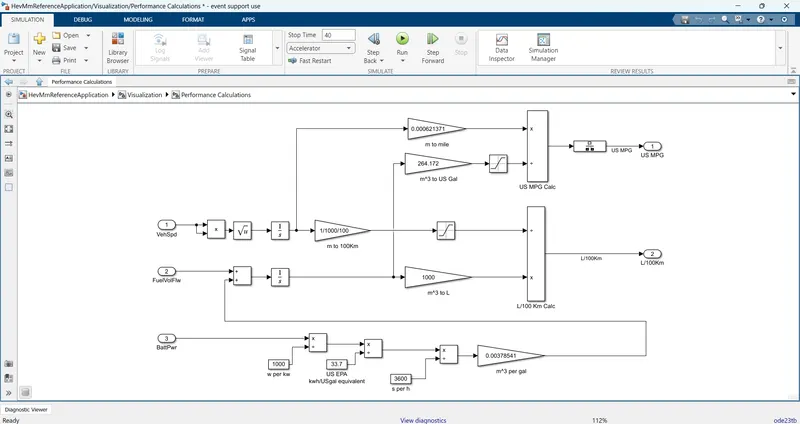
The above model takes the input of the Vehicle speed , Fuel flow and Battery power to calculate the fuel consumption and the equivalent battery consumption and calculates the miles per gallon.
Vehicle Speed And Fuel Flow:
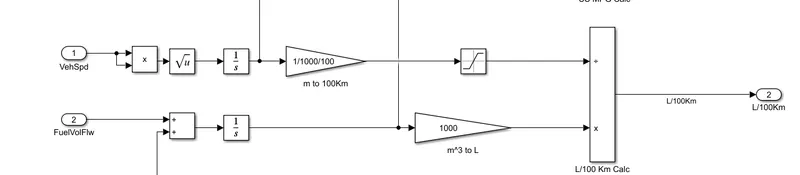
*The Vehicle speed is a important factor while considering the fuel consumption at that particular time,so to determine the fuel consumption throughout the drive cycle.
*To convert speed to Distance we can Integrate with time and we are doing the same of converting the velocity to get distance covered by integrating.
*Then the Fuel flow is expressed as the mass flow rate (i.e) the amount of fuel at each moment in Kg/Sec. Now integrating this will result in the mass of the fuel and by using this 1 we convert it to the volume and by multiply by 1000 to get it in Litres.
*By comparing the two results we can get the amount of litre consumed to Run for 100km.
Battery Power:

*The amount of Energy from battery power required to propel the vehicle Equivalent to that of the Engine is calculated in this section.
*The battery power is given in watts and it is converted to Kw by dividing with 1000.
*Then we convert the power into energy by multiplying with the time into KWh.
*Then we convert the Energy from kWh to equivalent energy in US gallon of automotive gasoline by dividing with 33.7.
* since we get the energy in US Gallons equal in KWh we are trying to get the energy of equivalent LIS Gallons per seconds and we do this by dividing with 3600 and we convert the hour to seconds.
*It is multiplied by standard value 0.00378541 to get volume in meter cube per gallon and it is added to the fuel flow for total value as it is an HEV
Calculating Miles Per Gallon :
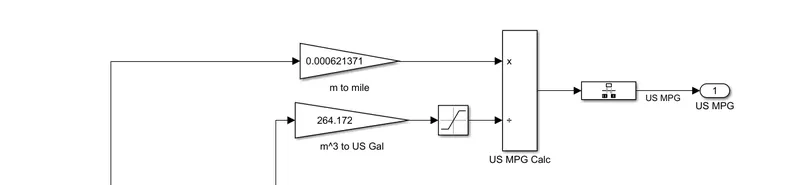
*The inputs from the vehicle speed (i.e) the distance we found (in meters) is taken into the calculation and it is converted to the miles by multiplying with 0.000621371.
*Then the inputs from fuel flow (Battery energy + Fuel energy) taken in m^3 and is converted into equivalent US Gallons by multiplying with 264.172.
*Then the two inputs ie Miles covered and equivalent US Gallon is then divided and the result we get in Miles / Gallon.
Factors considered to model fuel flow:
*Vehicle speed
*Fuel flow
*Battery power
QA:3
HEV Architecture:
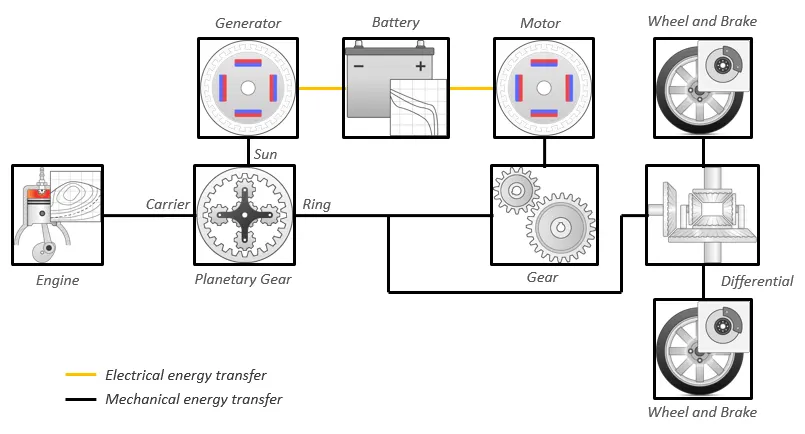
HEV reference application with WOT drive cycle :
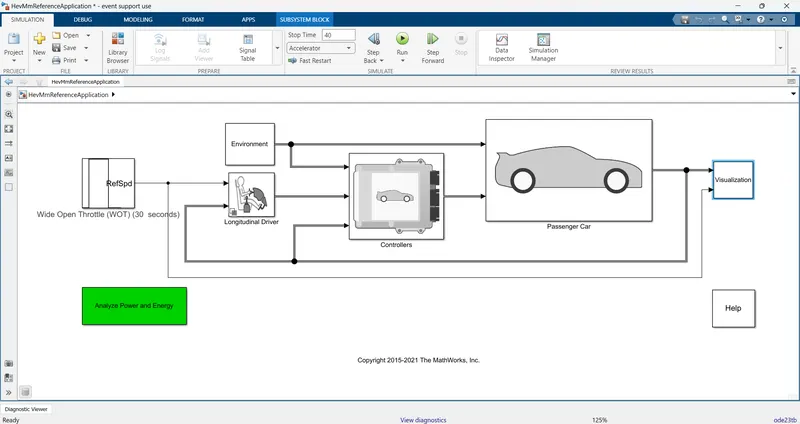
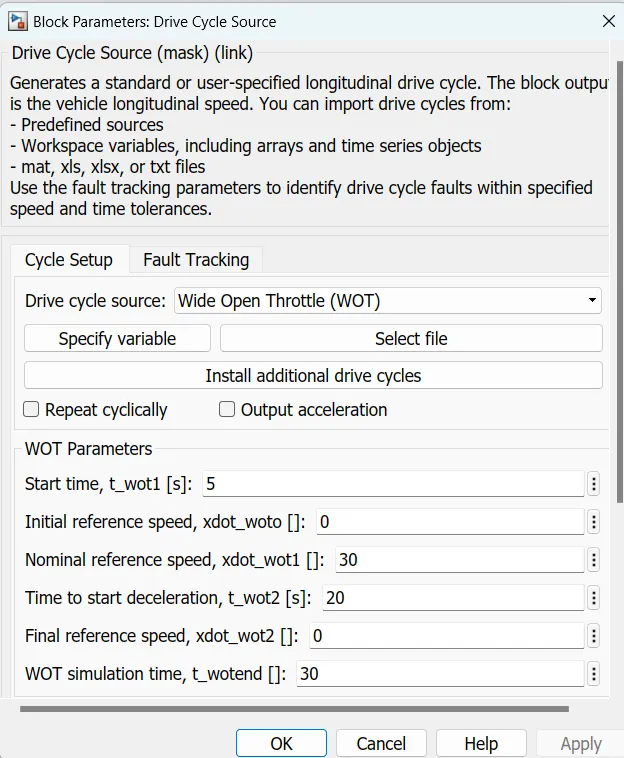
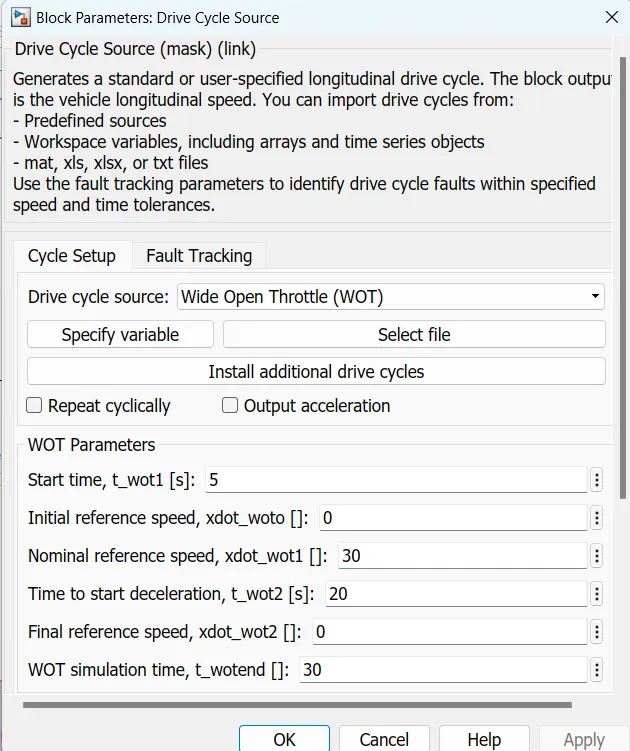
*Double-clicking on the drive cycle block this window will pop up
*In this window, we can change our drive cycle from default to wide-open throttle and also can change
speed, time, acceleration, and simulation time.
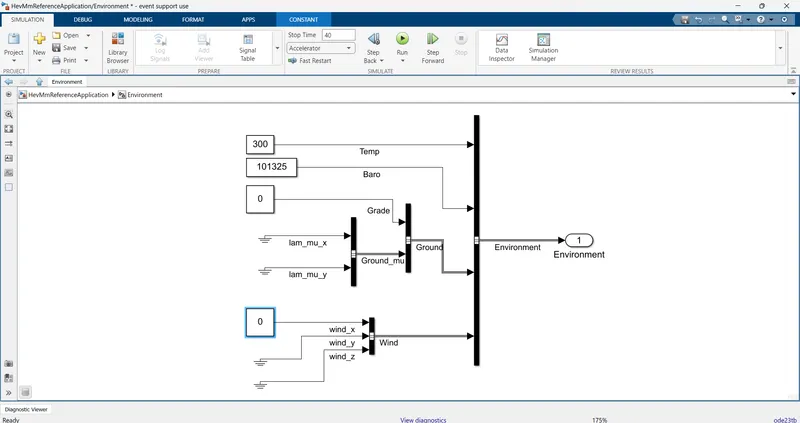
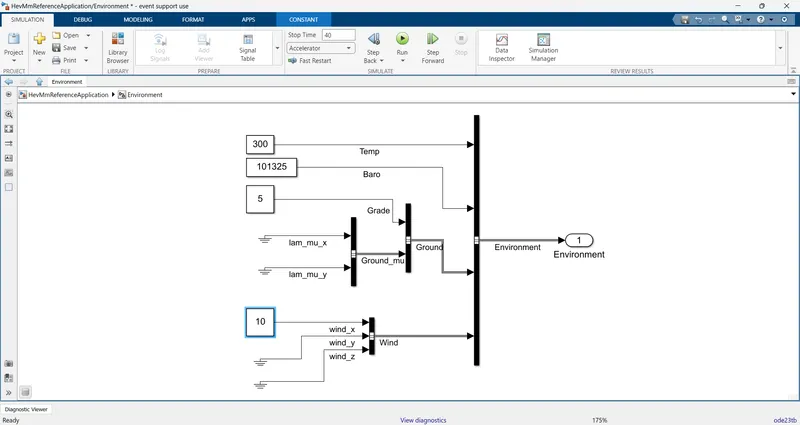
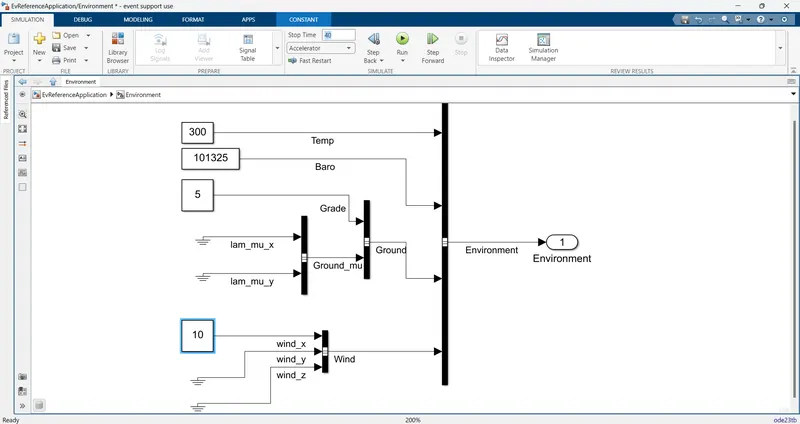
* Now when we open the environment block we can see this window where we can change the grade and wind velocity ,in this case we are not changing the grade and wind velocity.
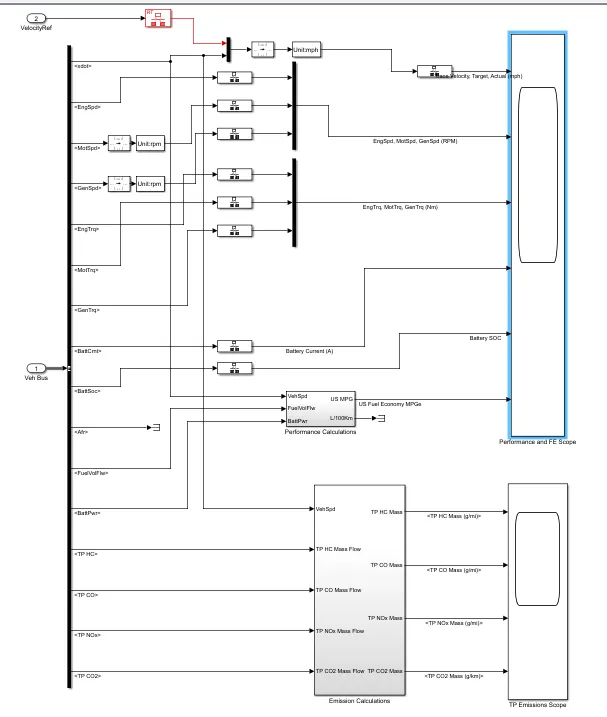
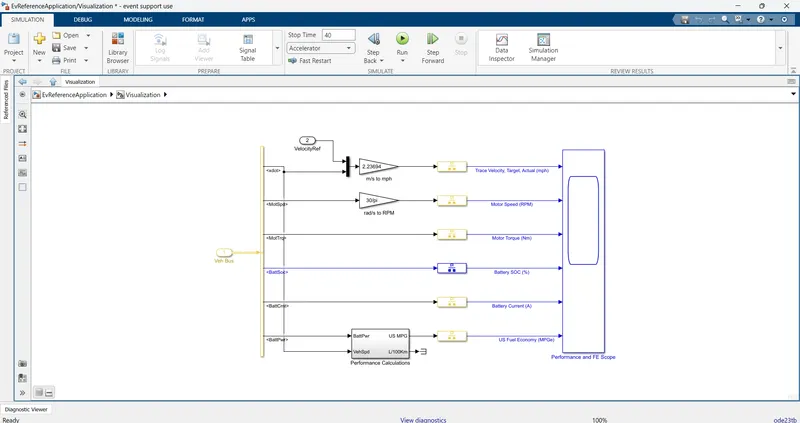
*After clicking on the visualization block we can see this window where the FE scope can be obtained.
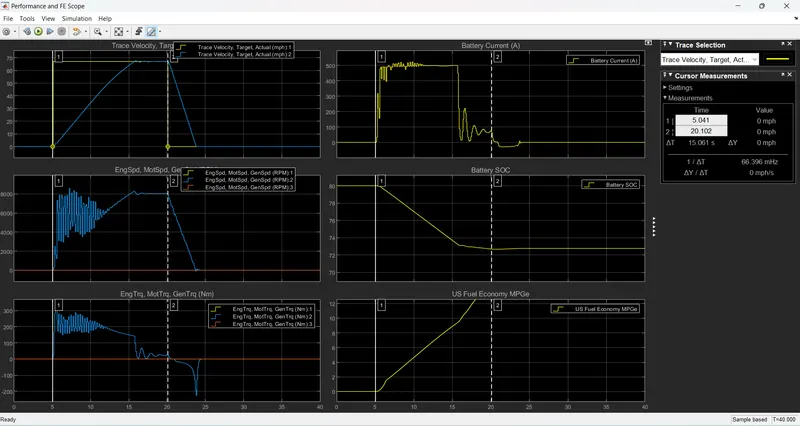
PERFORMANCE AND FE SCOPE :
Now we will put grade value and wind in the x-direction in the environmental block to see a difference in results:
Grade =5 degree and Wind velocity=10 m/s
PERFORMANCE AND FE SCOPE :
Considering the default state of drive cycle :
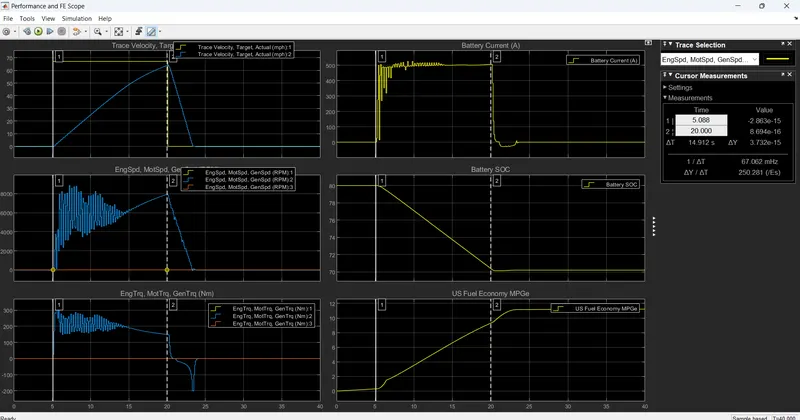
Plot 1: Trace Velocity, Target, Actual(mph)
* It shows the velocity of the vehicle for the Drive cycle data with the Time scale on the x-axis.
*The yellow line indicates the trace velocity and the blue line indicates the actual velocity .
The start time of the vehicle is about 5 seconds and reaches the top speed at 20 seconds.
Here we can see that vehicles requited around 20 sec to attend maximum speed toward the target path by using battery power alone. After that vehicles started to decelerate.
Plot 2: Engine Speed, Motor Speed, Generator Speed(RPM)
*As the battery is fully charged, an initial condition is only used by the motor(blue line) .
*It shows the changes in the speed of the engine, motor and generator in rpm throughout the drive cycle.
*which is high at starting because of resistance due to slope & wind velocity. The engine speed (yellow indication) is overlapped with generator speed ( orange indication) indicating both running on same rpm.
*when the battery is discharging or when the state of charge(SOC) comes below 74% then engine will start to rotate to provide and maintain the speed of the vehicle and so far generator will also start to charge the battery at the same time. Hence their rpm are the same.
Plot 3: Engine Torque, Motor Torque, Generator Torque(Nm)
It shows the torque characteristics and its changes of engine, motor and generator in (Nm) throughout the drive cycle.
As the battery is being used during the start time the torque value of motor during this time will be high until the vehicle meets its maximum speed and the speed reaches to its maximum the torque value gets reduced.During deceleration the torque value will go negative indicating it as low value and it becomes constant when the battery goes to charging state because engine torque is used below 74% SOC .The generator torque will be negative when motor is charging and at this time engine overcomes the torque requirement of vehicle.
Plot 4: Battery Current (A)
It shows the battery current values (A)
When a vehicle uses an electric motor then only it is used to generate the power for the motor, when the vehicle accelerates, then no current is extracted to produce power for the motor. from the graph we can see, the current requirement becomes stable when the battery charging mode is activated.With Wide-open throttle specification, the powertrain draws maximum current from the battery and stabilizes as the conditions are met and the engine is activated.
Plot 5: Battery SOC
It shows the battery state of charge SOC (%) and its changes corresponding to the driving inputs.From the graph, it can be seen that when the battery is below 74% , it goes in charging mode and hence SOC is also increased due to charging of the battery through the generator. The state of charge decreased from 80% to 73% of charge for the specified driving conditions.
Plot 6: US Fuel economy MPGe
Shows the Fuel Economy as Mile per Gallons for the corresponding input driving conditions.As we can see in the plot the vehicle achieved its maximum speed at 15th second and speed becomes constant for about 5seconds, the fuel requirement also increased with the increase in speed.After the 20sec the vehicle speed decreased and thus the fuel requirement also gets reduced .
After change in grade angle and wind velocity :
*with the increase in grade angle and wind velocity ,actual velocity is decreased and didnt meet the desired velocity,also deceleration time is reduced.
*Speed is also decreased,as increase in grade angle affects the load on engine.
*Battery current have more fluctuations at higher values.
*Battery SOC is almost similar but when battery is below 72% ,it goes in charging mode.
*As the vehicle will require more power the fuel economy is decreased.
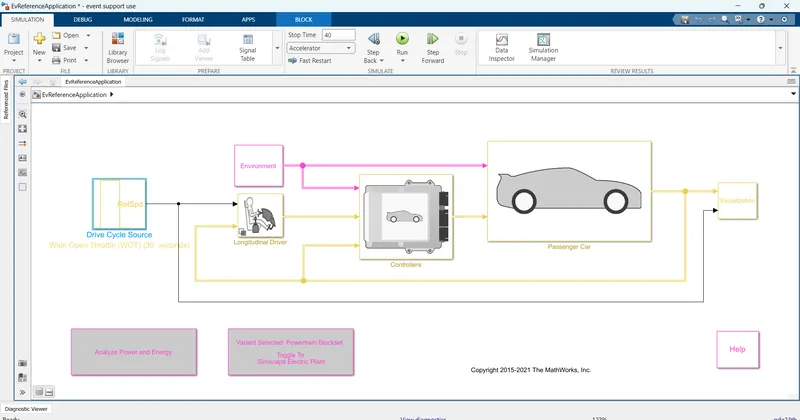
QA:4 After keeping all the parameters same and simulating pure electric powertrains;
PURE ELECTRIC VEHICLE POWERTRAIN:
ENVIRONMENT BLOCK:
VISUALIZATION BLOCK:
PERFORMANCE AND FE SCOPE :
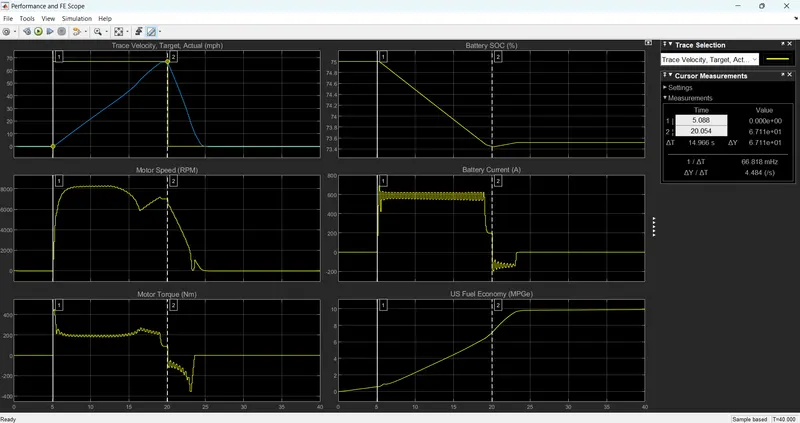
By comparing the plot of EV & HEV model having same parameters,we can conclude that;
*Velocity is less in EV as compared to HEV
*Motor speed is less in EV as compared to HEV
*Torque is high in EV compared to HEV
*EV draws more battery current
*Charging in HEV is higher
*Fuel required in EV is higher