Week-4 Challenge WOT Condition Part-2
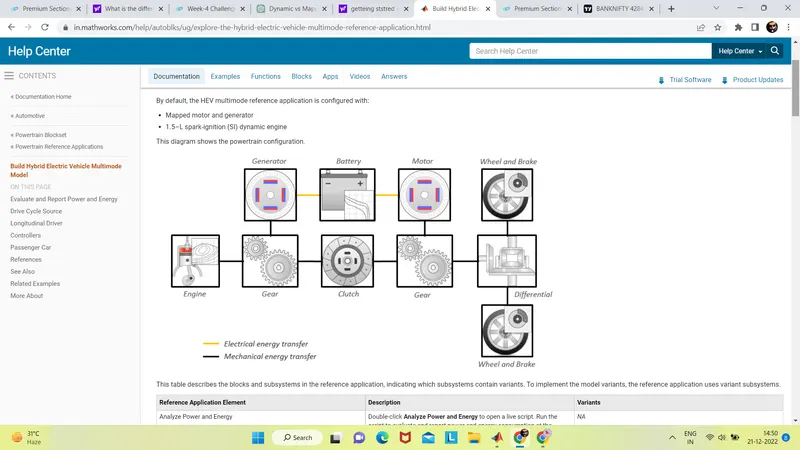
1. What is the difference between mapped and dynamic model of engine, motor and generator? How can you change model type?
answer:
In the context of electrical engineering, a dynamic model is a mathematical representation of the behavior of a system over time. It can be used to predict the system's response to different inputs and to understand how the system will behave under different conditions.
A mapped model, on the other hand, is a static representation of the relationship between input and output variables for a system. It does not take into account the time-varying behavior of the system and is only useful for predicting the output of the system for a given set of input conditions.
Engine, motor, and generator models can be either dynamic or mapped, depending on the level of detail and complexity that is needed to represent the system. Dynamic models will typically be more accurate and allow for more detailed analysis, but they may also be more complex to develop and require more computational resources to use. Mapping models are simpler and easier to use, but they may not be as accurate or able to capture the full range of behavior of the system.
The type of model used for a particular engine, motor, or generator will depend on the specific needs and requirements of the application. In some cases, it may be possible to switch between different types of models, depending on the available resources and the desired level of accuracy. For example, a dynamic model may be used for detailed analysis and design, while a mapping model may be used for more routine operation and maintenance tasks.
Mapped model
1) In mapped model data points are pre-assigned in lookup table which would be configured with the operational parts and the analysis would be formed.
2) Model uses a set of steady-state lookup tables to characterize engine performance.
2) Output values are stored for the given corresponding input values of the motor, generator and engine
3) The accuracy is low for this system.
4) Run time simulation takes less time, because it dose not run with real time simulation.
Dynamic model
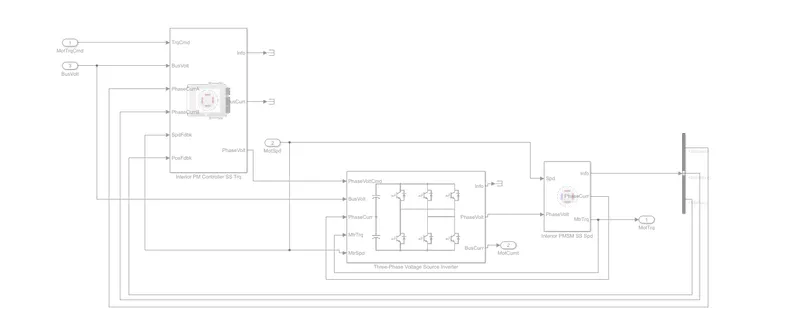
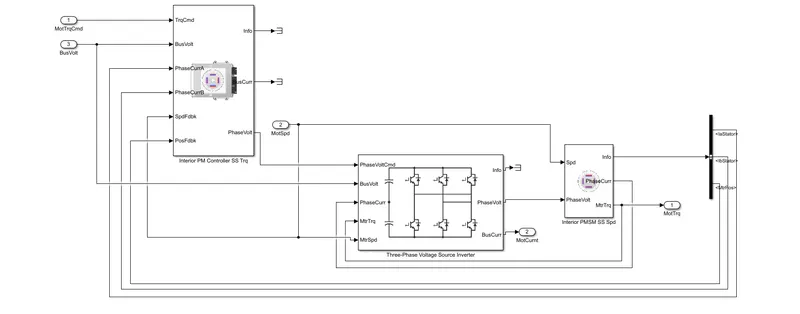
1) Dynamic model runs by real time simulator.
2) Dynamic model uses the combination of output from various subsystems to generate output.
3) The accuracy of dynamic model is very high.
4) Run time simulation takes more time.
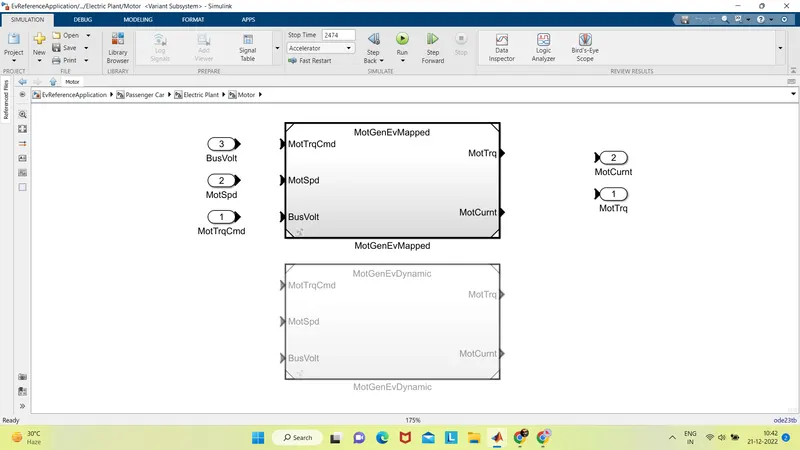
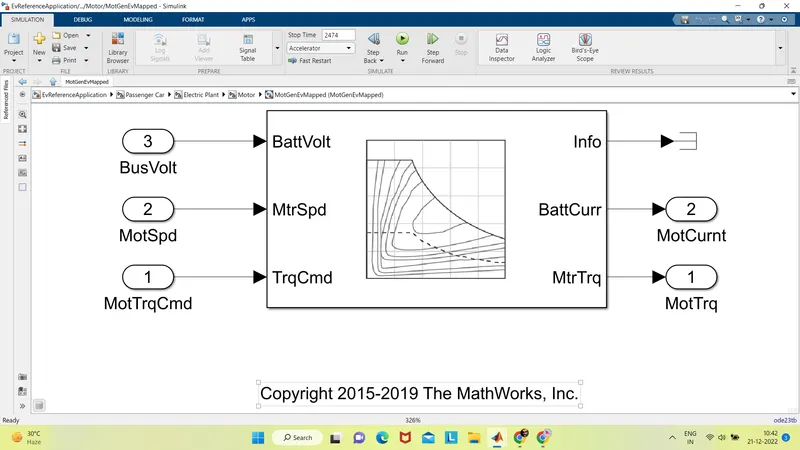
Steps to change model
1) Select vehicle type in powertrain blockset model.
2) Go to the passenger block in the simulink model of Electrical Vehicle motor/Generator.
3) Right click on block and go to variance label mode active choice MotorGenEV Mapped or Dynamic.
----------------------------------------------------------------------------------------------------------------------------------------------------------------------------------------------------------------------------------------------------------------
2. How does the model calculate miles per gallon? Which factors are considered to model fuel flow?
answer:
Miles per gallon (MPG) is a measure of fuel efficiency, which is defined as the distance that a vehicle can travel on a single gallon of fuel. The MPG of a vehicle can be calculated by dividing the distance traveled by the amount of fuel consumed.
There are several factors that can influence the fuel efficiency of a vehicle and, therefore, the MPG that it is able to achieve. These factors include:
-
Engine size and type: Larger engines tend to be less fuel efficient than smaller engines, as they require more fuel to produce the same amount of power. Similarly, engines that operate on a different type of fuel (e.g. gasoline vs diesel) may have different fuel efficiencies.
-
Vehicle weight: Heavier vehicles tend to be less fuel efficient than lighter vehicles, as they require more energy to move.
-
Aerodynamics: The shape and design of a vehicle can have an impact on its fuel efficiency. Vehicles with a more aerodynamic shape will typically be more fuel efficient, as they are less resistant to the flow of air.
-
Driving habits: The way a vehicle is driven can also have an impact on its fuel efficiency. For example, accelerating and braking aggressively can reduce fuel efficiency, as can driving at high speeds.
-
Road conditions: The type of terrain and driving conditions can also influence fuel efficiency. For example, driving on hilly terrain or in stop-and-go traffic may reduce fuel efficiency compared to driving on a flat, open road.
-
Vehicle maintenance: Properly maintaining a vehicle can help to ensure that it is operating at its most fuel efficient. This can include regular tune-ups, keeping tires properly inflated, and replacing dirty air filters.
In order to model fuel flow, a model would need to take into account all of these factors and how they interact to determine the fuel efficiency of a vehicle. This could be done using a combination of data and mathematical equations that represent the relevant physical processes and relationships.
------------------------------------------------------------------------------------------------------------------------------------------------------------------------------------------------------------------------------------------------------------------
3. Run the HEV ReferenceApplication with WOT drive cycle. Change the grade and wind velocity in the environment block. Comment on the results.
answer:
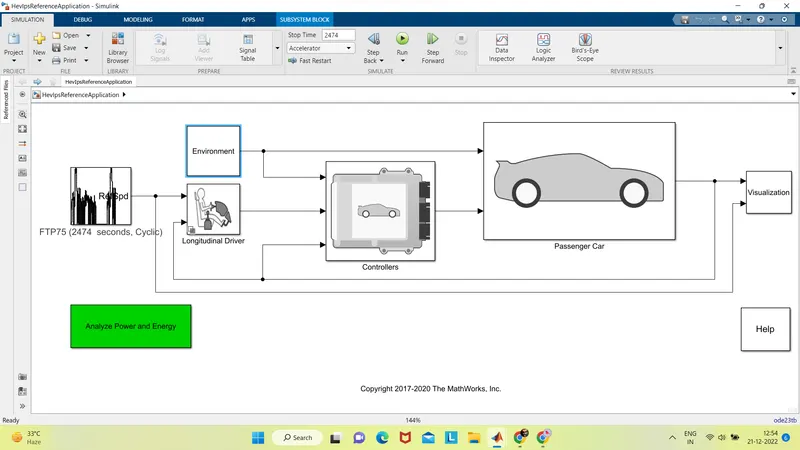
speed 80 mph
gread angle 0
wind velocity 0 m/s
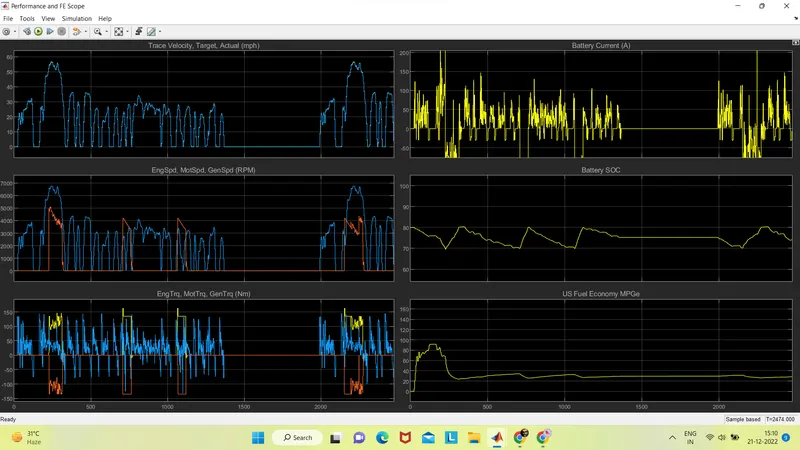
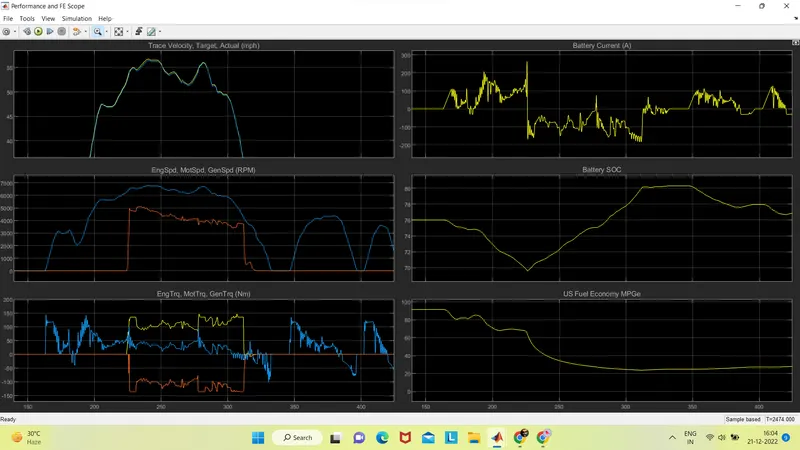
Around 1.5 seconds of time will take to reach maximum speed (80 mph)
Nearly 6.1 seconds of time will take to reach maximum speed (80 mph) to 0 mph
Plot 2 shows the speed maximum speed of motor = 9497 rpm
plot 3 shows the torque maximum motor torque = 206 Nm
plot 4 shows the current values of battery varies from 500 to 0 amps in normal mode and varies from 0 to -200 amps in regenerative braking
plot 5 shows the battery SOC SOC decreased form 80 to 62 % increased during normal condition and from 62 to 76 % during regenerative braking
plot 6 shows the fuel economy maximum fuel economy is 20.45 MPG minimum fuel economy is 7.18 MPG
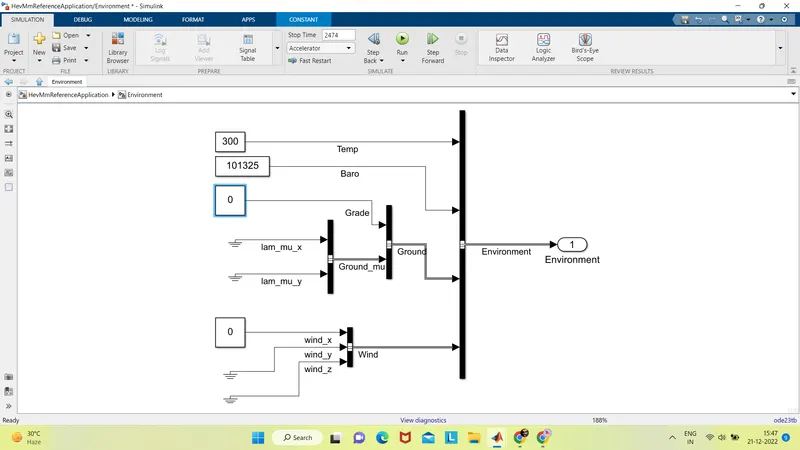
after Changing the grade and wind velocity in the environment block. Comment on the results.
speed 80 mph
gread angle 5
wind velocity 5 m/s
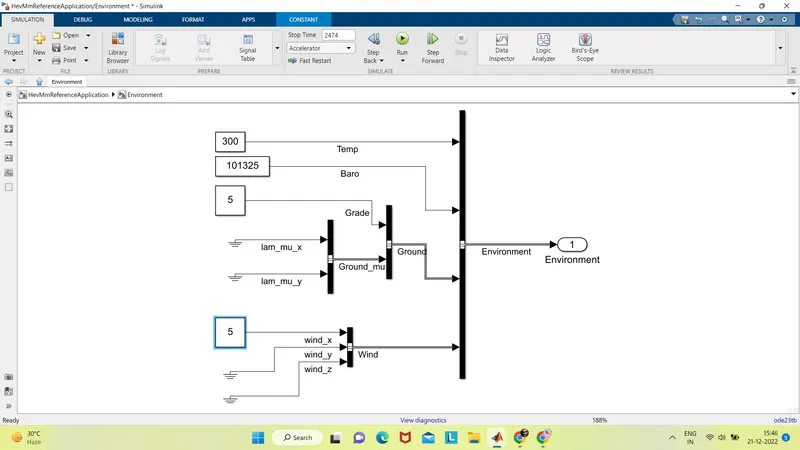
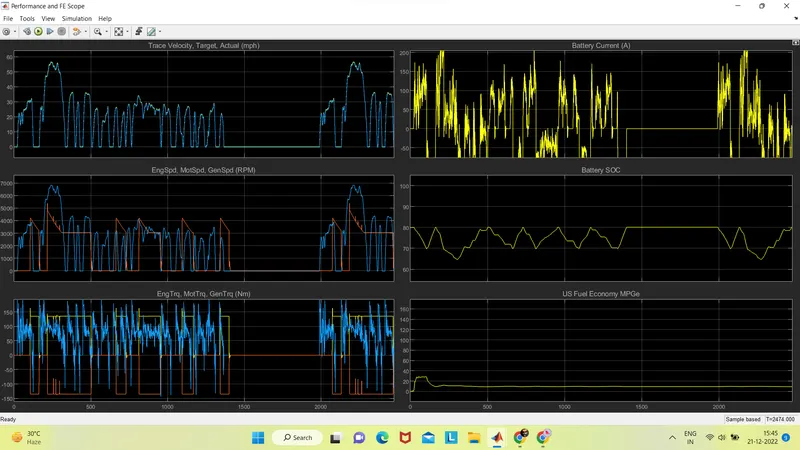
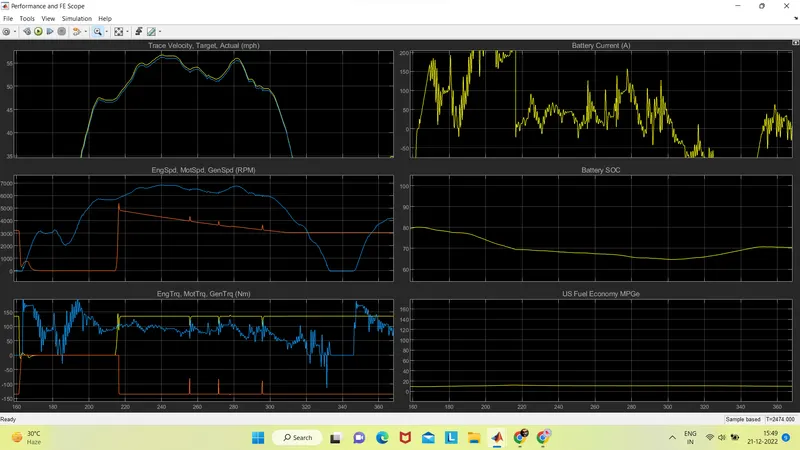 plot 1 shows Maximum 59 mph reached in 49 seconds, maximum to minimum speed reached in 4.6 seconds
plot 2shows maximum motor speed is 6254 rpm
plot 3 shows maximum motor torque is 280 Nm
plot 4 battery SOC for 80 to 75 % in 50 seconds
plot 5 battery current remains constant of 200 amps
plot 6 maximum fuel economy is 21 MPG
------------------------------------------------------------------------------------------------------------------------------------------------------------------------------------------------------------------------------------------------------------------
4.Keeping all other parameters same, compare the simulated results of hybrid and pure electric powertrains.
answer:
pure ev output
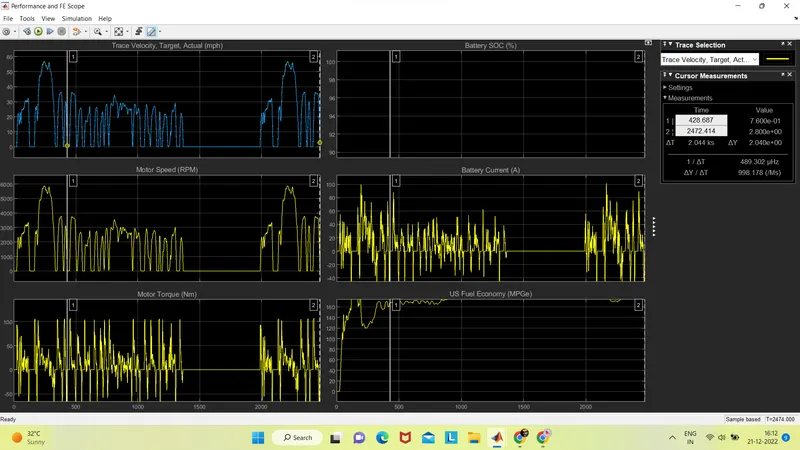
hev output
The difference between EV and HEV is for EV the source is only one i.e. electric source,