Project - Data Handling and Interpolation
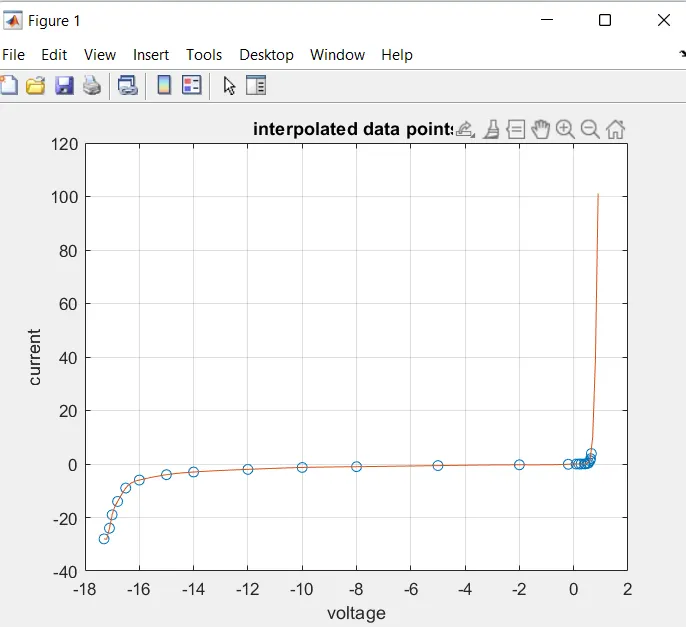
In a laboratory experiment, data of voltage and current has been recorded and the same is attached in an excel file ( Click on this link VI.xlsx ). Read the excel file in the Matlab program and perform the interpolation in the range of -17.3:0.1:0.9. Generate the interactive plot for the interpolated data and store them in a text file.
answer:
clc;
clear all;
close all;

%In a laboratory experiment, data of voltage and current has been
%recorded voltage details
v=[-17.3, -17.1, -17, -16.8, -16.5, -16, -15, -14, -12,-10, -8, -5, -2, -0.2, 0.09, 0.19, 0.27, 0.39, 0.43, 0.5, 0.55, 0.6, 0.62, 0.65];

%recorded current details
i=[-28,-24, -19, -14, -9, -6, -4, -3, -2, -1.3, -1, -0.6, -0.3, -0.1, 0, 0, 0, 0.01, 0.03, 0.17, 0.42, 1.23, 1.99, 3.91];

%to perform the interpolation in the range of -17.3:0.1:0.9
xp=[-17.3:0.1:0.9];

%interpolation format
yp=interp1(v,i,xp,'spline');

figure
plot(v,i,'o');
hold on;

plot(xp,yp,'-');

xlabel('voltage');
ylabel('current');
title ('interpolated data points');
grid on;