Week-4 Challenge WOT Condition Part-2
QUE1:What is the difference between mapped and dynamic model of engine, motor and generator? How can you change model type?
Mapped model:
Model uses a set of steady-state lookup tables to characterize engine performance.
The tables provide overall engine characteristics, including actual torque, fuel flow rate, BSFC, and engine-out exhaust emissions.
Mapped model is based on look up tables and not actual components. It is a steady state model and simulation takes less time due to simplicity.
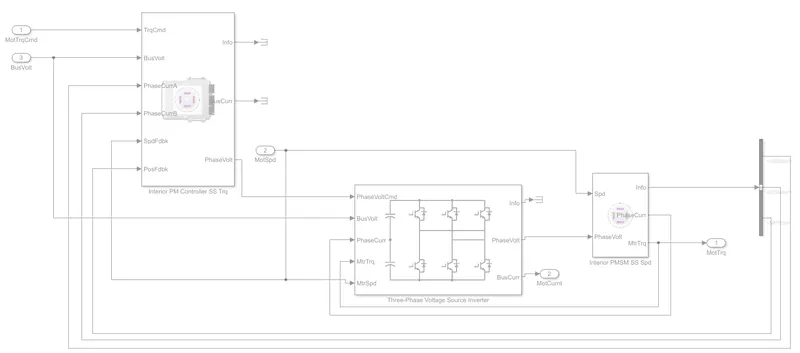
Dynamic model: Dynamic model is based on actual component model. Each component is modeled separately and simulation takes more time due to complexity.
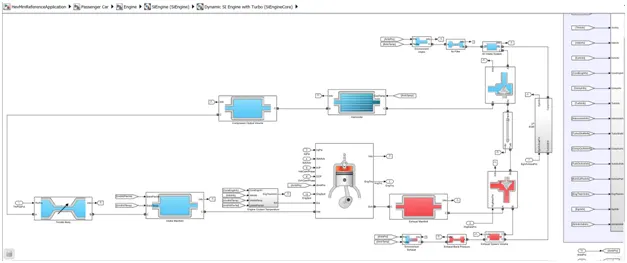
Model decomposes the engine behavior into engine characteristics that are separated into lower-level components. By combining components in this way, the models capture the dynamic effects.
mapped engine model:
The Mapped SI Engine block implements a mapped spark-ignition (SI) engine model using power, air mass flow, fuel flow, exhaust temperature, efficiency, and emission performance lookup tables.
The block enables us to specify lookup tables for engine characteristics. The lookup tables, developed with the Model-Based Calibration Toolbox™, are functions of commanded torque, Tcmd, brake torque, Tbrake, and engine speed, N. If you select Input engine temperature, the tables are also a function of engine temperature, TempEng.
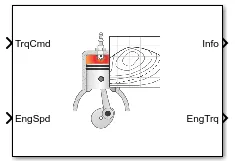
In the below model values are taken from experiments or old data 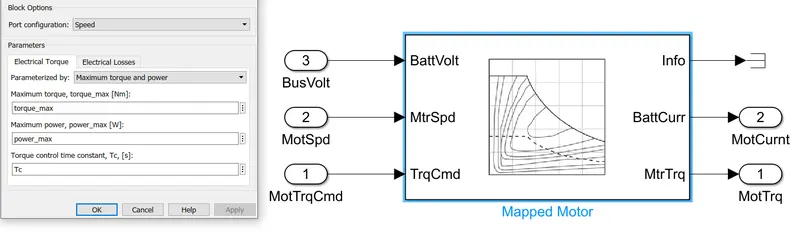
Dyanamic Engine model
DYNAMIC model of motor:
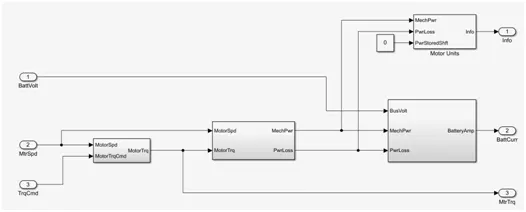
Maaped model of motor
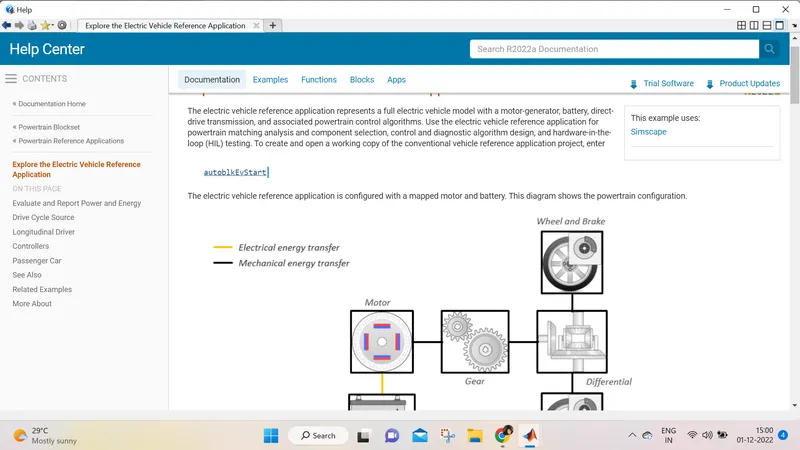
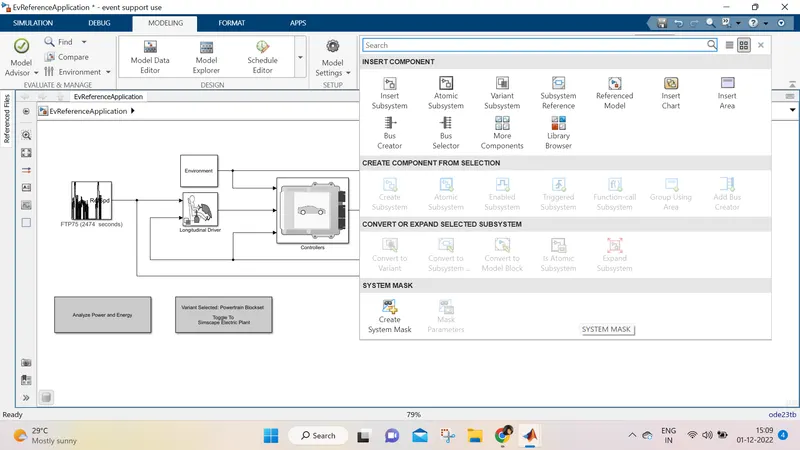
CHANGING the model type in EV powertrain blocks:
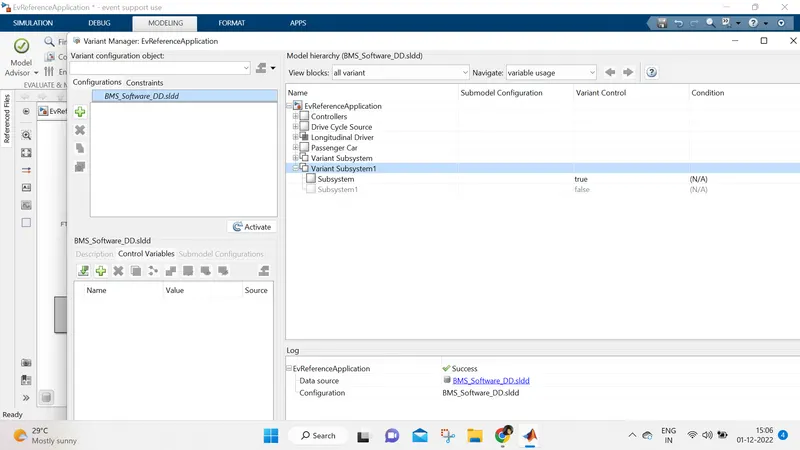
we can use the variant manager in the modeling tab to find the variant systems we have.
Go to varient maneger as shown in following fig

QUE 2:How does the model calculate miles per gallon? Which factors are considered to model fuel flow?
MPG, or miles per gallon, is the distance, measured in miles, that a car can travel per gallon of fuel. MPG is also the primary measurement of a car's fuel efficiency: The higher a car's MPG, the more fuel efficient it is.
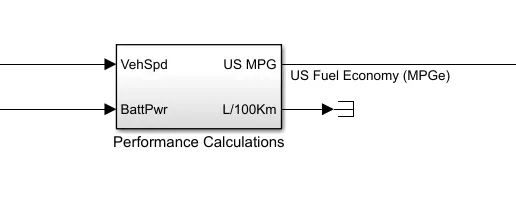
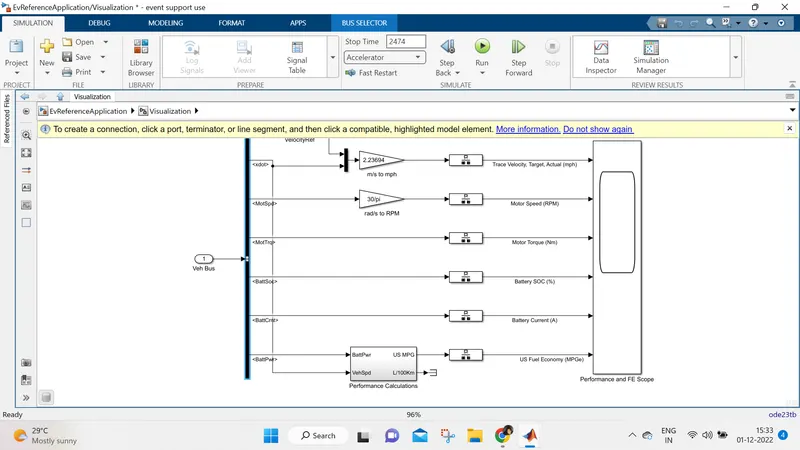
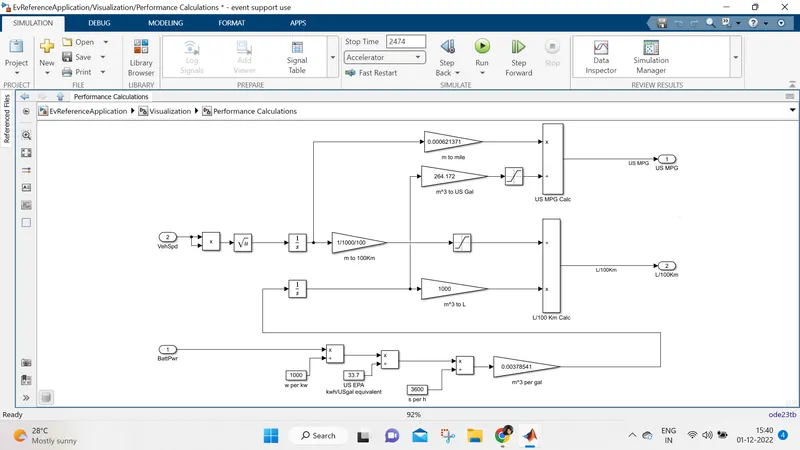
- vehicle speed data is used to calculate the distance traveled in meters which is then converted to miles
- Battery power data is used to find power used in kWh which is then converted to gasoline-equivalent using US EPA value by dividing with 33.7
- Dividing distance traveled in miles by the number of gallons, we can get miles per gallon.
Factors considered to model fuel flow
The parameters considered for fuel flow are vehicle speed, Fuel volume flow and Battery Power.
Vehicle speed is used to calculate distance travelled. Since this is a hybrid vehicle, both Gasoline consumption and Battery consumption are considered as fuel flow. Gasoline consumption is modeled inside ‘Mapped Core Engine’ block as shown in figure 11. Fuel mass flow is being modeled by a 2D look up table where Engine speed and Toque will give fuel consumption values.
Battery consumption is calculated from battery power. Both fuel consumptions are added together to get total fuel consumption.
QUE3:.Run the HEV ReferenceApplication with WOT drive cycle. Change the grade and wind velocity in the environment block. Comment on the results.
Open the HEV Reference application
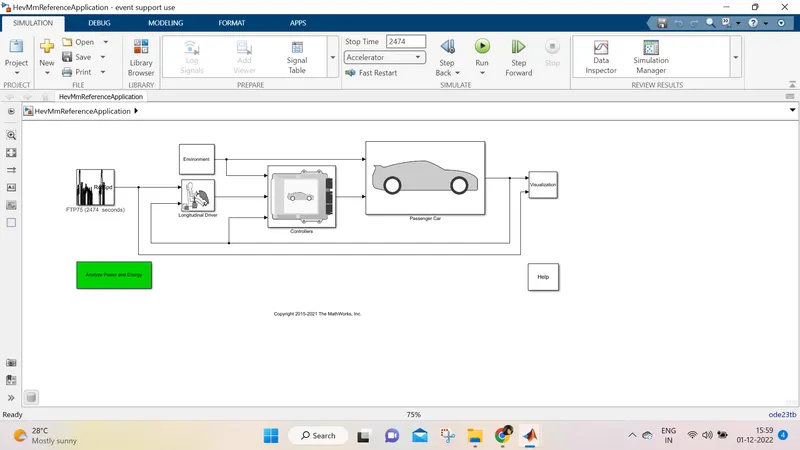
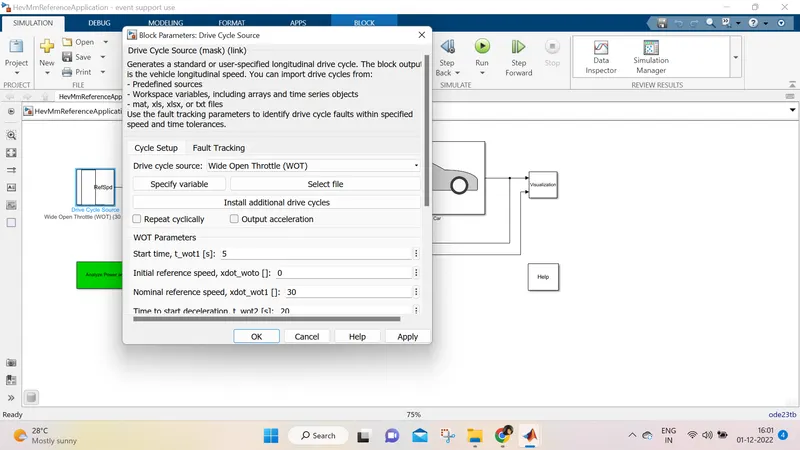
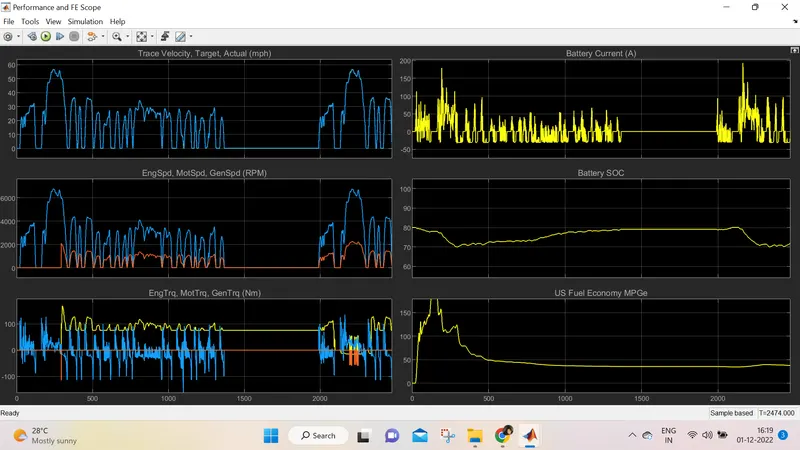
following is the simulation of HEV with WOT drive cycle
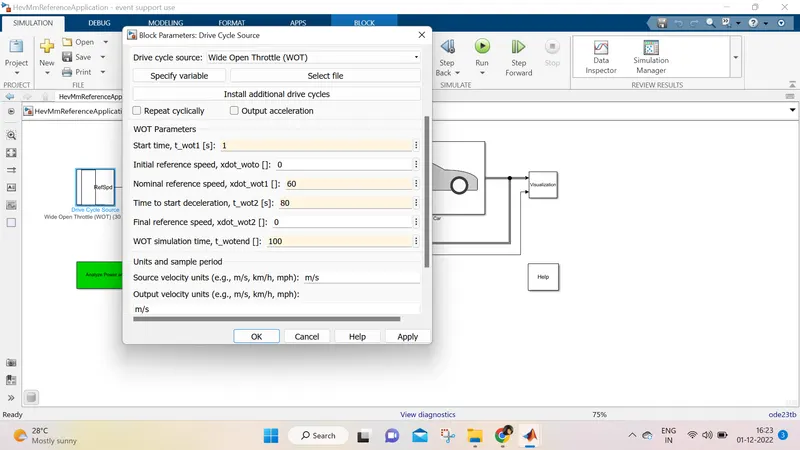
With wot cycle and time 100 sec
With grade 0 and wind speed 0
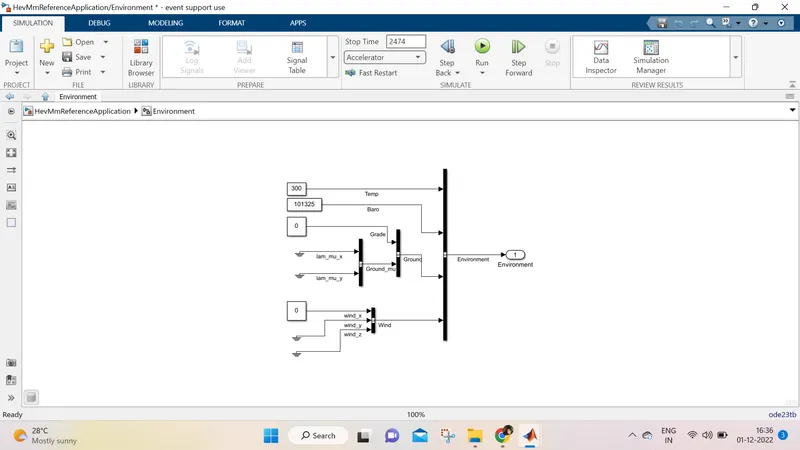
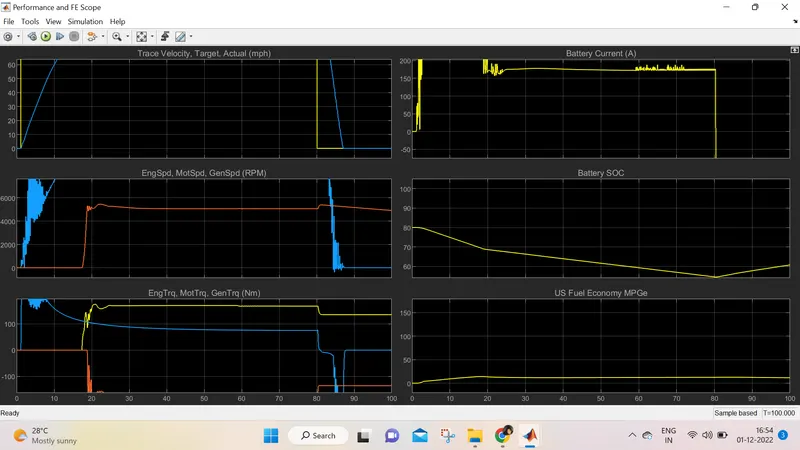
With grade 5 and wind speed 10
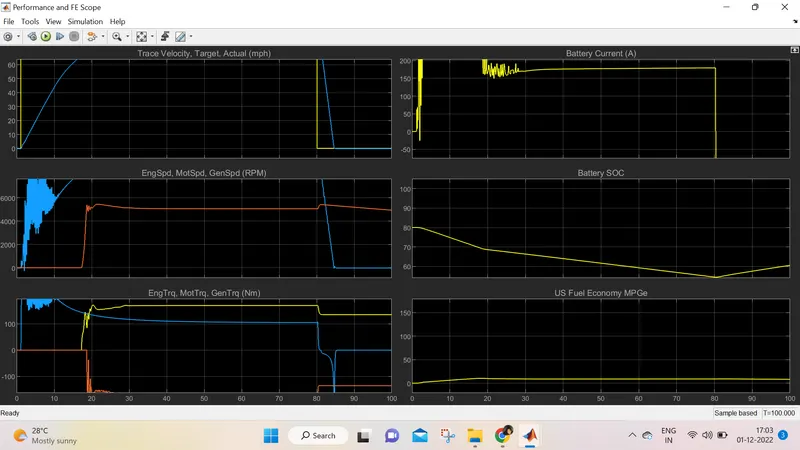
With grade 10 and wind speed 20
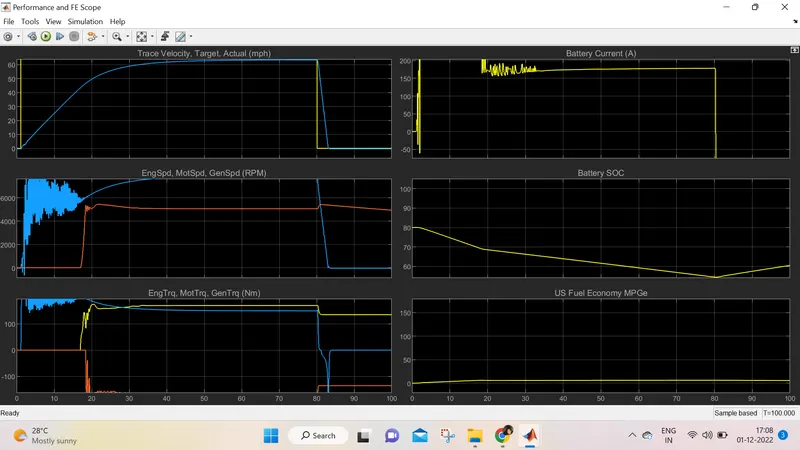
With grade 20 and wind speed 10
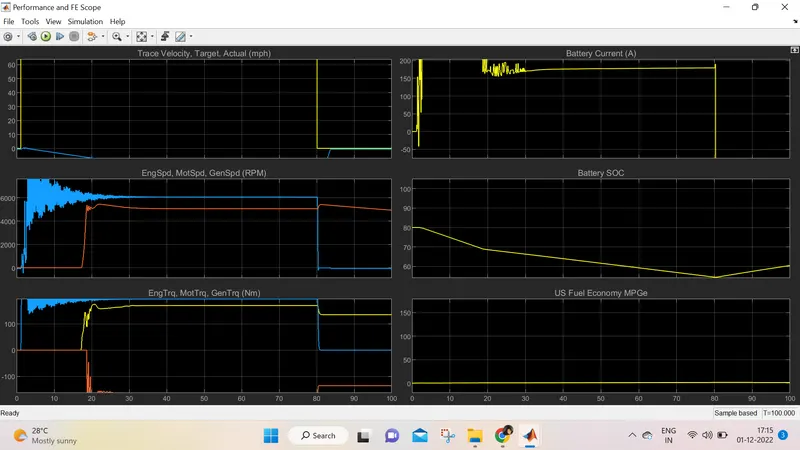
The model is simulated for various wind speed and grade and it has been observed that
- peak velocity achieved is reduced as gradient force and aerodynamic force becomes dominant.
- fuel economy is also reduced because the distance traveled is reduced due to external forces.
- deceleration time is reduced so battery recharging capacity is also reduced.
- Battery SOC at the end of WOT acceleration is similar but during deceleration battery is charged more is the grade and wind velocity is less.
que 4: Keeping all other parameters same, compare the simulated results of hybrid and pure electric powertrains
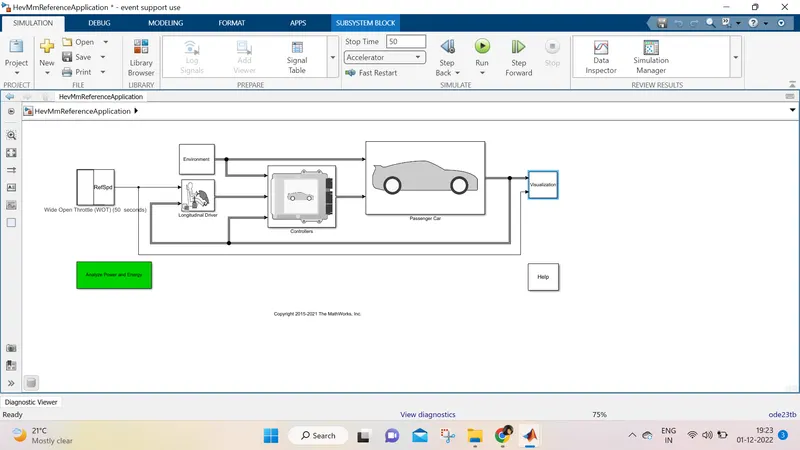
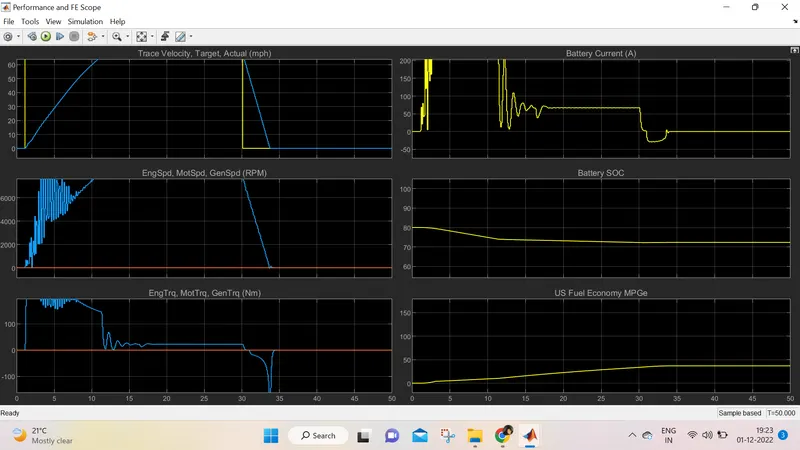
Both model,Hybrid and pure Electric are simulated for WOT cycle for 50 seconds ,achieveing a max speed of 30m/s and decelerate for 10 seconds
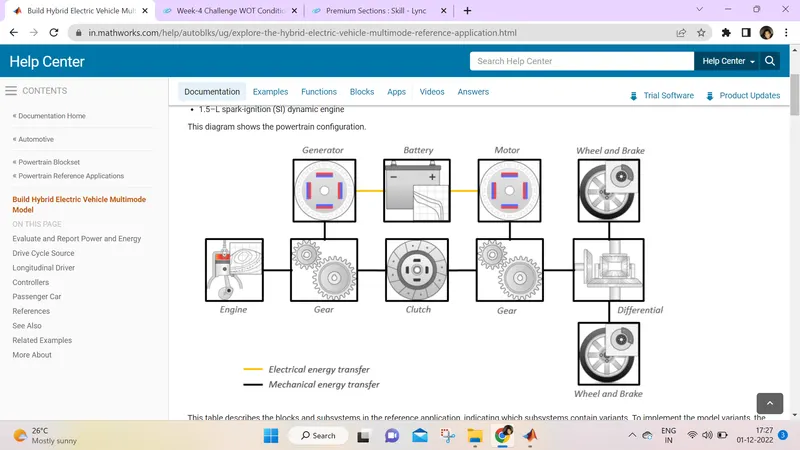
Hybrid Electric Vehicle Multimode Model
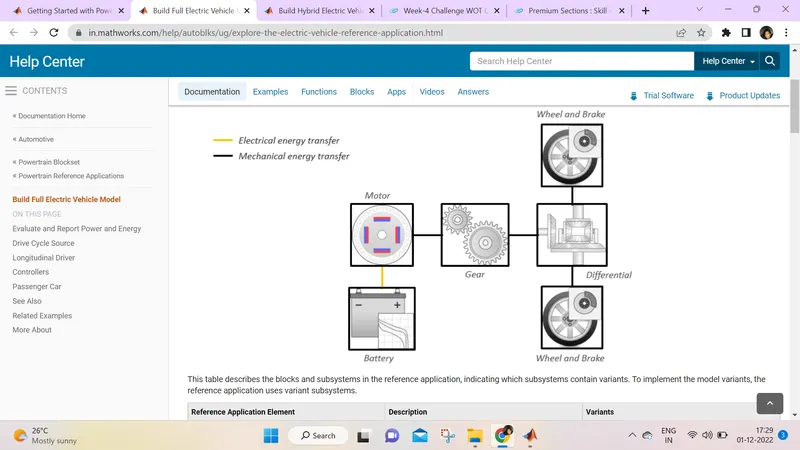
Full Electric vehicle model
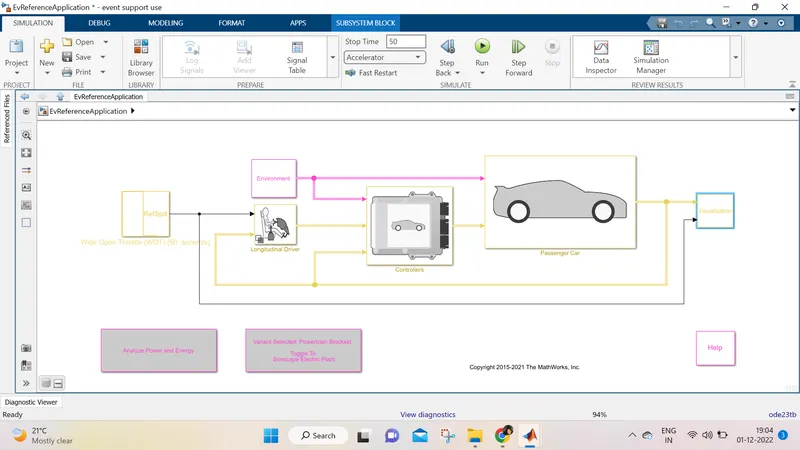
Pure electric vehicle
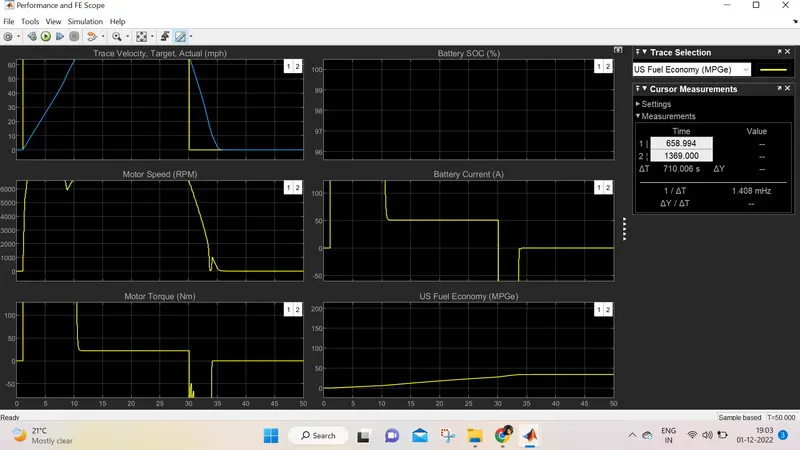
Hybrid electric vehicle
conclusion
- Time taken to achieve the required peak velocity is less for HEV as compared to EV
- Deceleration time is also low for HEV as it has many moving frictional parts
- fuel economy is more for an EV compared to HEV due to less no of moving parts and thus low frictional losses