Week-4 Challenge WOT Condition Part-2
AIM: To answer the following questions-
- What is the difference between the mapped and dynamic engine, motor and generator models? How can you change the model type?
- How does the model calculate miles per gallon? Which factors are considered to model fuel flow?
- Run the HEV ReferenceApplication with WOT drive cycle. Change the grade and wind velocity in the environment block. Comment on the results.
- Keeping all other parameters the same, compare the simulated results of hybrid and pure electric powertrains.
SOLUTION:
1)What is the difference between the mapped and dynamic models of the engine, motor and generator? How can you change the model type?
-
| Mapped Models | Dynamic Models |
| Mapped models represent the macro behaviour of the subsystem as a set of lookup tables. These models are useful for understanding the behaviour of the subsystem using empirical data. Mapped models are suitable for analysis and design activities that do not require subsystem dynamic characteristics, for example, in engine and transmission powertrain matching analysis for fuel economy, emissions, and performance tradeoffs. | Dynamic models decompose the subsystem behaviour into individual component models. Dynamic models are suitable for designing control, estimator, and diagnostic algorithms that depend on dynamic subsystem states, for example, in closed-loop AFR control algorithm development. |
| It reduces the complexity of simulations as it uses data to simulate the model. But in the mapped model data has to be collected and fed into the model. | It dynamically adjusts to the operation giving us a detailed analysis of the components of the model. But dynamic models are difficult to build for customized operations. |
| Mapped Model Engine is represented as a set of lookup tables (brake torque, fuel flow, air mass flow, exhaust temperature, efficiency, and emissions) as functions of commanded load and measured engine speed. | Dynamic models of an engine decompose the engine behaviour into individual component models that account for engine dynamics, most notably intake airflow and turbocharger dynamics. The performance is estimated using real-time details leveraging the specifications of the designated vehicle. |
| Mapped motor behaviour can be represented as a set of lookup tables of efficiency, torque curve, rpm, power curve, and temperature | Dynamic motor models decompose the motor behaviour into individual component models. The performance is estimated using real-time details leveraging specifications provided by the user. |
| Mapped Model Generator is represented as a set of lookup tables of generator efficiency and motor torque. | Dynamic Model Generator decomposes the motor behaviour into individual component models. The performance is estimated using real-time details leveraging specifications provided by the user. |
We can switch between mapped and dynamic model types based on the application:
Below shown steps are done for the EV reference application, these steps can also used for Hev reference application also.
- Open the powertrain module blocks for the required vehicle.
- Click on the passenger car/vehicle block and select an electric plant or engine.
- Right-click on Engine/EV motor/generator based on the vehicle model and select subsystem & model reference.
- In subsystem & model reference select the option convert to the variant subsystem.
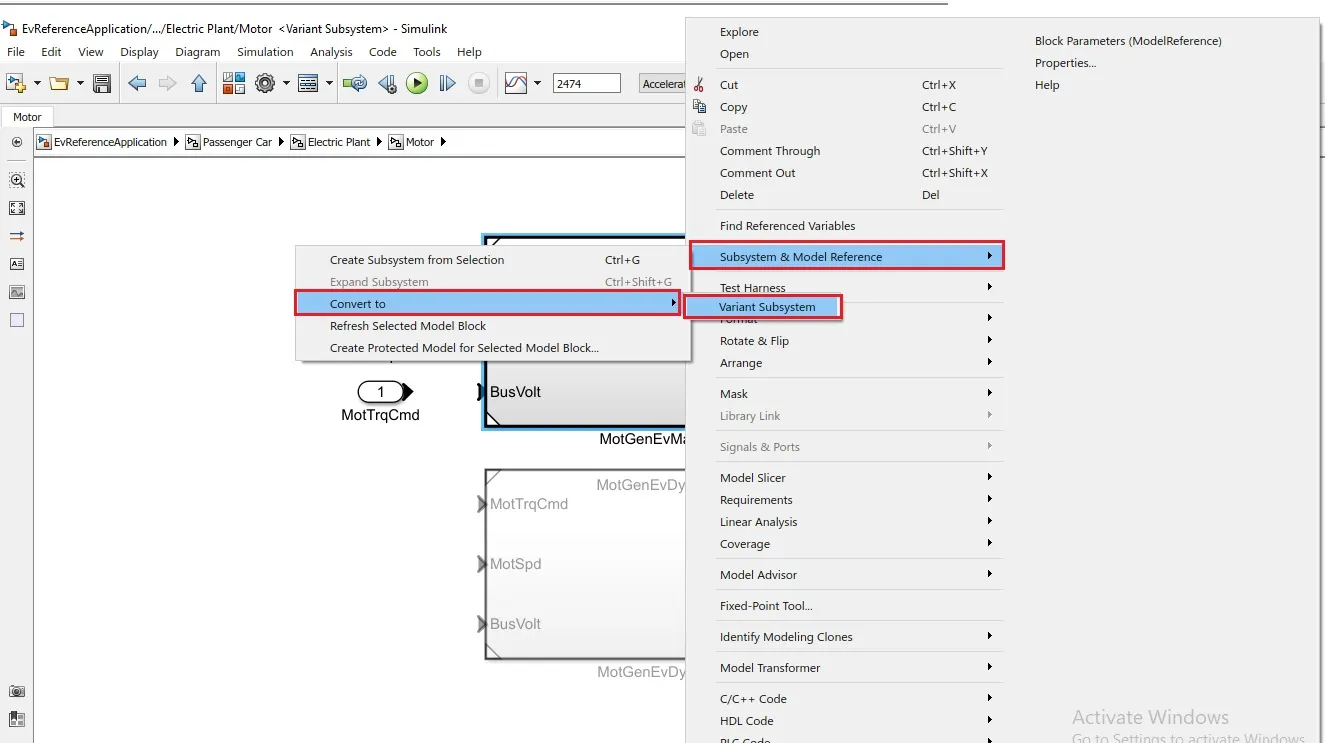
- Then by using model explorer
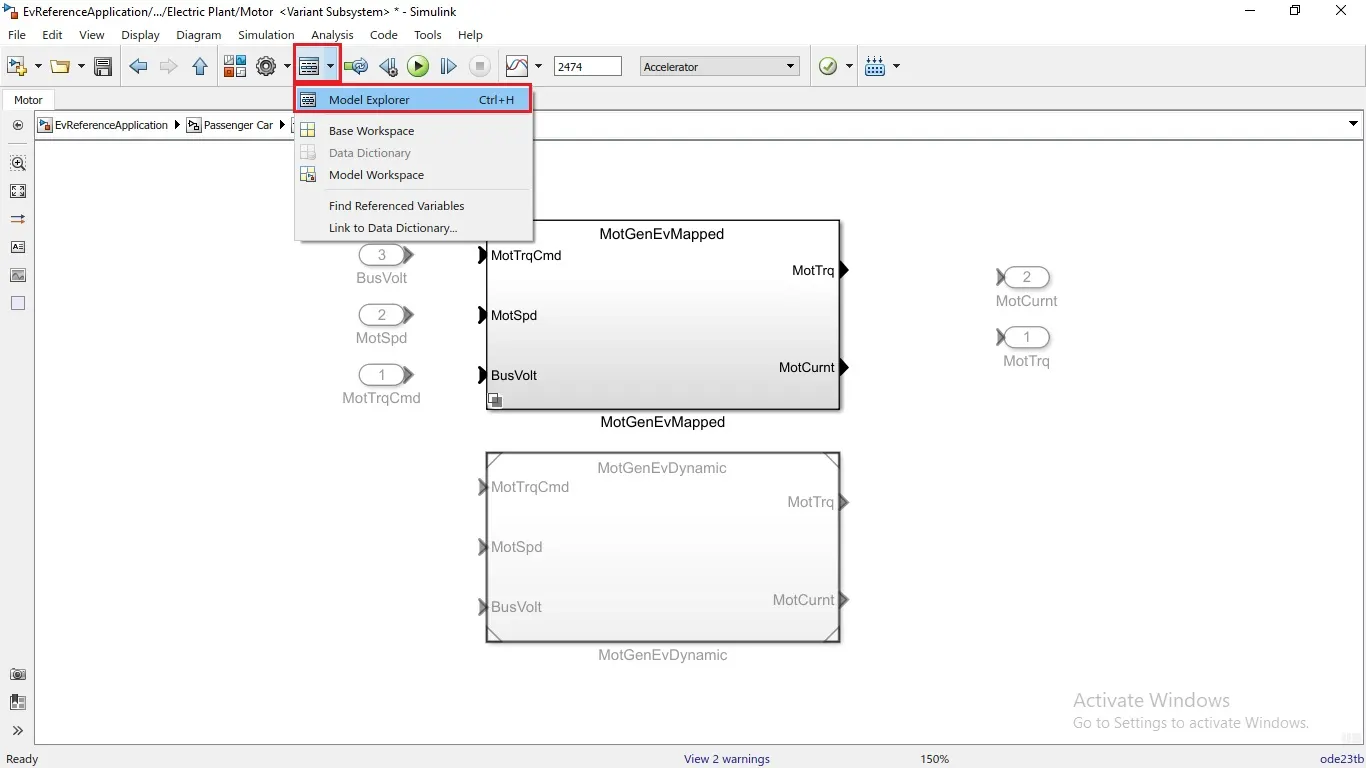
- The model type can be changed as shown in the below image.
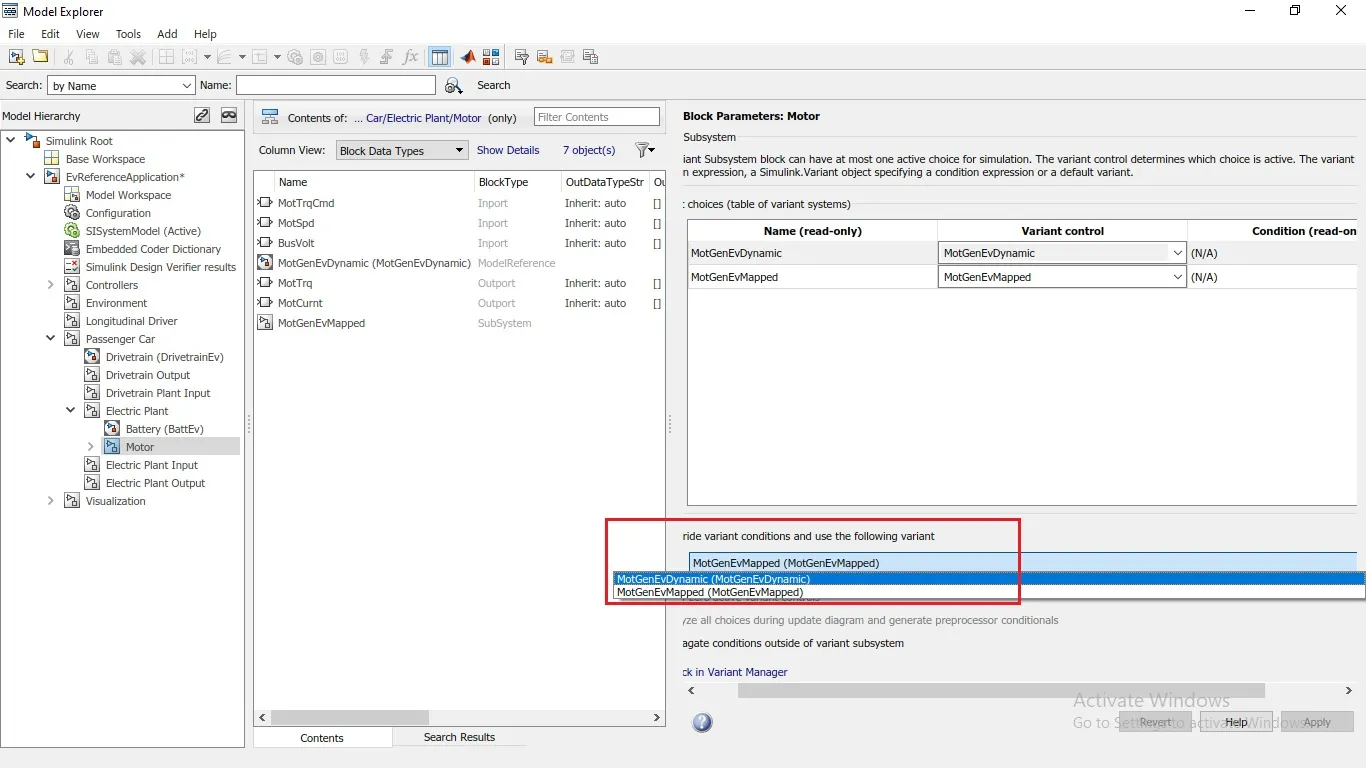
2) How does the model calculate miles per gallon? Which factors are considered to model fuel flow?
- Miles per gallon (MPG) is the unit of measurement for cars to find out fuel efficiency. In the electric vehicle, it is replaced with a unit named miles per gallon equivalent (MPGe). One gallon of gas is equivalent to 33.7-kilowatt hours of electricity.
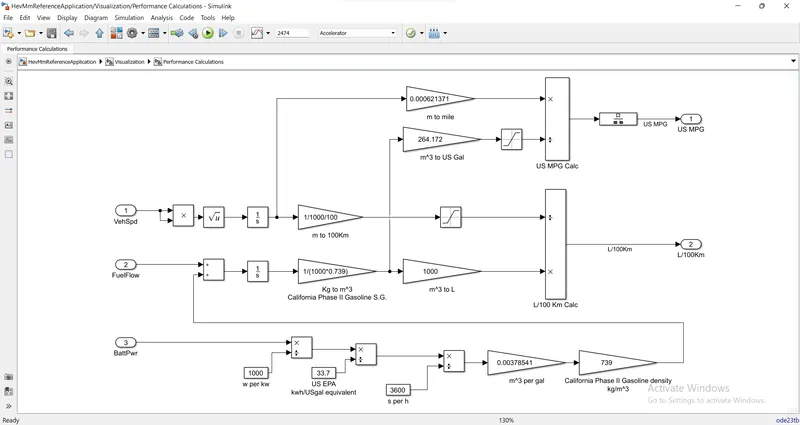
From the above representation, we can see that the calculation is done by vehicle speed, fuel volume flow and battery power as inputs. Battery power is taken in kilowatt hours and it is converted to miles per gallon by dividing 33.7. So an electric or hybrid vehicle that uses 29 kWh per 100 miles would get a combined 115 MPGe rating.
The following are factors which are considered to model fuel flow.
- Vehicle speed
- Fuel flow
- Battery power
3)Run the HEV ReferenceApplication with WOT drive cycle. Change the grade and wind velocity in the environment block. Comment on the results.
We open the HEV reference application.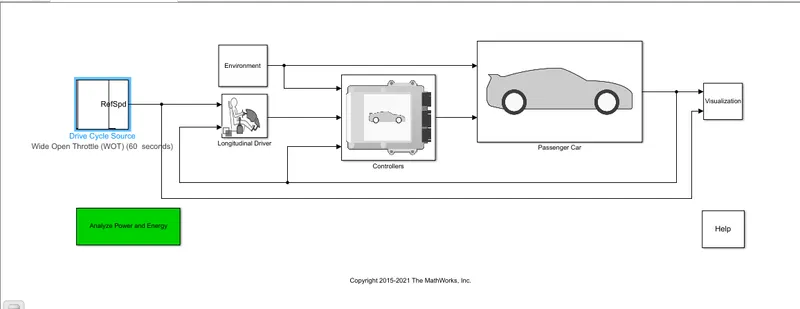
We change the drive cycle mode to the wide-open throttle with the default values.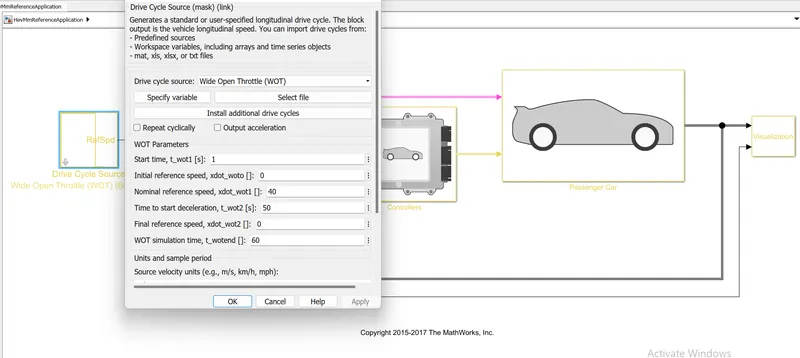
We run the application and get the below outputs-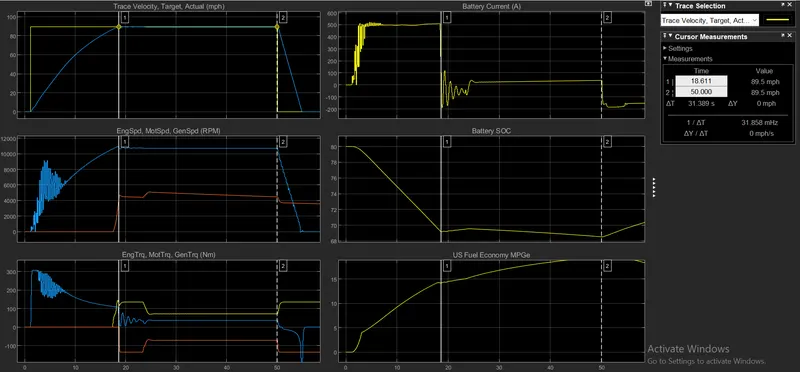
We change the environment variables which are grade value and wind value for the second case.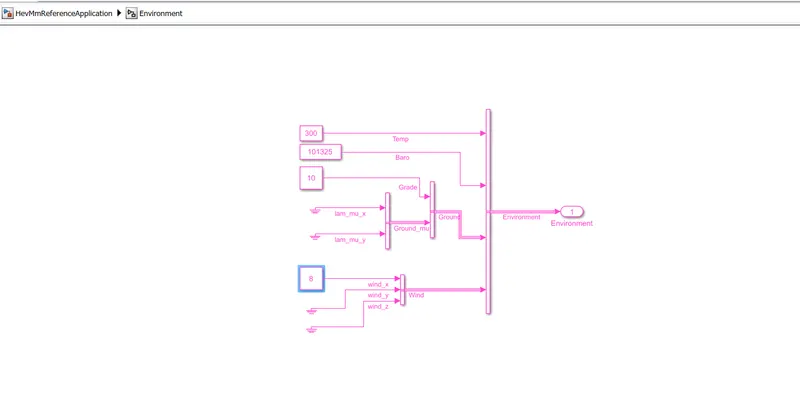
We run the model and get the outputs as shown below-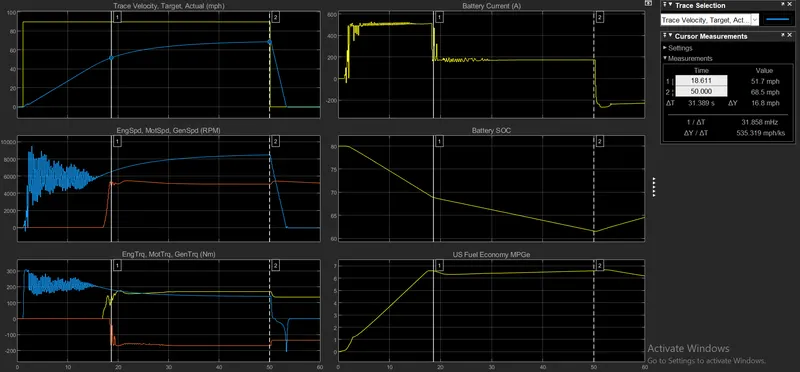
Observations for the above graphs for both cases-
1) We can see that for the case with no environmental variables, it took around 19 secs for the car to reach the reference speed.
2) During the first scenario battery operated motor kicks in to achieve the required speed and the engine starts working when the speed is achieved.
3) To achieve the required speed mostly battery-powered motor was used which resulted in better fuel economy of more than 15 MPGe.
4) In the scenario with environmental variables, the required speed wasn't achieved.
5) Battery-powered motor along with the engine tries to achieve the required speed, which results in lower battery SOC and also lower fuel economy.
6) In both cases during deceleration, the generator kicks in to recover some of the energy.
4) Running the EV reference application with the same conditions as the HEV application and comparing the results.
We open the EV reference application.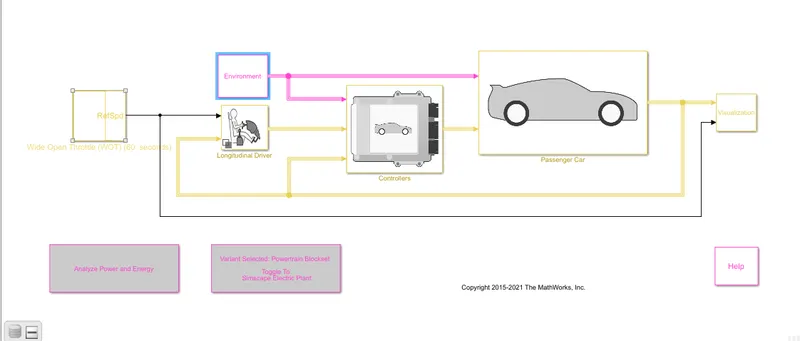
We change the drive cycle to WOT with the same reference speed and simulation time and also change the environmental variables.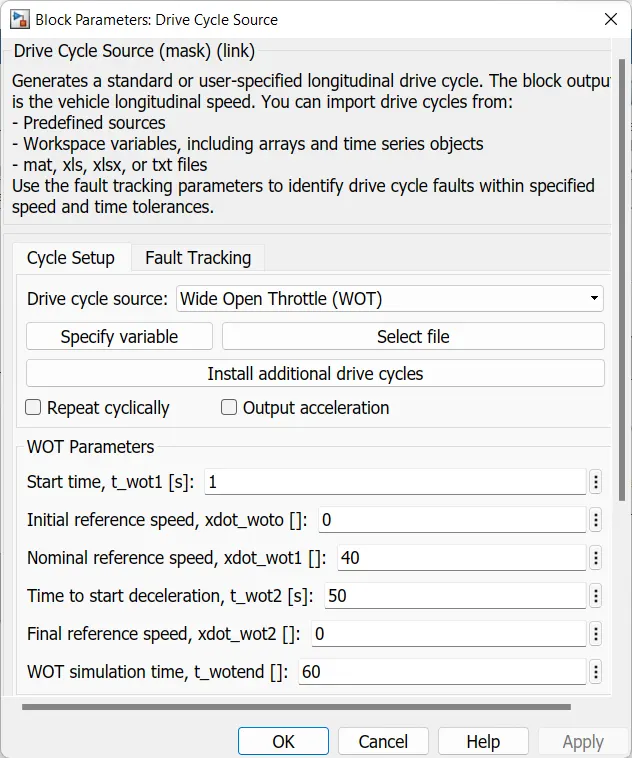
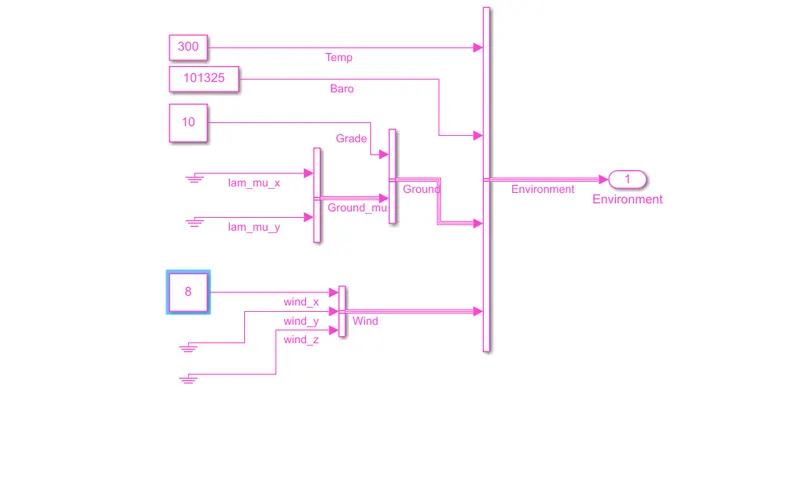
We run the application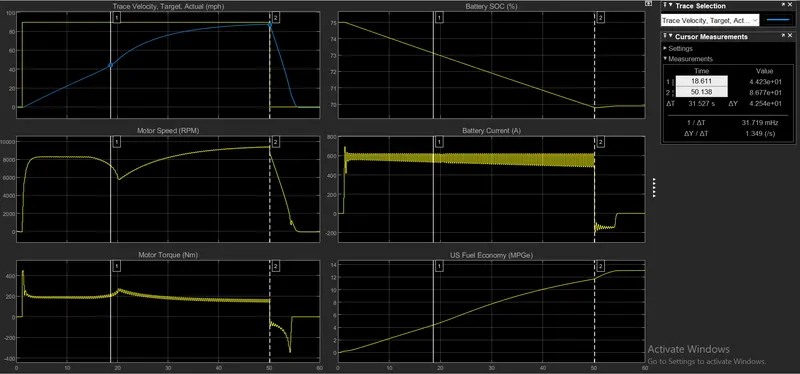
Comparison between HEV and EV reference applications:
1) In the case of HEV, the actual velocity achieved compared to the target velocity is about 30% less.
2) In the case of EV, the actual velocity achieved compared to the target velocity is only about 3% less.
3) The use of battery power alone results in instantaneous acceleration in the case of EV, in HEV it's paired with the conventional engine which is better for a longer range.
4) As EVs use lithium-ion batteries which results in better battery SOC % than HEVs.
5) Regenerative braking is more effective in the case of HEVs than EVs as current is generated for a longer period in the case of HEVs.
CONCLUSION:
1) We learnt that the fuel economy for EVs is better than HEVs.
2) HEVs have better energy recovery than their EV counterparts.
3) Overall, EVs are more efficient than HEVs.