Week-4 Challenge WOT Condition Part-2
Question 1:
What is the difference between mapped and dynamic model of engine, motor and generator? How can you change model type?
The help block in the simulink model guided the basic line up of difference of engine and motor. The below screenshots states the basic definition of them.
Implementation and usage of Mapped and Dynamic model of engine
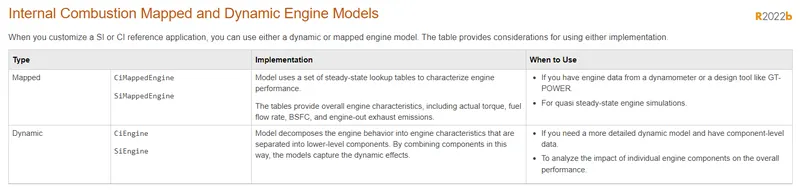
Description of mapped and dynamic model of electric motor

Detailed screenshot of motor system

Difference between mapped and dynamic models of engine, motor, and generator machines
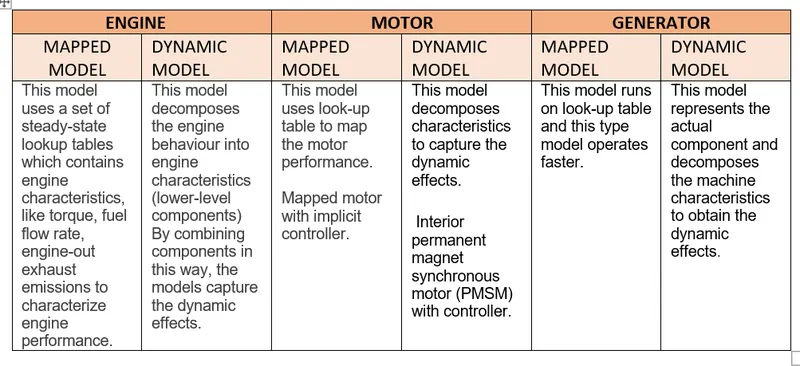
The above word screenshot states the differences of the mapped and dynamic model and also attached the file in file section below.
How can you change model type?
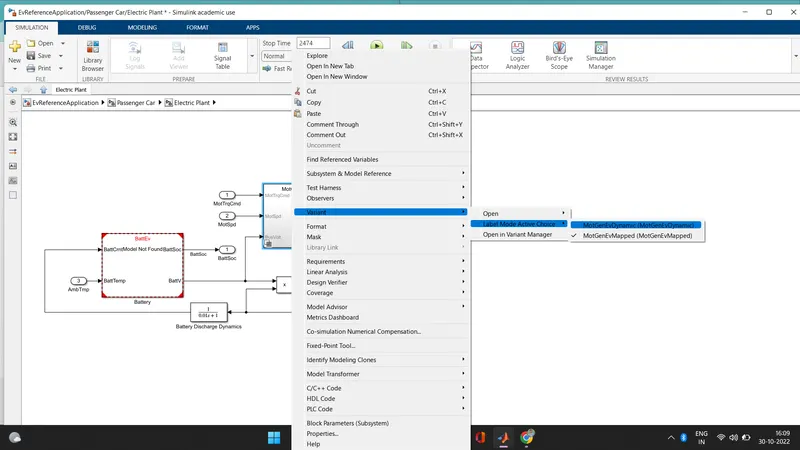
Step1: To change the model type in simulink model. After selecting the particular block of subsystem you wish to change to.
Step2: There will be a option called "variant" in the dialogue box appeared
Step3: After selecting the Variant option we will get option called "label mode active choice" on the right.
Step4: After selecting label mode active choice we will get couple of option to choose.
Step5: Dynamic model and mapped model options appears to choose further.
Step6: After chosing the preferred option, we'll see the change in the subsystem block on the simulink model.
The following screenshot shows the above discussed steps in a single shot
Question2:
How does the model calculate miles per gallon? Which factors are considered to model fuel flow?
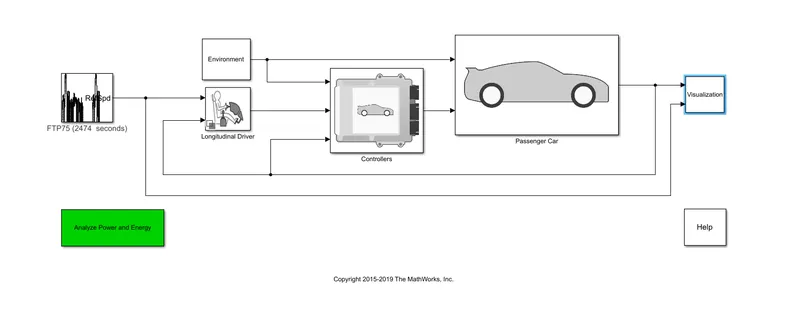
o The simulink model of EV reference application has a block called "Visualization"
o This Visualization block in this model is used to perform calculations like rad/s to RPM, m/s to mph etc to calculate the motor speed, torque and also some battery parameters.
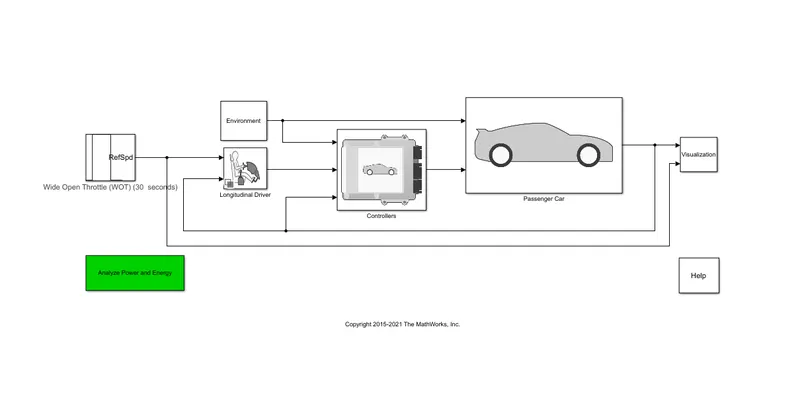
o This Visualization block takes inputs from the passenger car and feedback signal from particular drive cycle. As shown below
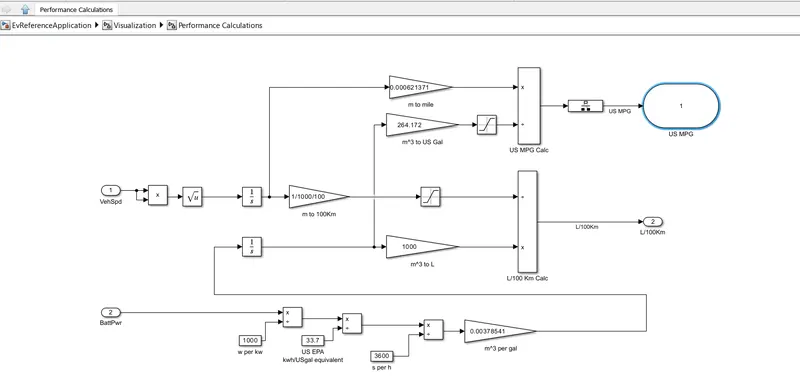
o From this Visualization block we have an another block called "Performance calculations". In which the specified conversion takes place.
o Performance calculations performs conversion like vehicle speed to mile, US gallon, Liters, directly and it also does indirect conversions like US MPG and L/1000KM as shown in the following.
o In this way the desired conversion of miles per gallon is converted. In the below screenshot the output block shows the desired "US miles per gallon" calculations only.
Visualization block takes inputs from the passenger car
Conversion of miles per gallon is converted in this system itself
Which factors are considered to model fuel flow?
The factors which must be consider to model the fuel flow are described below:
o Vehicle speed(VehSpd): The vehicle speed in this EV reference application was employed as an input to the system.Through which the vehicle is further converted into "Km" and then further into "miles", "US gallon", and also to "liters". These are the factors which are associated with fuel flow to finally converted it to L/1000km as ashown in above image.
o Battery power(BattPwr): While coming to battery power of the vehicle, this power is directly assiocated with fuel flow block as shown to sum up those inputs.
Question 3:
Run the HEV ReferenceApplication with WOT drive cycle. Change the grade and wind velocity in the environment block. Comment on the results.
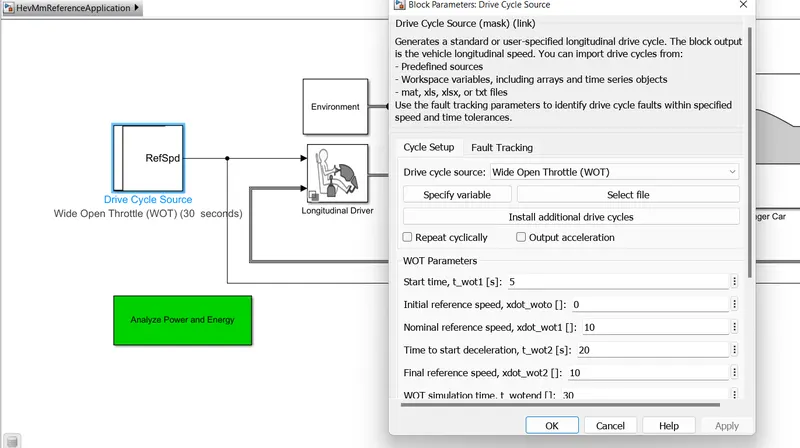
Below image describes about Hybrid electric vehicle(HEV) adjusted with WOT drive cycle as an input drive cycle.
After selecting the Wide open throttle(WOT) drive cycle, there will be a parameter block will appear to select the specified parameters. Where start time of the cycle is set to 5seconds, Nominal reference speed is 10, deceleration time is set to 20, final reference speed is set to 10, WOT simulation time is 30. These ar ethe value which are set in WOT parameters.
Setting WOT drive cycle parameters as an input drive cycle
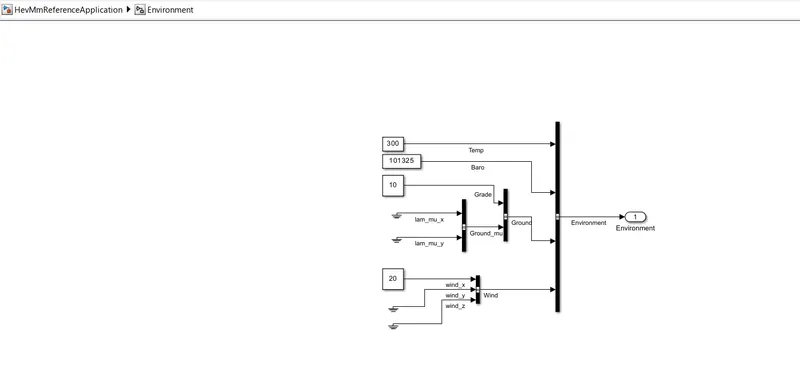
As insisted to change the gradability and wind velocity factors. We had change it to 10 and 20 respectively as shown below
Changing the grade and wind velocity factors in the environment block of the model
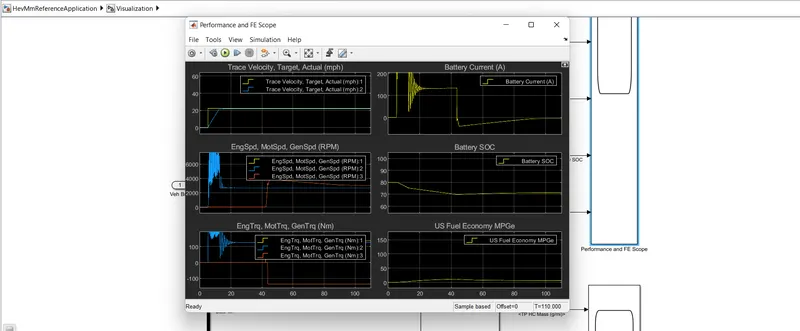
As this is a hybrid electric vehicle it has both electric motor and battery backup system and as well as engine and fuel management also.
The output plots of all 6 parameters are plotted below
Question4:
Keeping all other parameters same, compare the simulated results of hybrid and pure electric powertrains
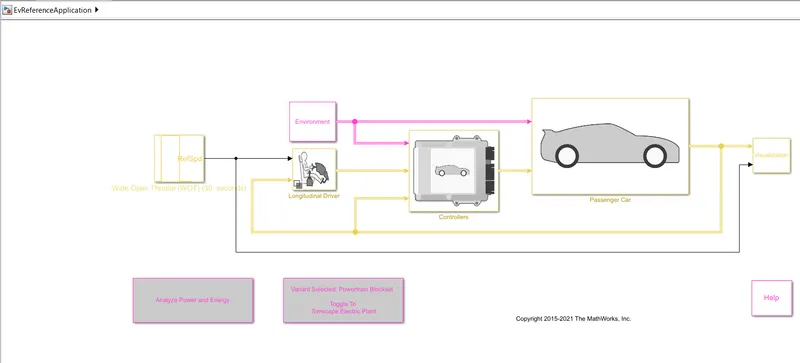
Now it time to work upon the electrical vehicle blockset. The below image describes about the pure electrical vehicle technology. Now keeping all other parameters same as like HEV model. Using the same WOT drive cycle as input drive cycle.
PURE EV reference application model with WOT drive cycle and same grade and wind factors as in HEV model
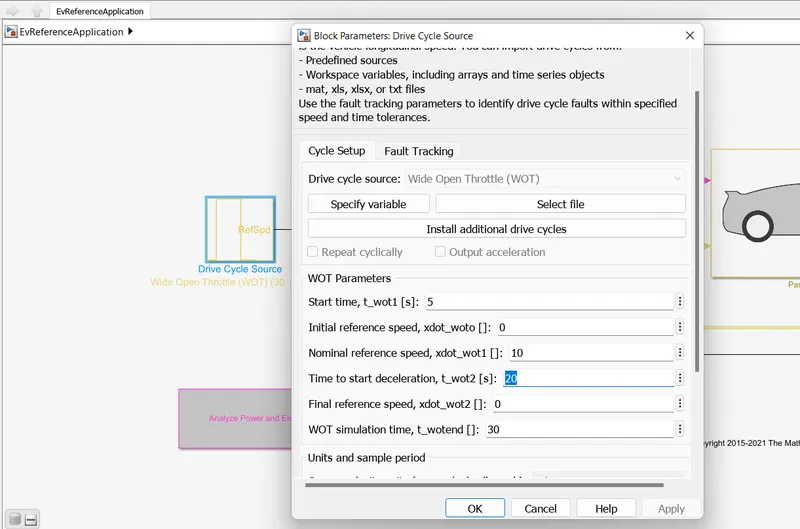
setting start time to 5 seconds and Nominal reference speed is 10, deceleration time is set to 20, final reference speed is set to 0, WOT simulation time is 30. These are the value which are set in WOT parameters of EV power train model
Setting the WOT drive cycle to the Pure EV powertrain model
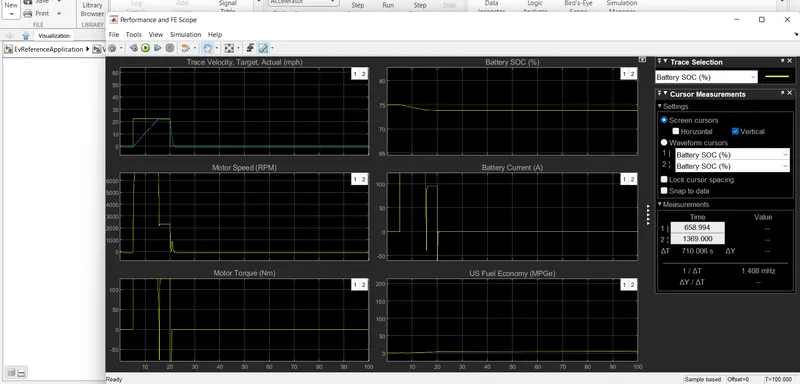
The output plots of all 6 parameters are plotted below
CONCLUSION:
1. While comparing HEV and EV power train models we conclude that the fuel economy parameter in HEV and EV is changed to zero in case of EV model. In EV power train model there will be engine to consume fuel where it comes to HEV there will be both engine and electrical motor as well. So Fuel economy in EV is zero.
2. WHile in HEV power train model we can observe that there is a engine speed and engine torque but when it comes to EV power train block we can observe only the only motor speed and motor torque only.
3. The Battery SOC in HEV powertrain model we can observe that the there is drop in state if charge at 20 sec of time and sees a constant charge of 70, but when it comes to EV powertrain model there is almost constant plot at 75 after 20 seconds of time.