Project - Data Handling and Interpolation
Project:
Matlab code:
elec_data = xlsread('VI.xlsx'); % xlsread command is used to read excel sheet
V = elec_data(:,1); % fetching voltage data from mini_project_2 data into 'V'
I = elec_data(:,2); % fetching current data from mini_project_2 data into 'I'
x = [-17.3:0.1:0.9]; % given interpolation range assigned to 'x'
y = interp1(V,I,x,"linear"); % interp command used to resample the some unknown data
%% by default it takes linear
plot(V,I,':r*','Linewidth',2,'MarkerSize',12); % here the given data 'V' and 'I' values are plotted and green colour
% line width command offers to change the axis line width
% markersize command offers to change the style of axis
hold % to hold the above plot
plot(x,y,'b--','Linewidth',3,'MarkerSize',5);
% here the interp data 'x' which is given range and 'y' which is interp data values are plotted
grid; % to give grid lines to the plot
title('Interpolation data'); % to give title of the plot
xlabel('voltage and interpolation range'); % to give the label to respective 'x' axis
ylabel('current and interpolation data'); % to give the label to respective 'y' axis
% took sheet2 data for interpolation and obtained plots
x1 = [-17.2,-13,-11,-9,-6,-1,0.11,0.25,0.5,0.61,0.66]; % obtained from sheet2 of excel file
y1 = interp1(V,I,x1,'linear'); % interpolation using above 'x1' data
plot(x1,y1,':g*','Linewidth',2,'MarkerSize',2); % to plot the 'x1' and 'y1' and given 'blue' colour to the axis
legend('original data','interpolation range','interpolation data')
% to indicate the axis using style of axis
% finding missing data which are mentioned in sheet2 and saving them to vi_data text file
% find some missing data using interp1 command
i = interp1(V,I,-17.3);
i1 = interp1(V,I,-13);
i2 = interp1(V,I,-11);
i3 = interp1(V,I,-9);
i4 = interp1(V,I,-6);
i5 = interp1(V,I,-1);
p = [y,y1]; % now assigning both 'y' and 'y1' variables to 'p' for further printing the saved data
q = [i,i1,i2,i3,i4,i5]; % now assigning all variables to 'q' for further printing the saved data
fid=fopen('vi_data','w'); %created a file id and called fopen and 'w' is used to write function
p;q;fprintf(fid,'%d',p,q); %printed the vector 'p','q' in text file and contains int values so mentioned '%d'
fclose(fid); %fclose is used to close the package
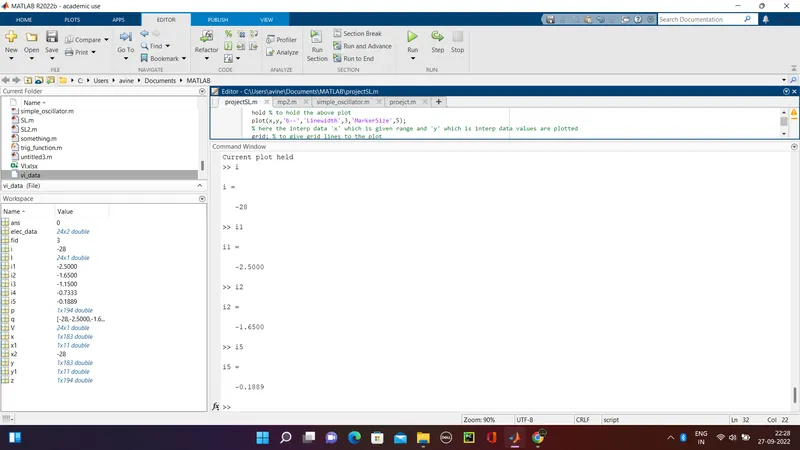
finding missing data from sheet2 in command window:
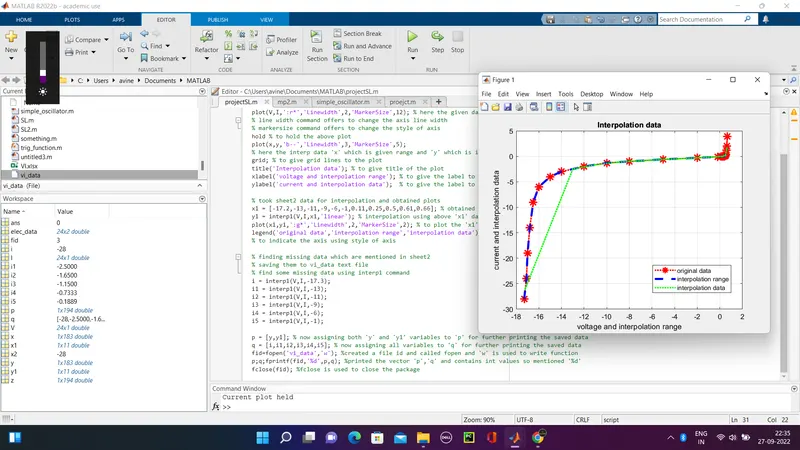
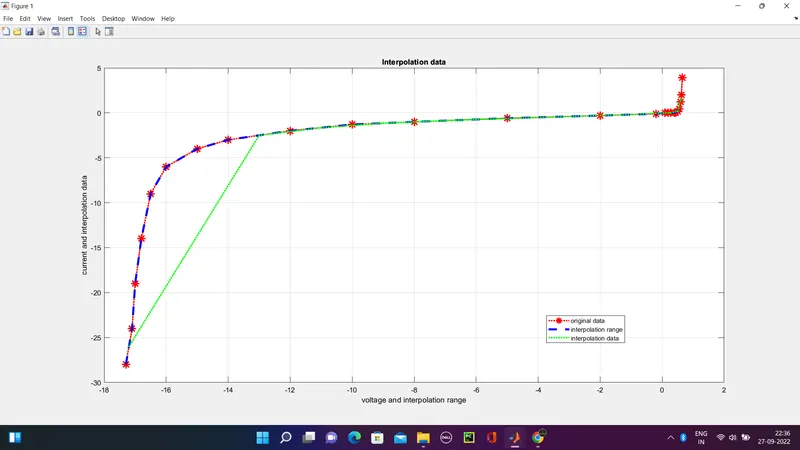
output plots of all three plots ('original data','interpolation range','interpolation data')
**Attached text file which contains 'y' and 'y1' and missing data obtained from sheet2