Week-4 Challenge WOT Condition Part-2
- What is the difference between mapped and dynamic model of engine, motor and generator? How can you change model type?
Powertrain blockset has two types of models for representing engine, motor, generators etc., namely 1)Mapped model & 2)Dynamic model
what is a Mapped model?
A Mapped model makes use of look-up tables which are fed with pre-known input parameters as data points.
Model uses a set of steady-state lookup tables to characterize engine performance.
The tables provide overall engine characteristics, including actual torque, fuel flow rate, BSFC, and engine-out exhaust emissions.
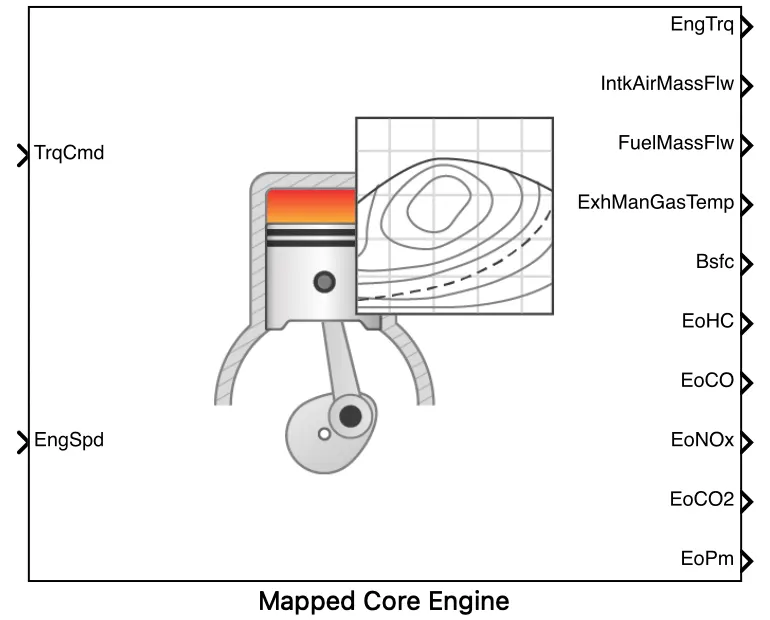
This kind of model takes input data from look-up tables and produces required output without considering realtime data.
The simulation time is less but tha results obtained are not much accurate compared to dynamic models.
what is a Dynamic model?
On the other hand , for a given driving cycle, a Dynamic model considers all the realtime data from all its related sub-subsystems to produce corresponding output.
Model decomposes the engine behavior into engine characteristics that are separated into lower-level components. By combining components in this way, the models capture the dynamic effects.
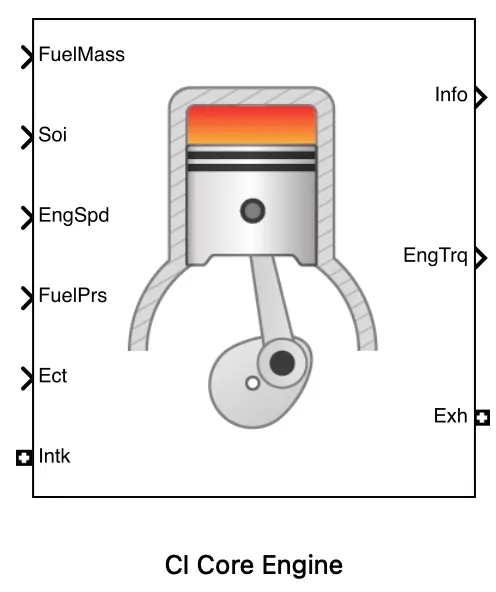
This type of simulation is time consuming and produces a more detailed dynamic model and have component-level data
Steps to changes model type in Simulink
Method A) from Variant Manager window
1).For example, open 'Hybrid Electric Vehicle Input Power-Split Reference Applicationform' matlab help.
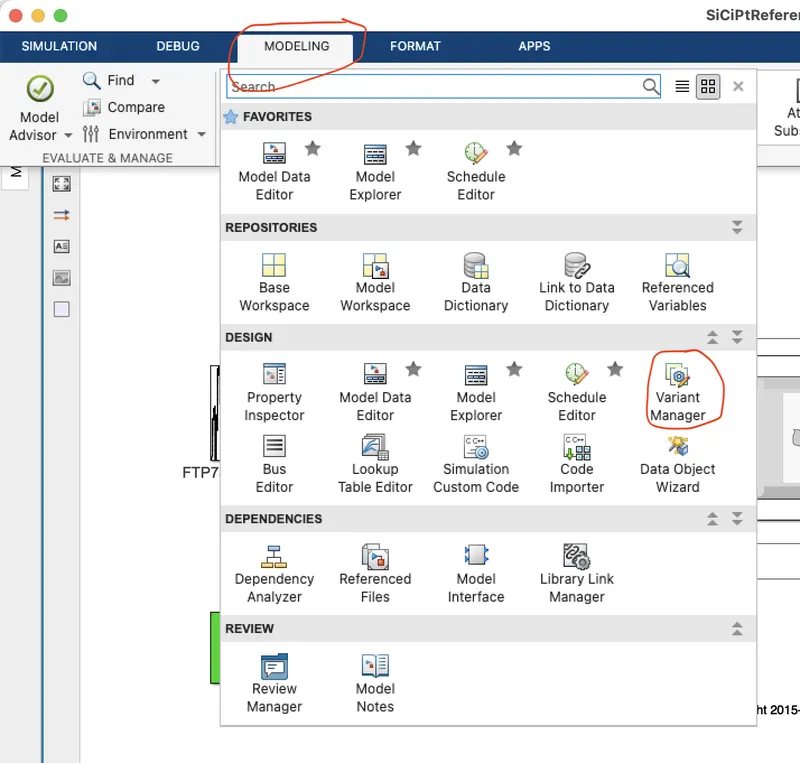
2). Now, in the SIMULINK window,chosose MODELLING tab and then from the dropdown list chose Variant Manager from the DESIGN section as shown in bellow,
3).Variant Manager popup window open as shown bellow
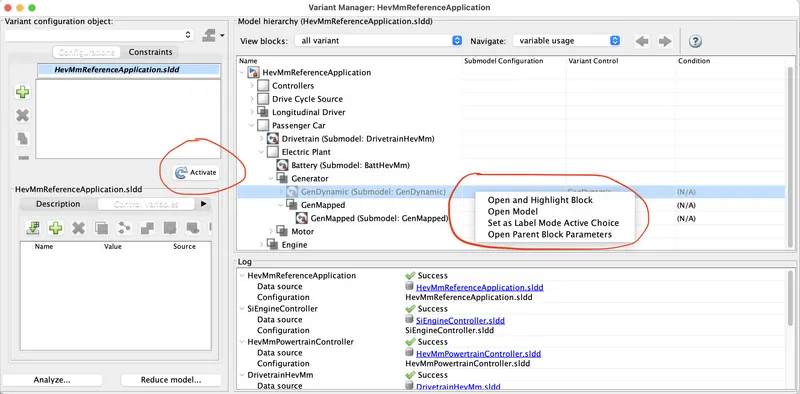
4). Now in the model hierarchy go to Generator block and right click on 'GenDynamic' choose 'Set as Label Mode Active Choice" then Activate it by clicking 'Activate' on left side window.
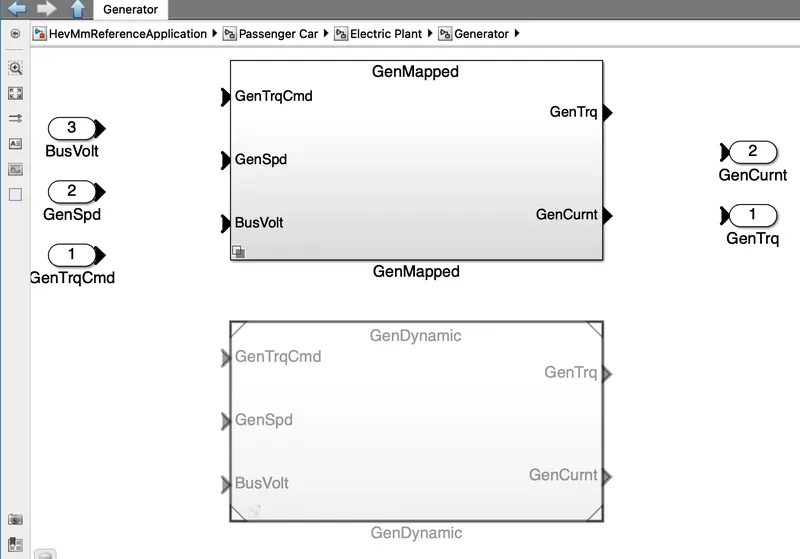 | |
| a) When Mappped model is activate | b)After choosing Dynamic model from the Variant Manger and activated |
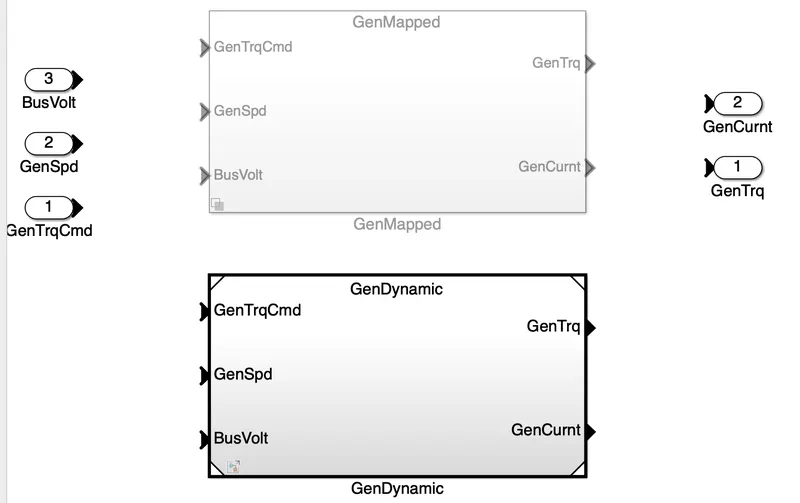
Method B) Directly at the Substystem level
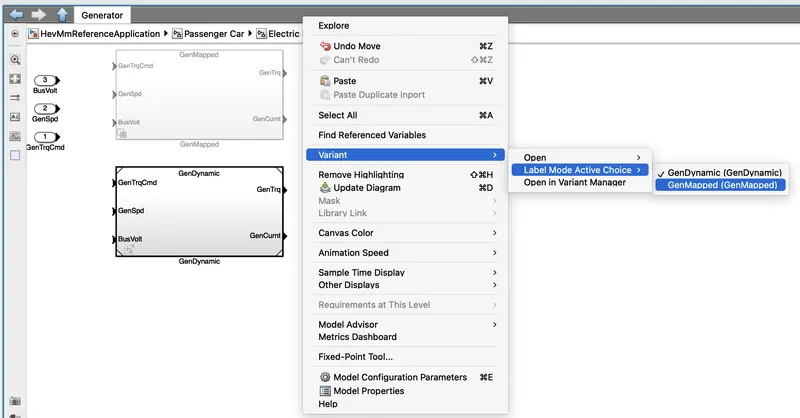
In the model, goto 'passenger Car/Electric Plant/Generator'
Right click anywhere on the background( white area)> choose Variant> then choose Label Mode Active Choice > then to choose model variant as required.
2. How does the model calculate miles per gallon? Which factors are considered to model fuel flow?
Miles per Gallon is a fuel economy rating determined by how far a car can travel on a gallon of gassolin, petrol or Diesel for a Engine powered car.
In case of an electric vehicle it tells us the energy which is equivalent that of a engine powered carto propel the car through a distance.
The amount of Fuel Energy required to move a engine powered car through a distance is determined and then it is compared to the eqivalent amount of electric energy required to move the car throgh the same distance and is expressed as the miles per gallon.
Here is the model that calculates the miles per gallon of an Hybrid Electric Vehicle
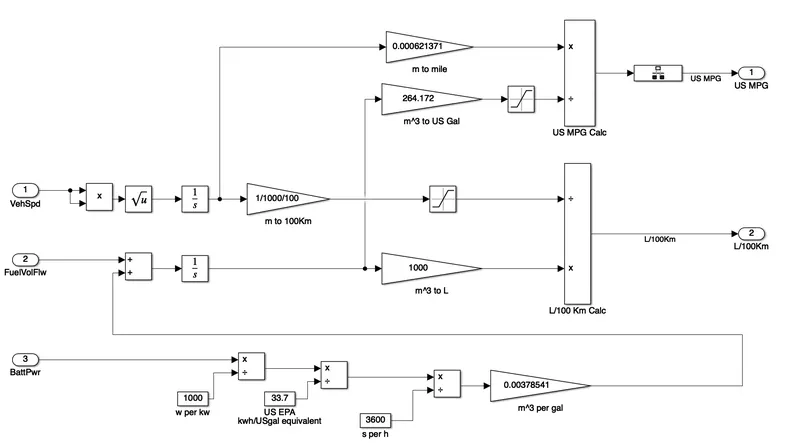
- The above model takes the input of the Vehicle speed , Fuel flow and Battery power to calculate the fuel consumption and the equivalent battery consumption and calculates the miles per gallon.
- Simulink model uses the vehicle speed, fuel flow velocity and the battery power to shows the fuel economy in Miles per Gallon. The HEVs use both fuel and battery power.
Step1. Battery power consumed is converted into kW and then devided with 33.7 to calculate US gallons equivalent, and then again deviding with 3600 to convert to energy KWH
Step2. Then multiplying with 0.00378541 we convert the US Gallons per sec to the volume of the fuel flow in (mA3/ s,cubic meter per sec)
Step3.Then finally the Battery energy equivalent in volumetric flow rate is given as a input for the fuel flow parameter in order to find the equivalent US Gallons enegy and estimate the Miles per Gallons.
Step4. Integrating the above sum gives volume of fule in m^3, and then multiplying with a gain of 264.172 converts m^3 to US Gallons
Step5. Now convert vehicle speed in m/s to meters and then to miles usinmg itegration and gain blocks respectively
Step6. Finally by deviding this miles travelled with the US Gallons obtained in step4 gives us Miles per gallon.
3. Run the HEV ReferenceApplication with WOT drive cycle. Change the grade and wind velocity in the environment block. Comment on the results.
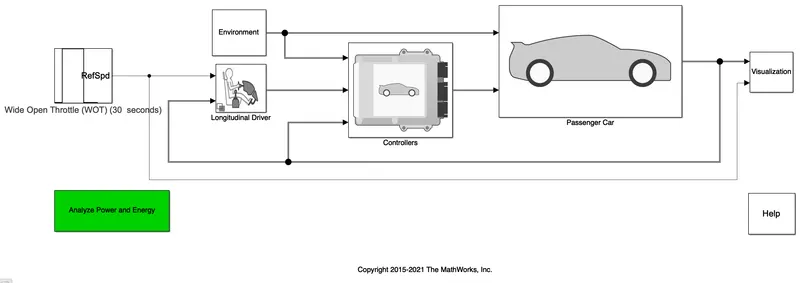
Here is the HEV reference application block diagram, we have changed the drive cycle input to Wide Open Throttle.
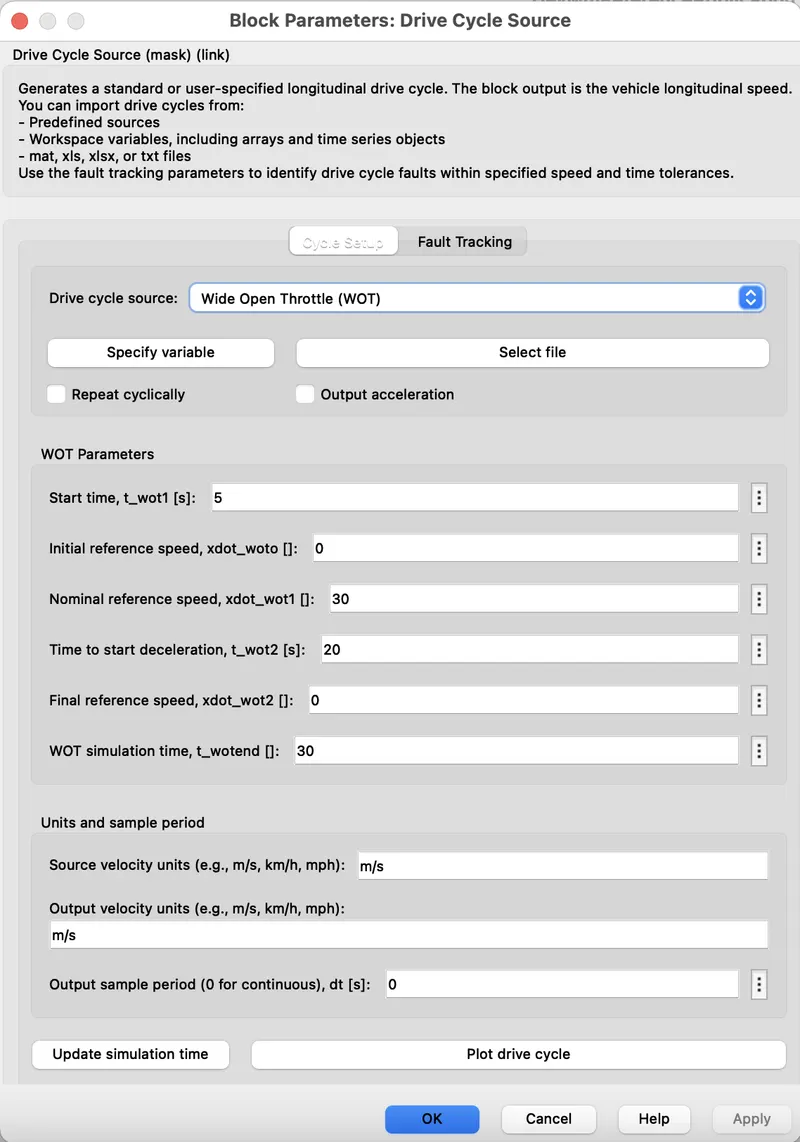
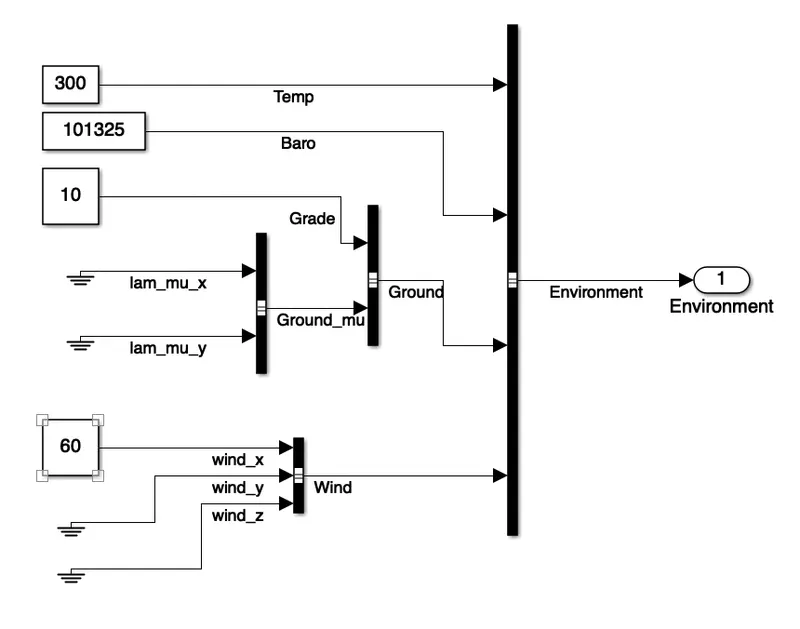
Bellow fig. showing drive cycle source choosen to WOT & its related parametrs, besides it is Environment subsystem with zero grade angle and zero wind velocity.
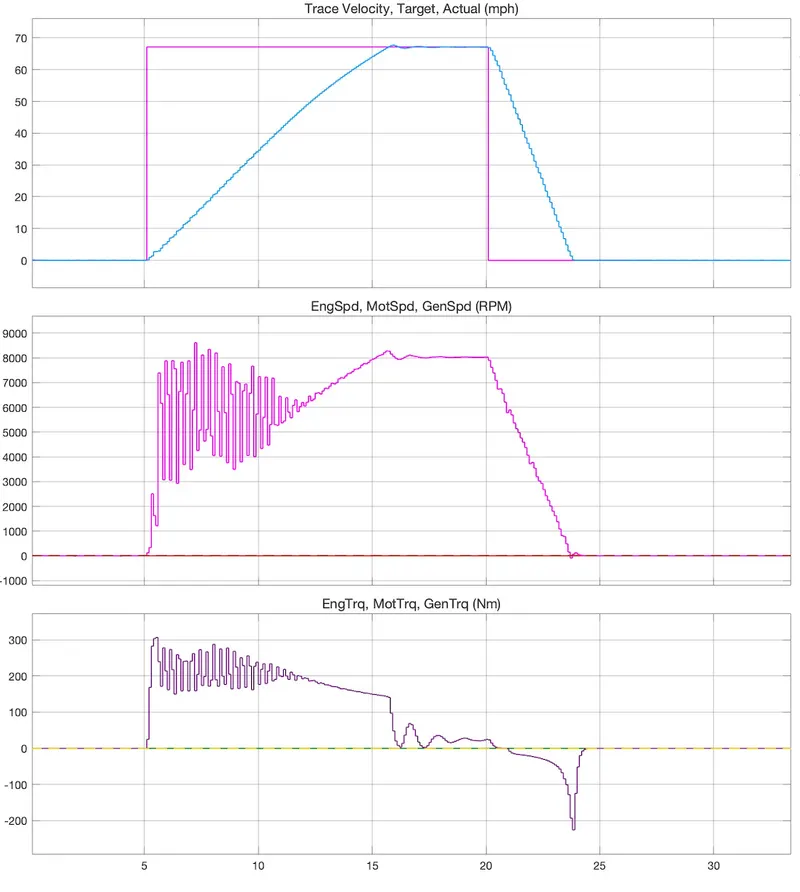
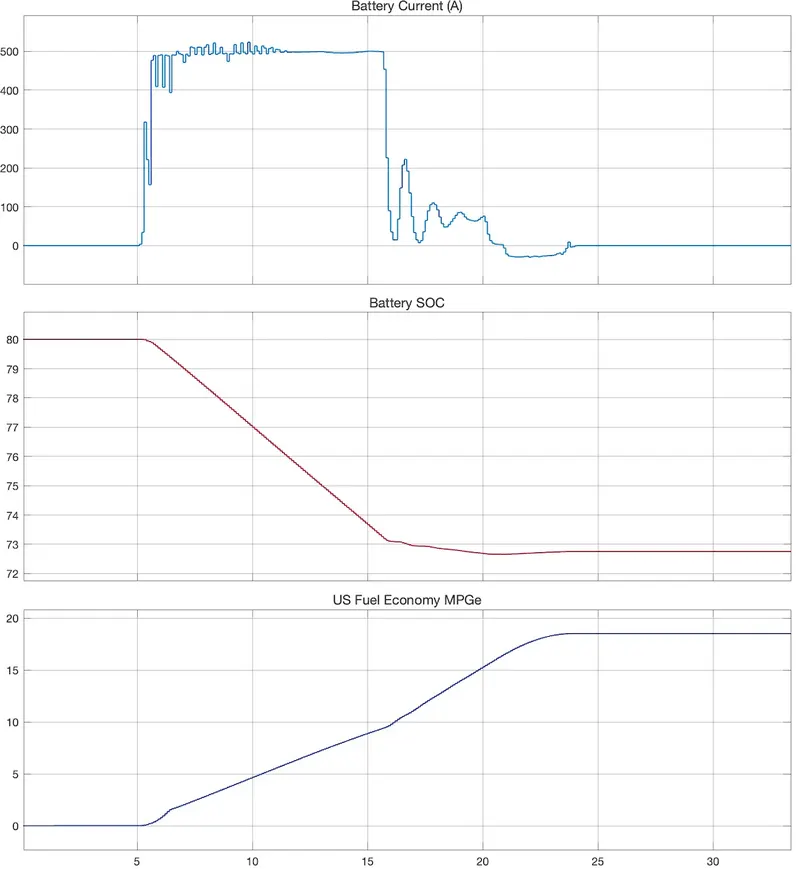
Case1. wind velocity set to 0 and grade angle to 0 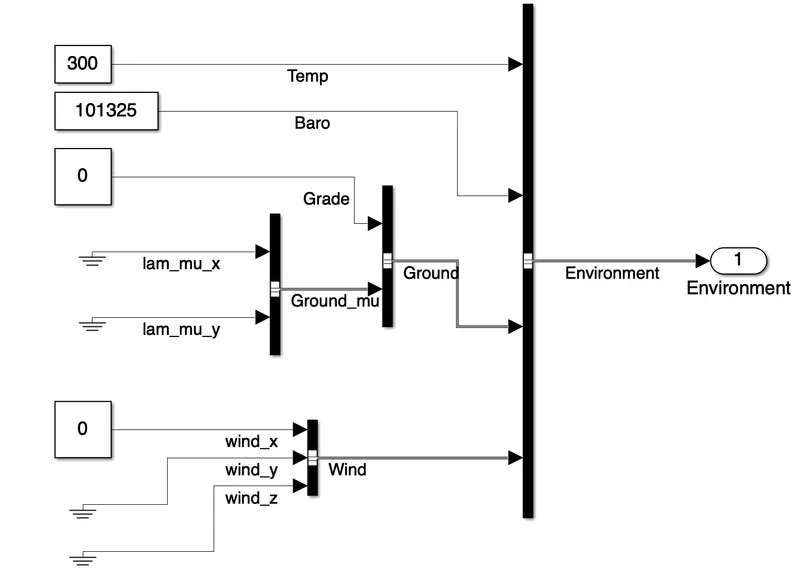
Results from Scope block after running Hev reference application
Case2. wind velocity set to 60m/s and grade angle to 10
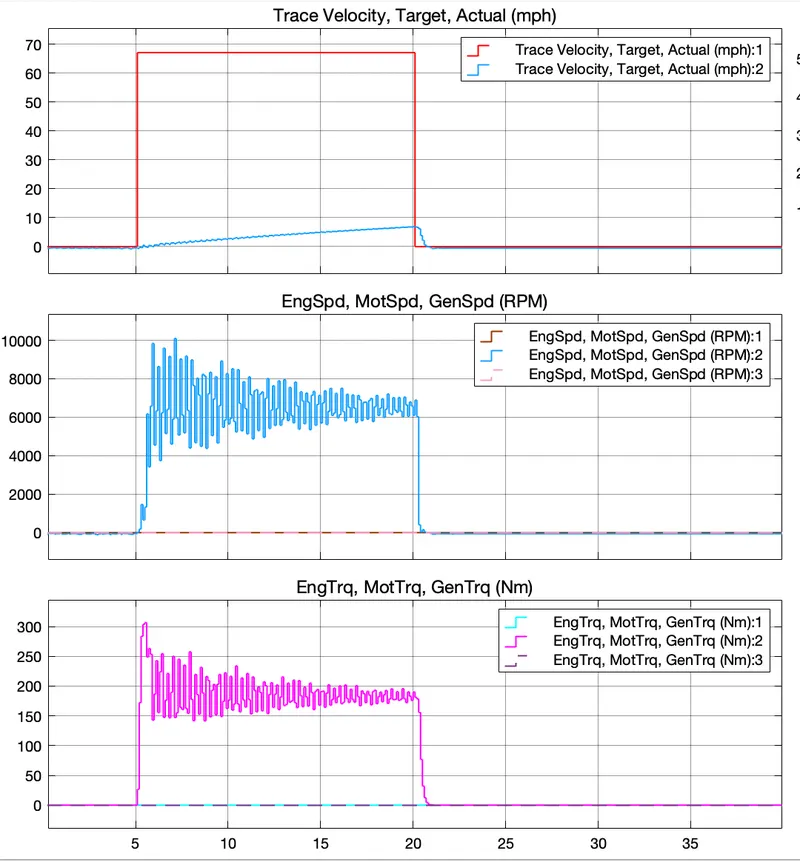
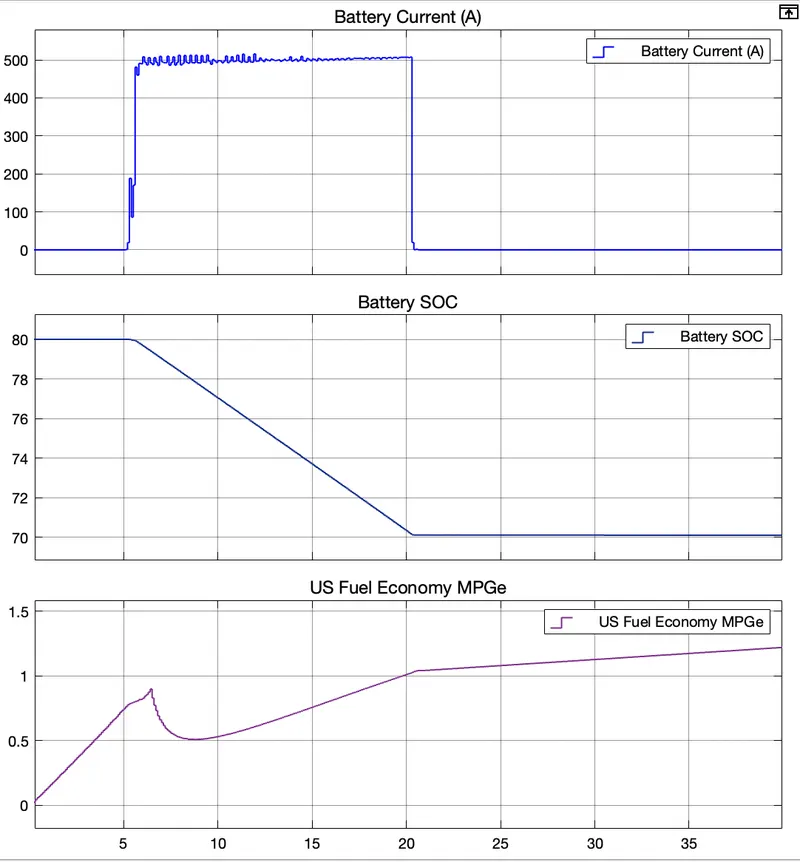
Simulation results from the scope block:
Results comparision
| Plot ref | With '0' grade and '0' wind velocity | With Grade angle 10 and wind velocity of 60m/s |
| Trace Velocity, target, Actual(mph) | 10.77 Sec to reach its maximum velocity of 67.1mph and taken 3.7Sec to fall its velocity to zero after release of WOT | The Vehicle cannot accelerate to its maximum velocity due to grade angle and wind velocity, it maximum of 6.83mph with during WOT and then decelarated to zero in 1Sec |
| EngSpd,MotSpd,GenSpd(RPM) | Attained maximum RPM of 8612 during acceleration | Vehicle reached 10094RPM |
| EngTrq,MotTrq,GenTrq(Nm) | during WOT acceleration 303.2Nm,during deleration 225,7Nm | Maximum of 306.6Nm |
| Battery Current(A) | MAximum discharge current of 521.6A during acceleration and charged 29.85A during deceleration | Maximum discharge current of 511.9A and there is no recharge current |
| Battery SOC | Battery charge fall to 72.66% from 80% in 14.8 Sec then charged a very little bit to 0.1% during deceleration | Battery charge level dropped from 80% to 70% in 15.42 Sec |
| US fuel Economy MPGe | Fuel Economy rised from 0 to 18.5MPGe in 19.1 sec including deleration time | During WOT acceleration Fuel economy dropped to a minimum value of 0.50MPGe and at the end of WOT cycle its reached to 1.01 MPGe |
4.Keeping all other parameters same, compare the simulated results of hybrid and pure electric powertrains.
Pure Electric Vehicle reference application results:
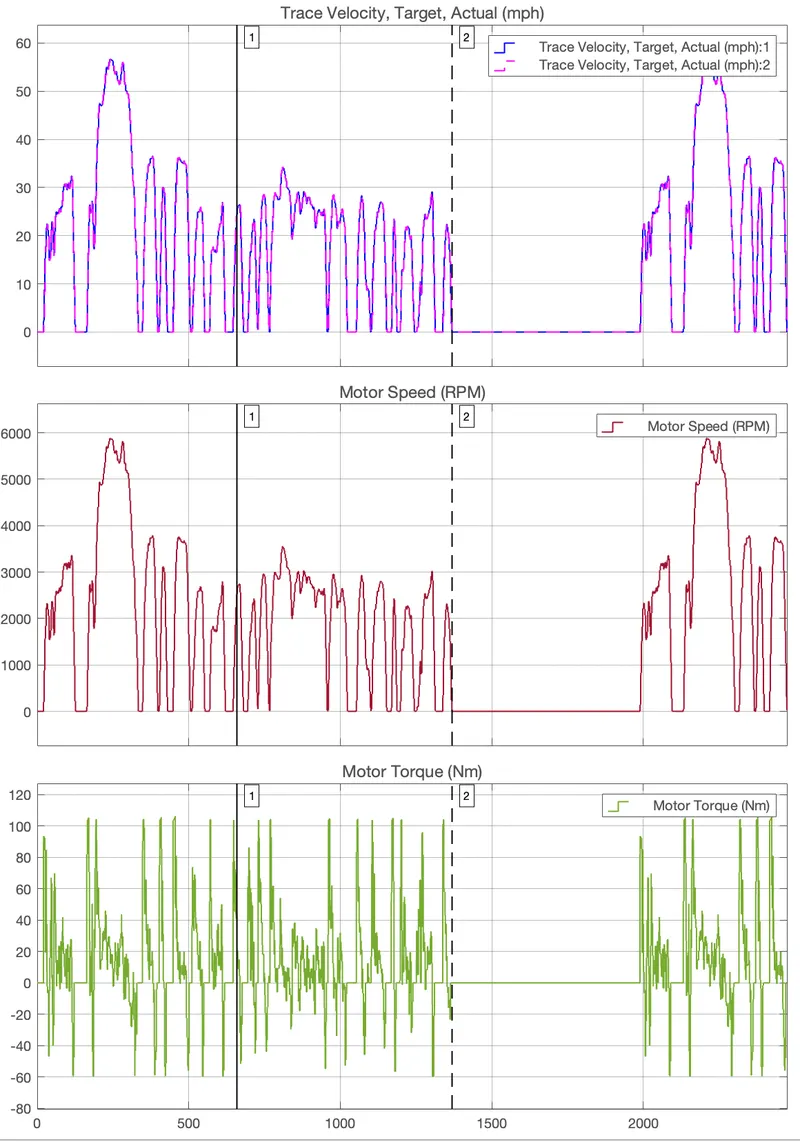
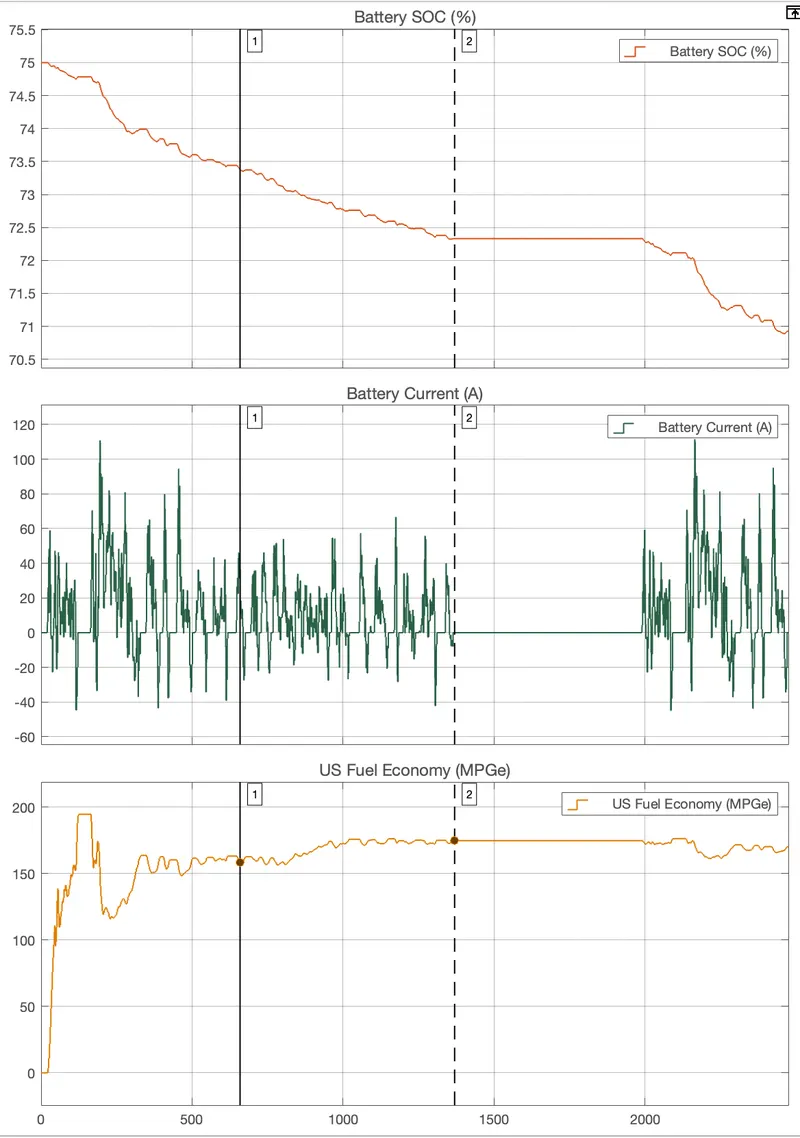
Hybrid multimode Electric Vehicle reference application Simulation results:
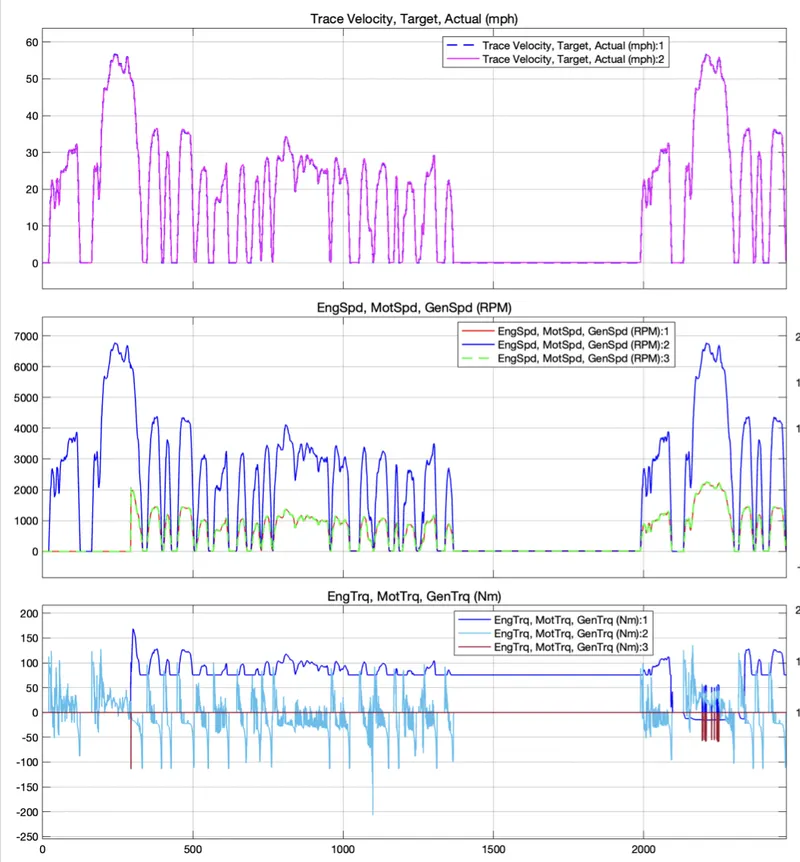 .
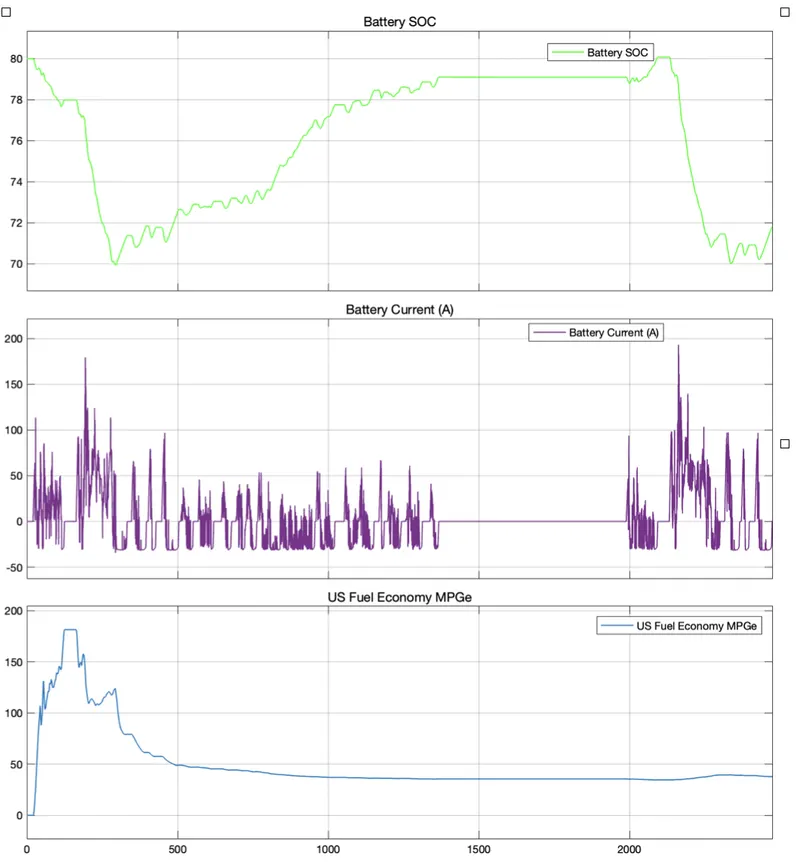
. 
Plot1: Trace Velocity, target, Actual(mph)
- Both the types, EV & HEV Vehicle Actual velocity is in line with the Drive cycle, both are capable of producing vehicle speed as per the given drive cycle
Plot2: EngSpd,MotSpd,GenSpd(RPM)
- Pure Electric Vehicle produces only MotSpd curve as it doesn't have any engine, Motor speed increases and decreases following vehicle speed requirements.
- In HEV along with motor speed, engine speed and generator speed also plotted. Initially when the vehicle startsup, it utilises battery energy to move, later when SOC of battery reaches to some minimum set value, engine runs and aids battery power, and during decelration of vehicle , generator runs.
Plot3: EngTrq,MotTrq,GenTrq(Nm)
- Whereas in case of pure electric vehicle the results shows the torque values for motor itself and those values increases and decreases indirect proportion with the speed of the vehicle.
- In case of HEV the torque of the motor shows the positive increasing values during acceleration of the vehicle whereas the motor torque decreases during the deceleration of the vehicle.
- The engine torque shows the positive values as the engine comes into the action wherever the vehicle needs extra power for the instantaneous acceleration.
Plot4: Battery Current(A)
- In both HEV and PEV the battery current increases (shows positive values) as the speed or power requirements of the vehicle increases (during acceleration) and decreases (shows negative values) as the speed or power requirements of the vehicle decreases (during deceleration).
Plot5: Battery SOC
- The battery keeps on losing its state of the charge as the cycle proceeds. Where there are less power requirements there the plot becomes stable but it cannot be improved as in case of HEV.
- In HEV the SOC of the battery is maintained between the upper and lower limits of the SOC of the battery to keep the battery always prepared for the instantaneous performance requirements.
- In such cases whenever the battery falls below the critical level the generator comes into action to restore the charge into the battery.
Plot6: US fuel Economy MPGe
- Fuel economy of an EV is inversely proportional to the speed of the vehicle as the speed increases the fuel economy decreases and as the speed decreases the fuel economy of the vehicle starts being stable and becomes stable at zero speed.
- In HEV when only the vehicle runs on battery source only, it seems from the plot that it has better fuel economy, whenever the engine power starts compensating the total power requiremnets, generator will come into action the fuel economy of the vehicle seems dropping.