Week-4 Challenge WOT Condition Part-2
WEEK 4 CHALLENGE
WOT Condition Part-2
- 1. What is the difference between mapped and dynamic model of engine, motor and generator? How can you change model type?
ANSWER:
Difference between mapped and dynamic model of engine, motor and generator.
- Powertrain Block set offers both mapping and dynamic engine models. The functions of commanded load and measured engine speed are used by mapped engines to express macro engine behavior as a series of lookup tables (brake torque, fuel flow, air mass flow, exhaust temperature, efficiency, and emissions).
- Dynamic engines break down the behavior of the engine into discrete component models that take into consideration engine dynamics, most notably the dynamics of the turbocharger and intake airflow.
- Depending on your application, you can change between different engine model kinds. For example, in the development of closed-loop AFR control algorithms, dynamic engine models are appropriate for building control, estimator, and diagnostic algorithms that depend on dynamic subsystem states.
- For example, in engine and transmission powertrain matching analysis for fuel economy, emissions, and performance tradeoffs. Mapped engine models are ideal for analytical and design operations that do not require engine subsystem dynamic characteristics.
Mapped Engine:
The powertrain block set’s default parameters are Mapped Engine. By employing common lookup tables that are preferred to the system, it is utilized to measure performance characteristics for the vehicle. The accuracy of this kind of modelling is lower. The values of the lookup tables are dependent on the brake torque, commanded torque, and engine speed values. Lookup table values are also a function of the temperature parameter if any other parameter, such as Input engine temperature, is used. The following information is taken from lookup tables: exhaust temperature, efficiency, fuel flow, emission data, and air mass flow. This information is utilized to determine additional settings that the end user need.
Dynamic Engine:
This kind of model incorporates real-time data supplied by the user at modelling time. Compared to the mapped engine model, this model is more accurate. When a vehicle's subsystem data is needed, this kind of model is employed. Braking torque, fuel efficiency, port gas mass flow, exhaust temperature, exhaust mass flow rate, and exhaust pollutants may all be calculated.
Mapped Motor:
In torque control mode, the mapped motor operates. When the user needs a speedier simulation and is unfamiliar with motor specifications, this sort of motor is employed. Changes are done after a comparison of the output torque and the reference torque. Electrical losses, maximum motor power, and input torque or speed can all be specified.
Dynamic Motor:
A three-phase internal permanent magnet synchronous motor (PMSM) is employed in the dynamic motor. The block controls the separate phase currents using three phase input voltages, which enables control of the motor torque or speed. When the user is aware of the parameters that should be used in a certain
Mapped Generator:
The mapped generator block is comparable to other blocks in many ways. The majority of the necessary information is retrieved from lookup tables matching the supplied parameters. It takes less time to simulate.
Dynamic Generator:
The dynamic generator requires the user to manually enter the settings for their own applications while it is running. The outcomes are more precise and take time.
To change Model Type:
- Open the EV REFERENCE APLLICATION from the power train block set
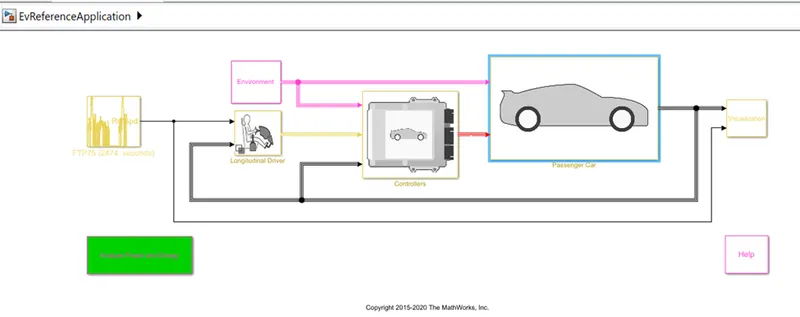
- And then open the Passenger car block.
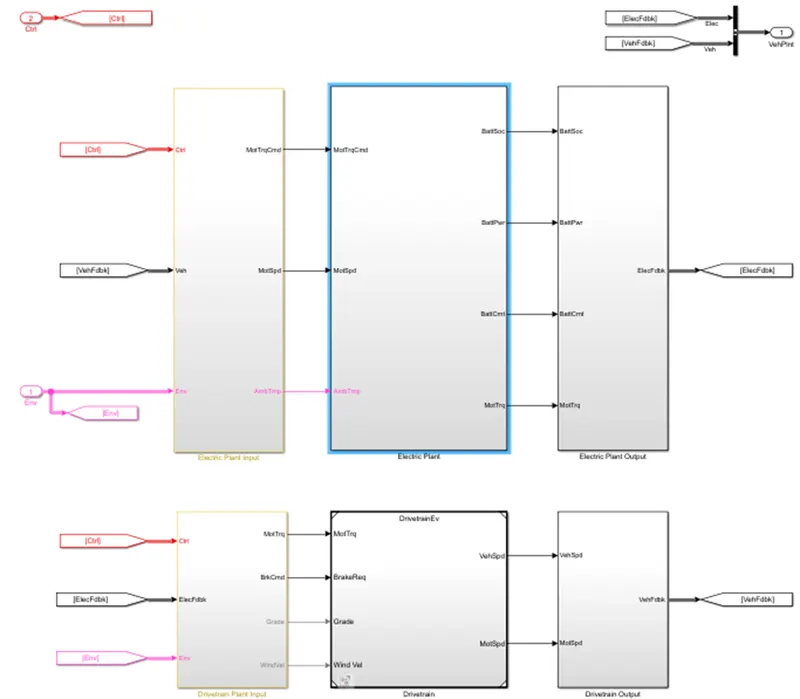
- Open the Electric plant block.
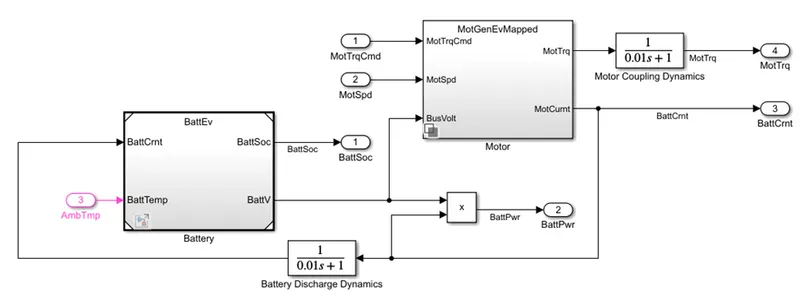
- Open the motor block inside there is two blocks
MotorGenEv Mapped & MotorGenEv Dynamic. Select the Dynamic by using this option.
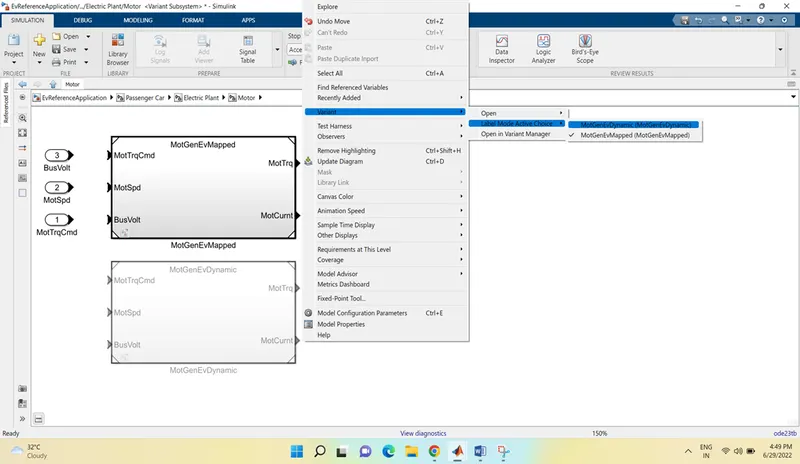
Now this is changed to the MotorGenEvDynamic type it will accordingly to the block design. And finally, the output is simulated by hitting the Run.
- How does the model calculate miles per gallon? Which factors are considered to model fuel flow?
Answer:
MILES PER GALLON
A car's fuel efficiency rating, measured in miles per gallon (MPG), is based on how far it can go on a single tank of gasoline or diesel. Although the metric equivalent is kilometers per liter, MPG is often used in metric-system nations, such as Canada.
The EPA refers to this curve as the "MPG Illusion" as it illustrates the cost-benefits of decreasing MPG with higher rating while still being cheaper and better for the environment.
For instance, a car that gets 10 MPG needs 100 gallons of fuel to travel 1,000 miles.
In contrast, a vehicle with 15 MPG will need 67 gallons of fuel.
- Open the EV Reference application, after click on the Visualization block.
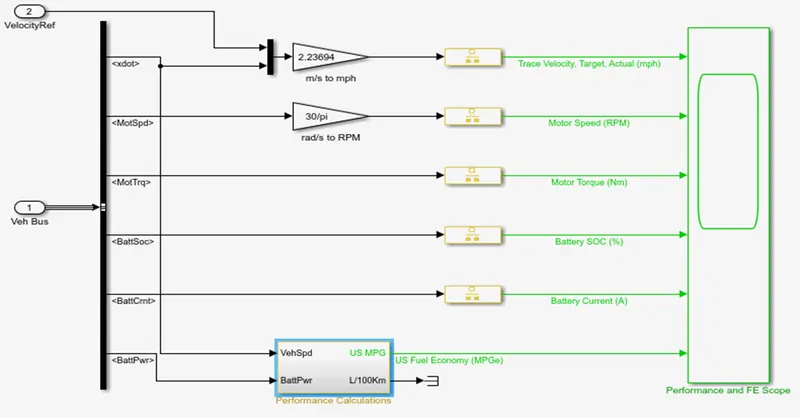
- After click on the performance Calculations Block.
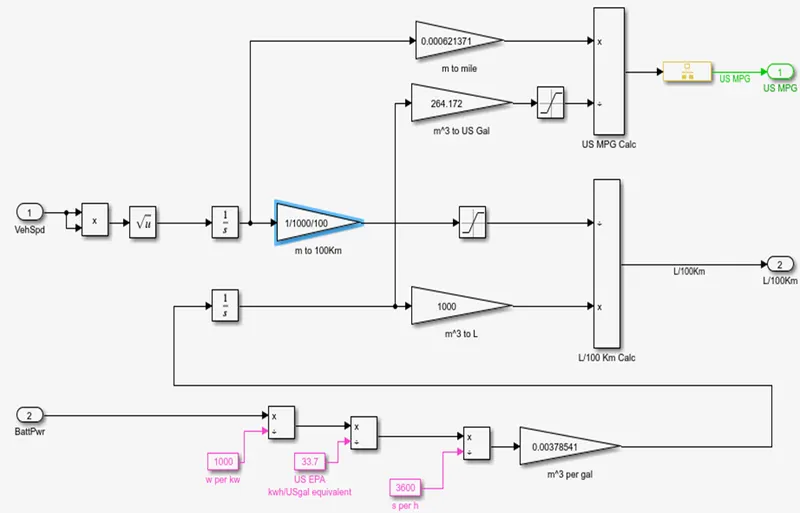
These parts contain the MPG Calculation, by referring this the Calculation is made.
There is some part are taken into the calculations that are:
- Battery Power.
- Vehicle Speed.
- Fuel Flow.
- The inputted vehicle speed is given in m/s and multiplied by 0.000621371 to get miles.
- Similarly, multiplying by 1/ (1000*0.739), one kilogram of gasoline is converted to one cubic meter.
- The cubic meter amount is then multiplied by 264.172 to get the gallons equivalent. The MPG of the car is calculated using the mile and gallon values.
- The battery value is now first changed from watts to kwh by multiplying by 1000, and then it is changed to gallon equivalent by once again multiplying by 33.7 (because 33.7 kwh equals 1 gallon).
- The figure is then multiplied by 0.00378541 to obtain the value in cubic meter per gallons after being divided by 3600 to obtain the value in seconds.
b) factors are considered to model fuel flow?
- Battery energy for greater MPGe, capacity should be high and vehicle power consumption should be low (Miles Per Gallon equivalent).
- Vehicle Speed.
- Run the HEV Reference Application with WOT drive cycle. Change the grade and wind velocity in the environment block. Comment on the results.
Answer:
HEV:
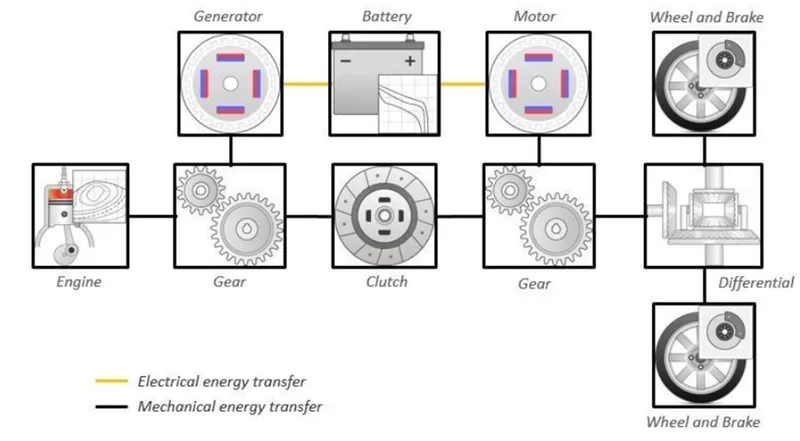
The hybrid electric vehicle reference application represents a full multimode hybrid electric vehicle (HEV) model with an internal combustion engine, transmission, battery, motor, generator, and associated powertrain control algorithms. Use the reference application for powertrain matching analysis and component selection, control and diagnostic algorithm design, and hardware-in-the-loop (HIL) testing. To create and open a working copy of the hybrid electric vehicle reference application project.
By default, the HEV multimode reference application is configured with:
- Mapped motor and generator
- 5–L spark-ignition (SI) dynamic engine
Diagram shows the powertrain configuration:
- Now open the HEV Reference Application.
- To start the Model, click on the autoblkHevStart
- Now the HEV model is loaded and attached below.
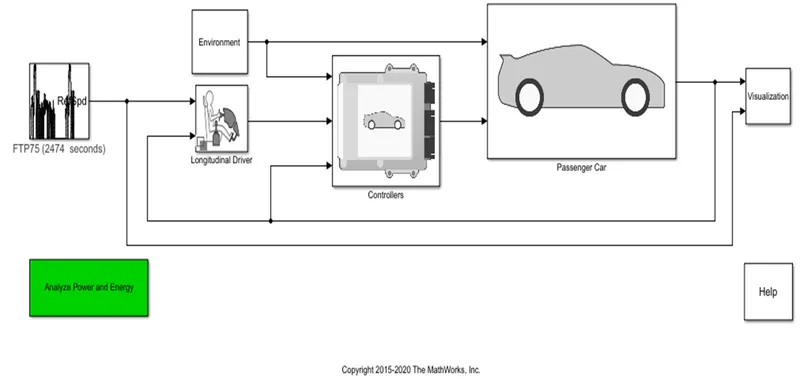
This is the Default model of the HEV before changing the Grade and the Wind Velocity.
Case 1:
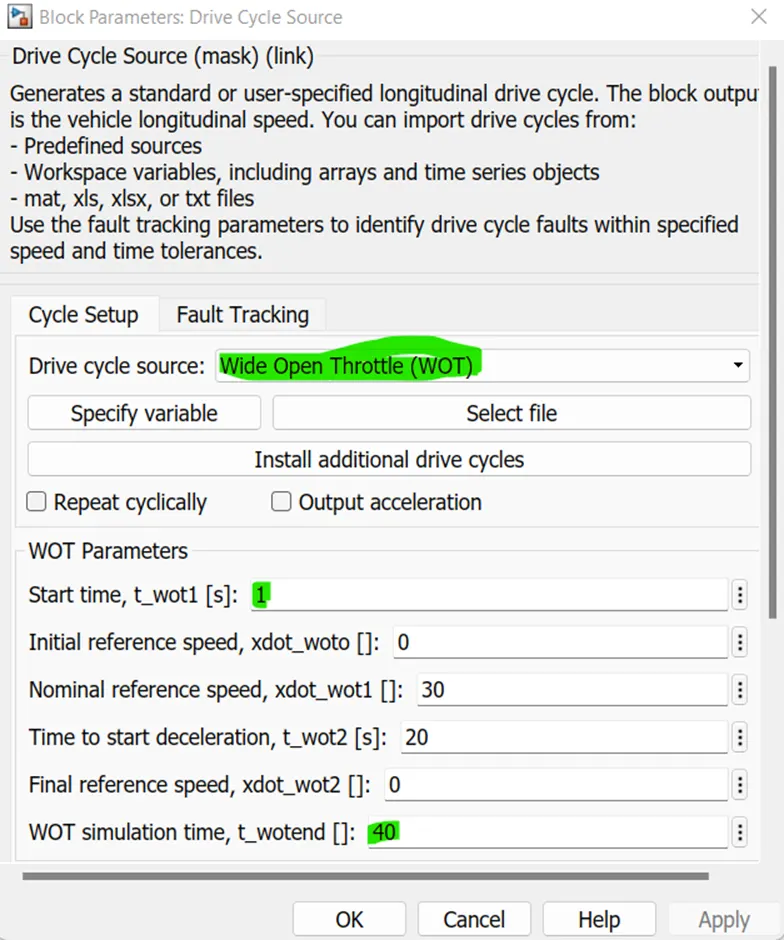
The default Drive cycle is FTP75 has to change to WOT.
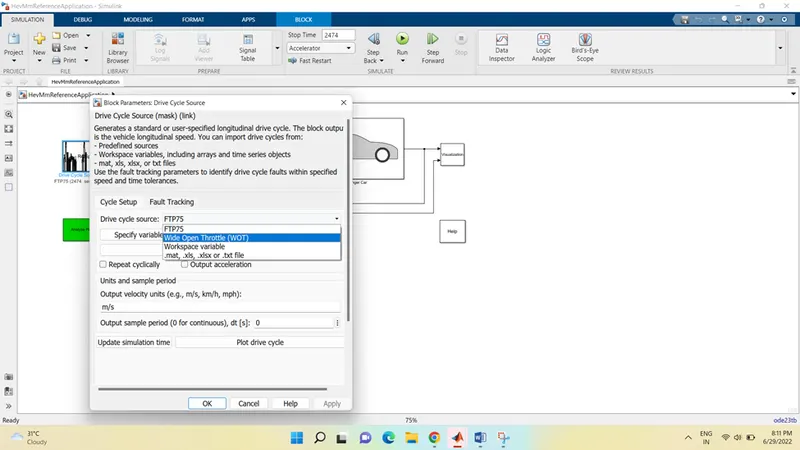
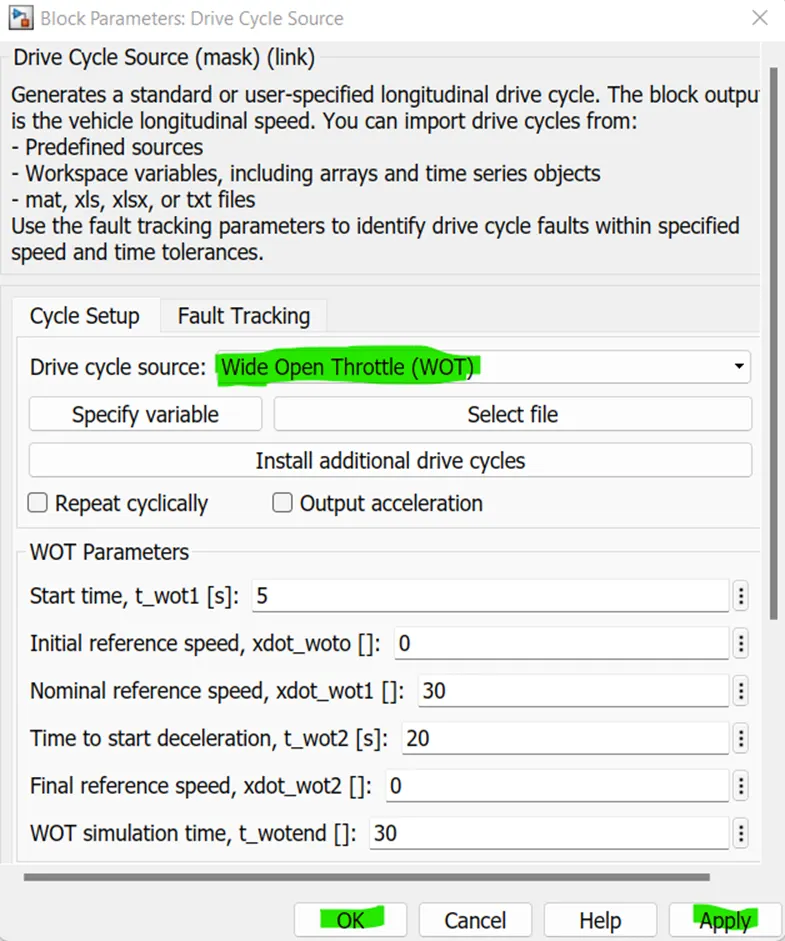
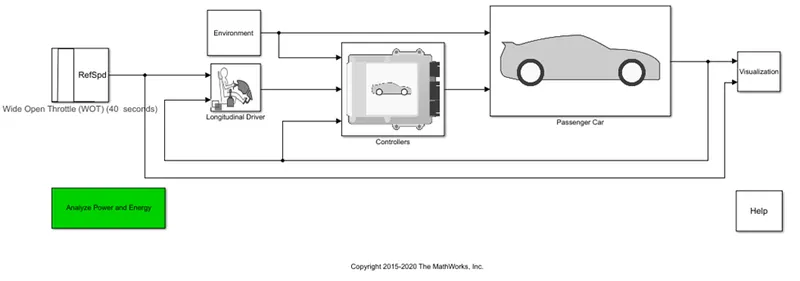
Here the simulation time is 40sec, stop time is set to 40 sec
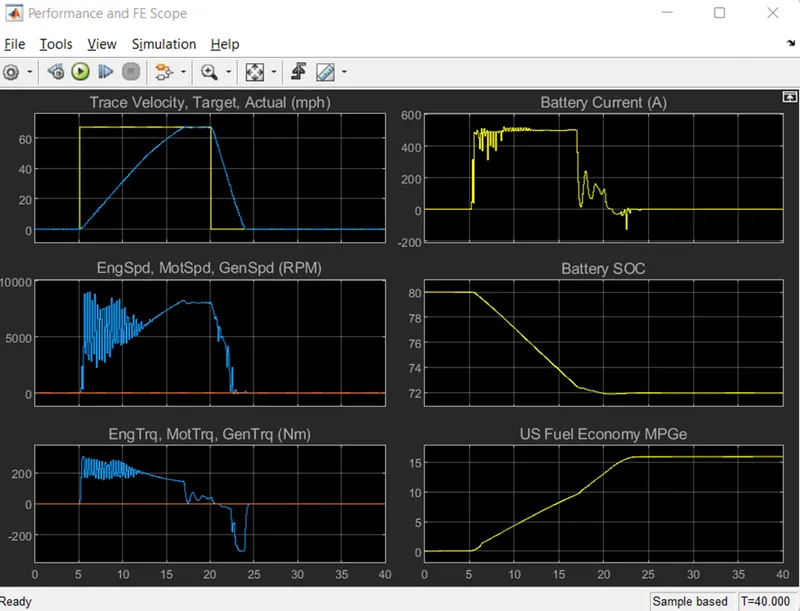
Output: (Before changing the Grade & Wind Velocity)
Changing the grade and wind velocity in the environment block:
The default value for the Grade and the Wind Velocity is “0” is now changed to
Grade = 10
Wind Velocity = 25
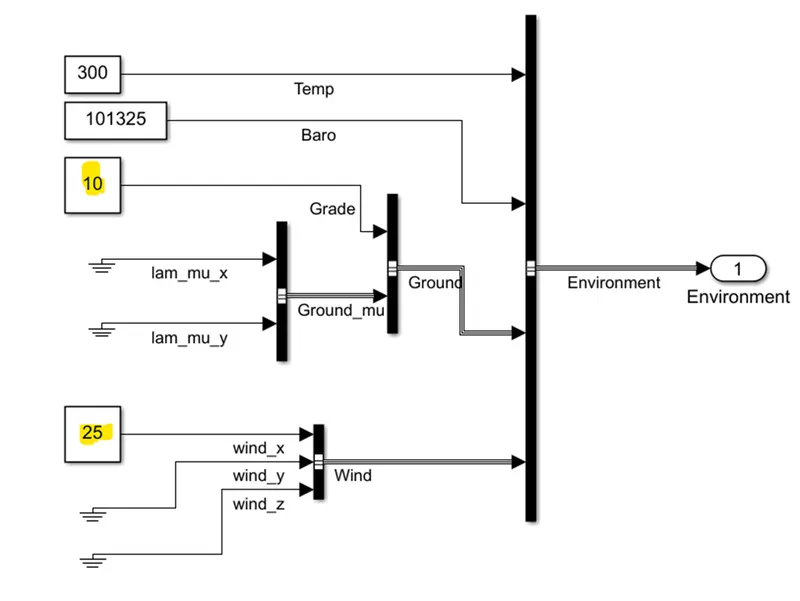
Defaults values are kept same, now hitting the run button.
OUTPUT:
Performance and FE Scope:
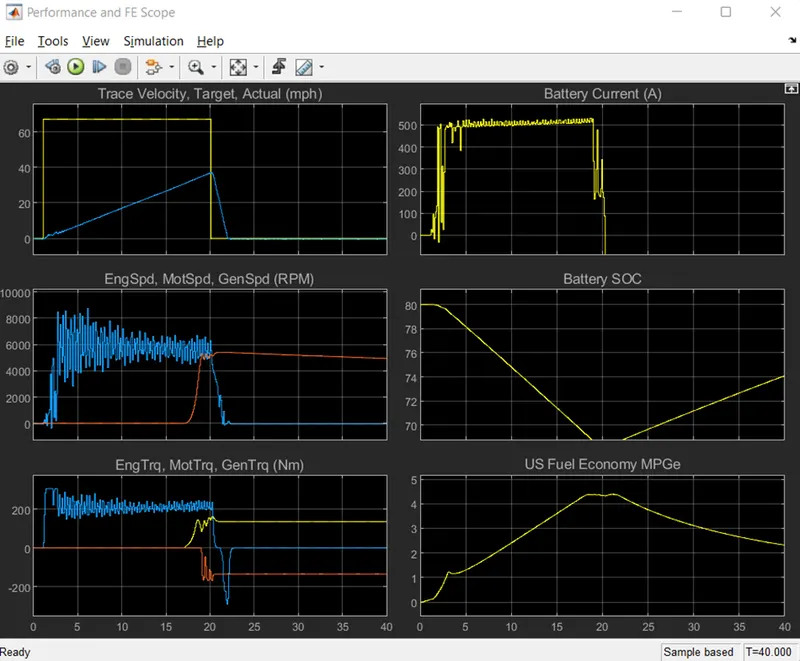
Here,
- As per the given WOT input the step time is 1 sec it reaches 58 mph and maintain the constant speed and end over the 20 sec of the WOT cycle.
- Target and actual graph for trace velocity: The yellow line shows the targeted path, while the blue line shows the actual path. Therefore, it is clear that battery power is insufficient to satisfy the demands of the gradient and wind speed.
- The velocity cannot reach the maximum and the value is 38 because the wind velocity and the grade.
- The Battery current in Amps is used for 538 amps.
- The motor Speed reaches the 8230 Rpm.
- The battery current increases along with the vehicle's acceleration. The current need likewise becomes constant as the velocity does. The battery current turns negative when the deceleration begins, suggesting regenerative braking.
- Up until regenerative braking begins, the battery soc continues to discharge. The soc rises as a result.
- Initial motor torque is high (blue line), and the engine then begins to operate later (yellow line). As the battery is being charged, the generator's torque (red line) is negative.
- Since the motor's initial torque is large, only the motor is initially used to start the vehicle. When the soc falls below 70%, the later generator (red graph), which charges the battery, starts up. The engine graph is hidden since it might have crossed over with the generator.
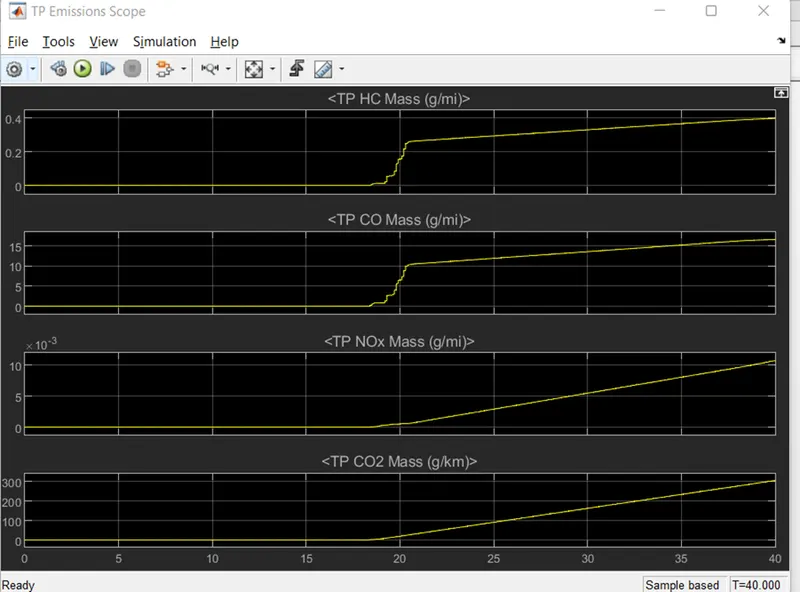
TP Emission Scope:
- Keeping all other parameters same, compare the simulated results of hybrid and pure electric powertrains.
Answer:
HEV:
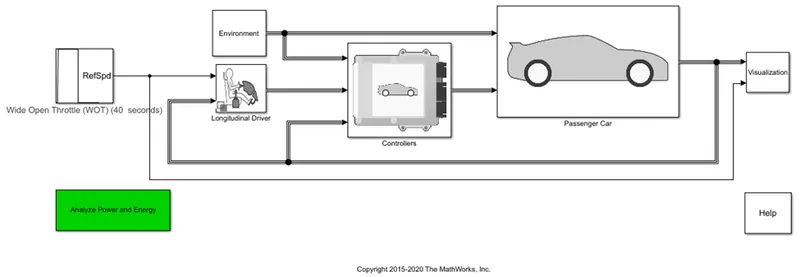
Here the input Drive Cycle is changed to the WOT that is 40 Seconds and the Simulation Time is also changed to the 40 sec, and run the simulation.
OUTPUT:
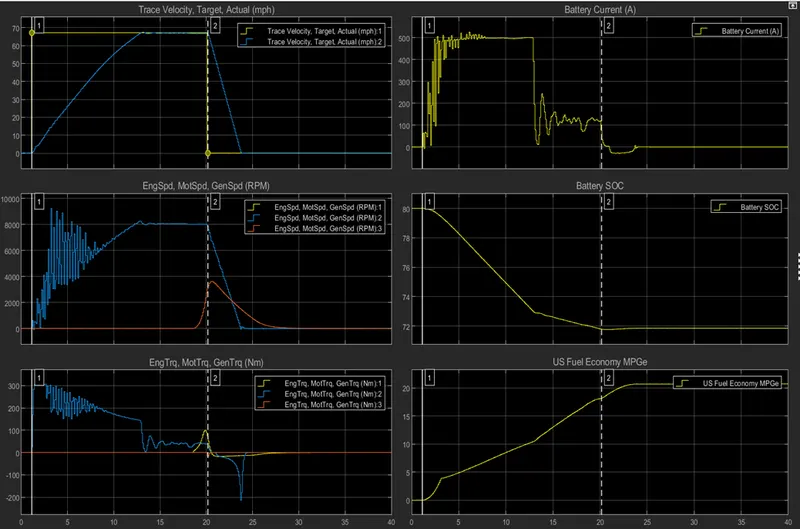
Performance and FE Scope:
TP Emission Scope:
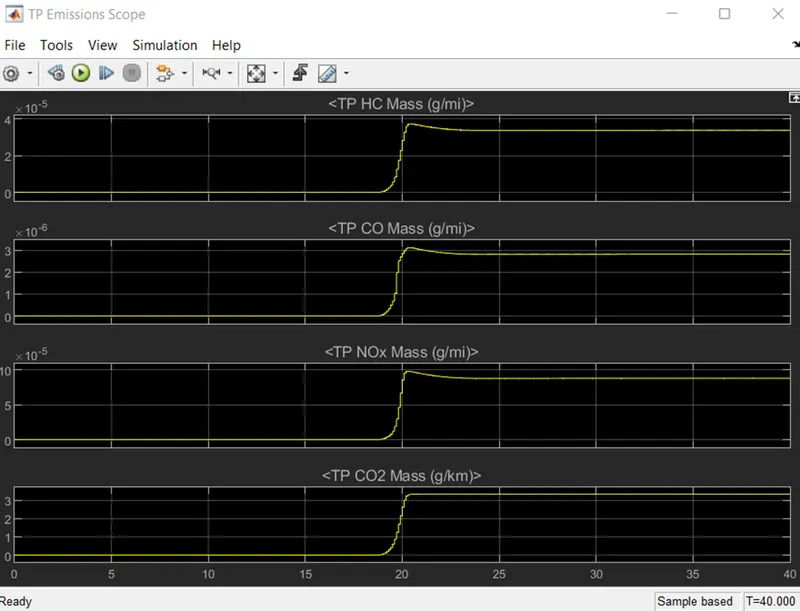
For the HEV there is a Engine there is the emission so the TP Emission Scope is attached.
Now Simulating for the EV Reference application:
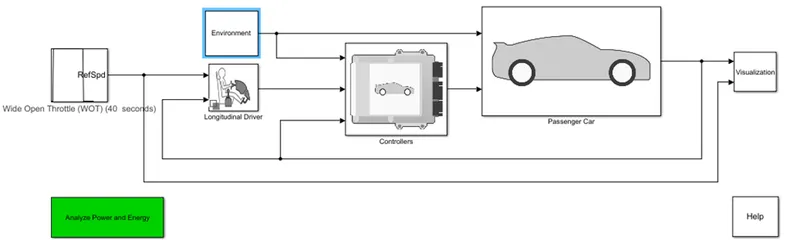
Output:
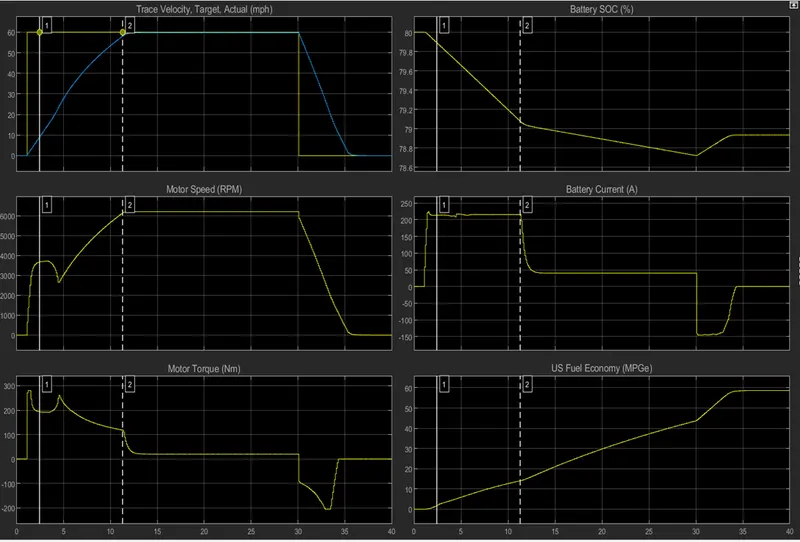
After Comparing the both graph of HEV and EV the final conclusion is:
- The fuel Economy is high on EV Compared to the HEV.
- Hybrid vehicles can go faster than electric vehicles can also reach high speed.
- Here there is no grade and the wind velocity so it reaches to the maximum extent are per the given input.
- The HEV speed is reached up to 68mph, for the Pure EV it can reach 60 mph, its is slow compared to the HEV.
- The battery current used by HEVs can reach 550 A at first and thereafter drops to 100 A. This can be due to the fact that the motor initially carries the entire load, and then when the engine kicks in later, the load on the motor decreases and the motor's current draw decreases.
- It is observed that in HEV compared to EV, negative current (regenerative braking) flows for a longer period of time during deceleration. Therefore, we might conclude that regenerative braking in HEVs is more aggressive.
- When starting a HEV, the motor speed and torque are much more erratic than they are in an EV. Additionally, EV motors have lower peak RPMs than HEVs. These variations can be attributable to the fact that EV batteries have a larger capacity than HEV batteries.
- EVs have significantly better fuel efficiency than HEVs. Because an electric motor is more effective than an engine,
Therefore, by comparing the both graphs for HEV & EV the conclusion is made successfully.
Conclusion:
Hence, for the given Questions the answer was simulated Successfully.