Week-4 Challenge WOT Condition Part-2
MAPPED MODEL:
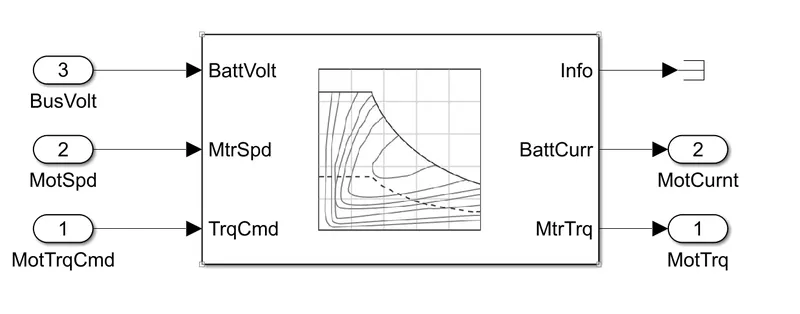
- The mapped model uses look table to map the input data to the corresponding data in lookup table to give the desire output.
- Like in this model the mapped generator takes the input of generator Torque Command, generator speed and Bus Voltage and gives output of Generator Torque and current by mapping the inputs in the look table. Similarly, the Mapped Motor takes input of Motor Torque Command, Motor Speed and Bus Voltage and gives the output Motor Torque and Motor Current by mapping the inputs to the set values for that input value in the look table.
- So, in a mapped model the output values for the simulation are obtained from a predefined data set which is used in look up table.
DYNAMIC MODEL:
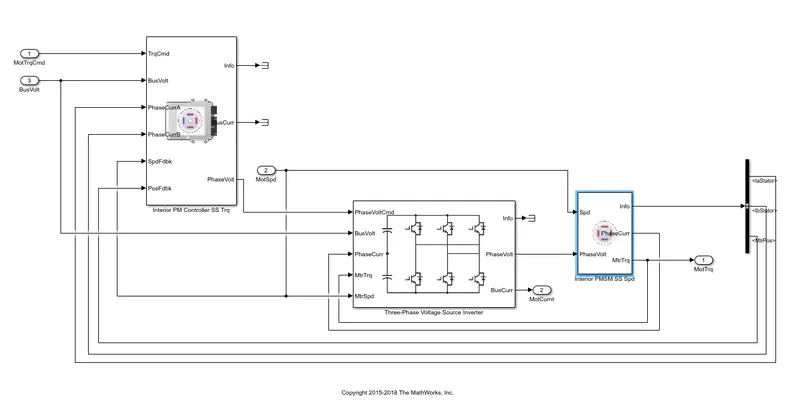
- A Dynamic model represent actual model that represent the real-world simulation by representing the actual components.
- In Dynamic model there is actual motor, Motor controller and Three phase Voltage Source Inverter. Which simulates the model in real conditions and not on experimental data sets.
How To Change The Model Type?
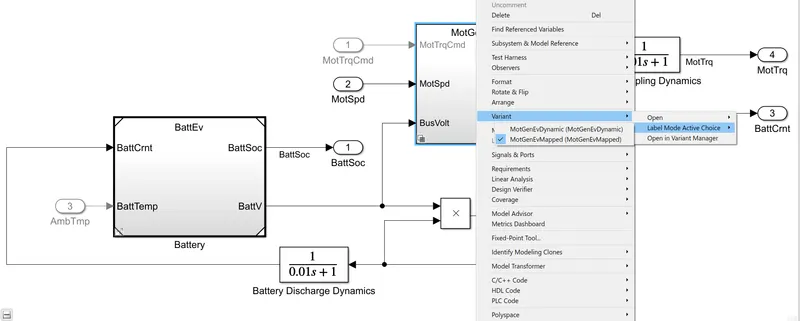
- To change the model from Mapped to Dynamic right click on the Motor or generator block.
- Then select Variant and from there select Label mode active choice.
- After that we will be able to select between Dynamic and mapped model.
- As shown in the above picture.
How Does the Model Calculates Miles Per Gallon?
1 Gallon of gasoline generates the same heat energy as 33.7 KWh of electricity according to EPA (Environment Protection Agency).
So, if an electric vehicle with 33.7 KWh energy is able to travel 100 Miles than it is rated 100 Miles Per Gallon Equivalent (MPGe).
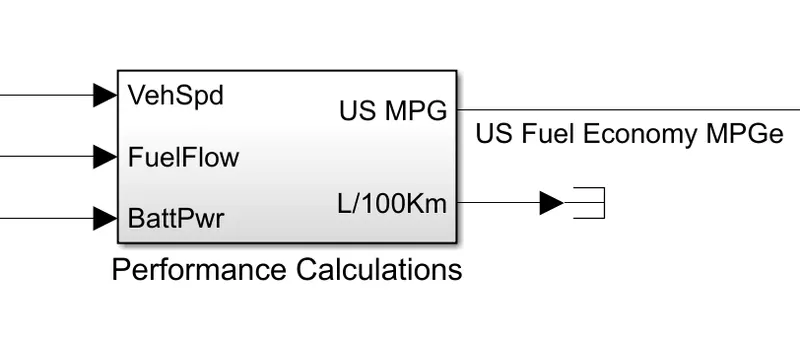
In this model three inputs are taken to calculate MPGe.
- Vehicle Speed.
- Fuel Flow.
- Battery Power.
The below image shows the same
The below image shows how the performance calculation is done.
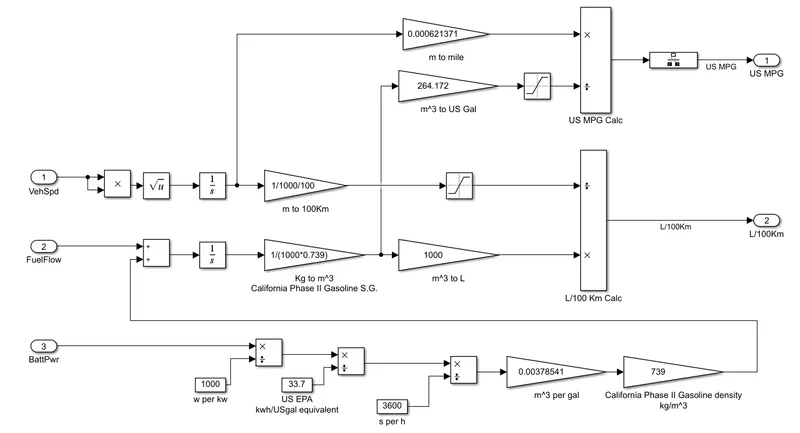
- The battery power is converted from Wh to KWH by dividing it by 1000 and then divided by 33.7 KWh to get Gallon equivalent. It is the divided by 3600 seconds to get per second. It is then multiplied by 0.00378541 to get the volume which again multiplied by density of fuel 739 to get the mass flow rate. Which further added to fuel Flow.
- The Fuel flow after getting added with battery power equivalent fuel, Kg is converted to volume by dividing the fuel mass with density 739 kg/m^3. It is further divided by 1000 to convert m^3 to liter.
- The speed is in m/sec which is integrated to get distance in meter which is converted to Km and then 100 Km equivalent by multiplying the distance in meter with 1/1000/100.
- The fuel in liter is divided by distance 100 Km equivalent to get fuel use in liter per 100 Km.
- The distance in Meter is converted to miles by multiplying it with 0.000621371 which is divided by fuel volume which is discussed earlier in the above point. Which gives US Miles Per Gallon (MPG).
HEV REFERENCE APPLICATION WITH WOT DRIVE CYCLE AND CHANGED GRADE AND WIND VELOCITY:
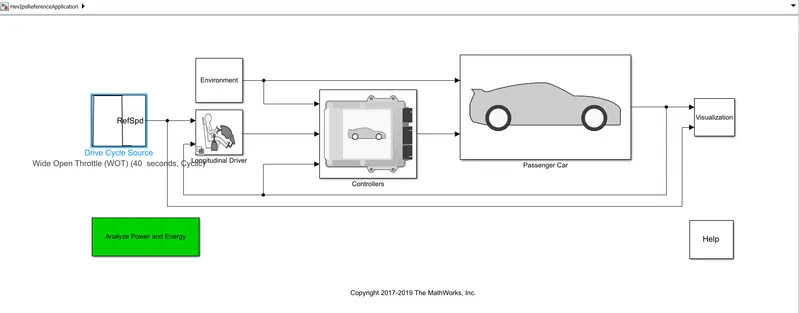
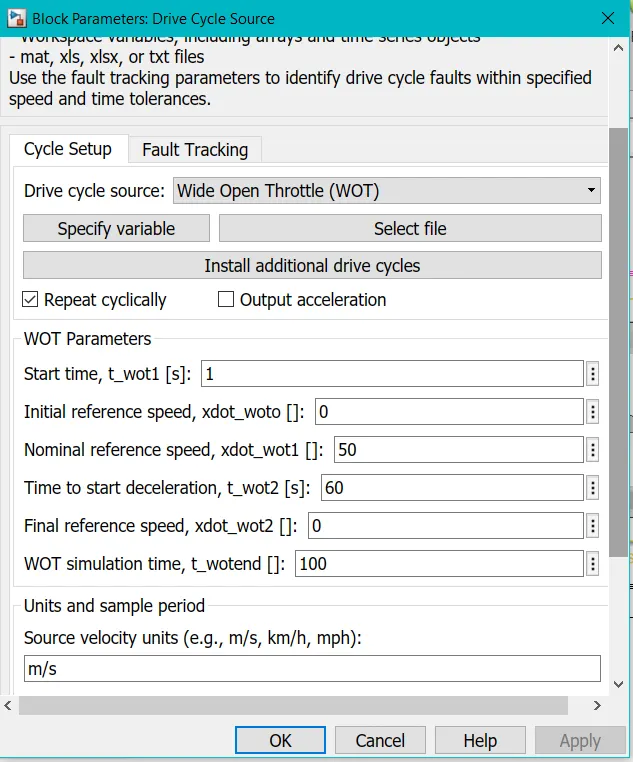
- The above image shows WOT drive cycle settings. Where Nominal reference speed is 50 simualtion time is set 100 seconds but simulation is run for 120 seconds and time to start deceleration is 60 seconds.
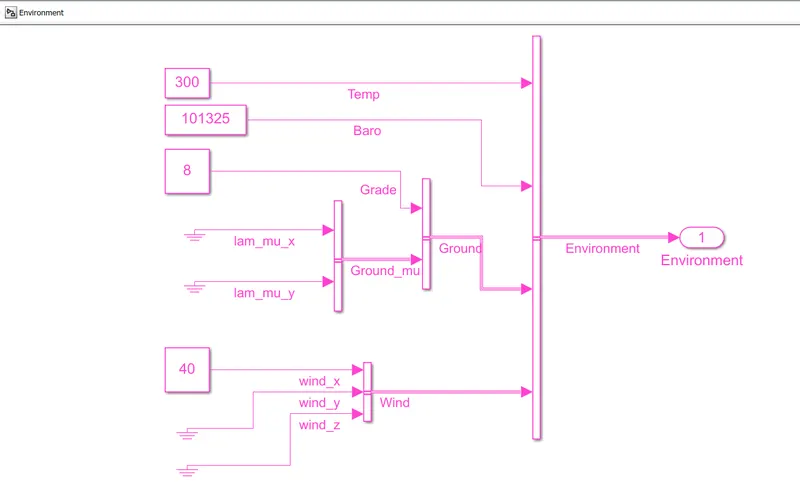
- The image shows Environment subsystem block where grade is set 8 and wind value is given 40.
RESULTS FROM THE SIMULATION:
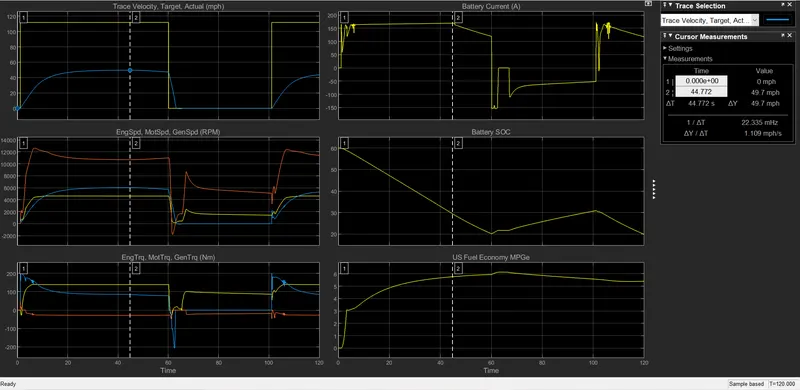
- We applied step command of full velocity within no time and it remains constant till 60 seconds. Followed by deceleration time from 60 seconds to end of simulation.
- In the first graph the blue line graph does not follow the yellow line graph cause the power is limited by the current. Plus, the grade angle and wind velocity degrade the performance further hence the speed falls.
- The acceleration time is limited by battery current, if we would have increased the battery capacity which in turn would increase battery current the acceleration time would have decrease.
THE BELOW IMAGES ARE FOR THE OBSERVATION FOR REGENERATIVE BRAKING AND BATTERY CAHRGING:
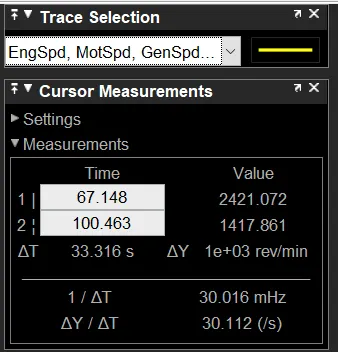
Observation is done for time range between 66 seconds to 100 seconds.
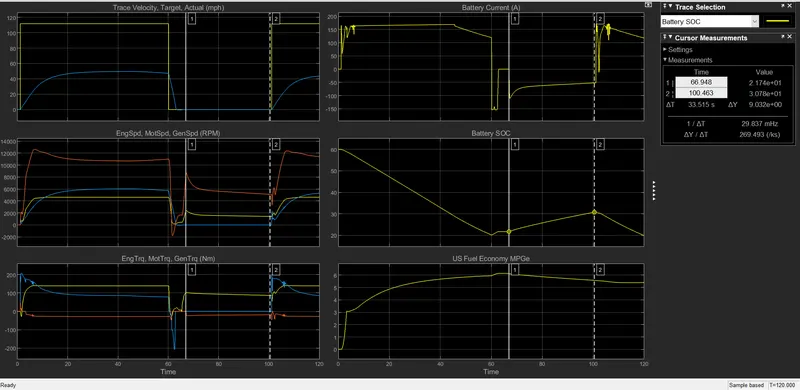
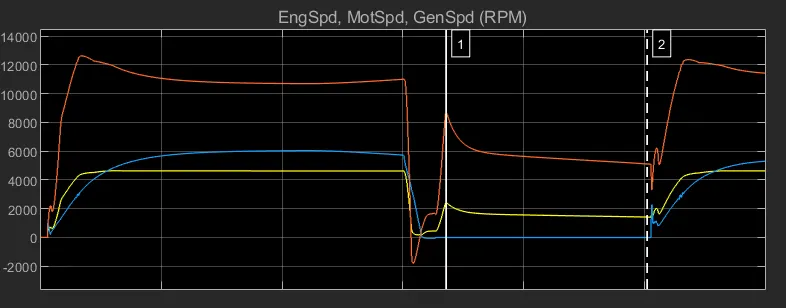
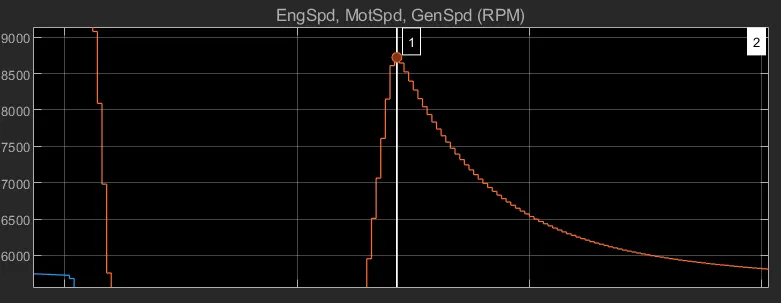
The below image shows the generator speed at cursor 1 which is not clear in the above image.
Engine Speed Observation:
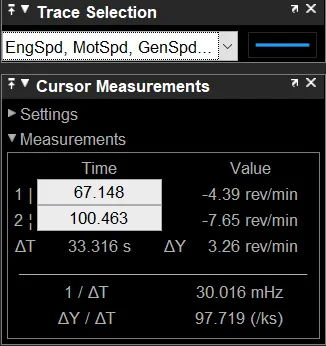
GENERATOR SPEED OBSERVATION:
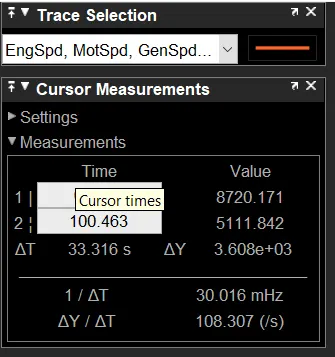
MOTOR SPEED OBSERVATION:
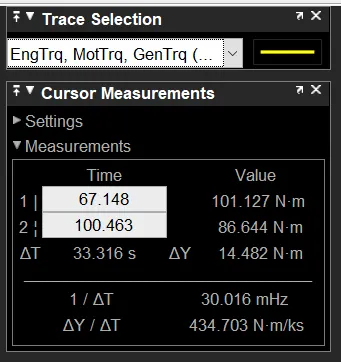
The Below Image Shows graph for Engine torque, Motor Torque and Generator Torque:
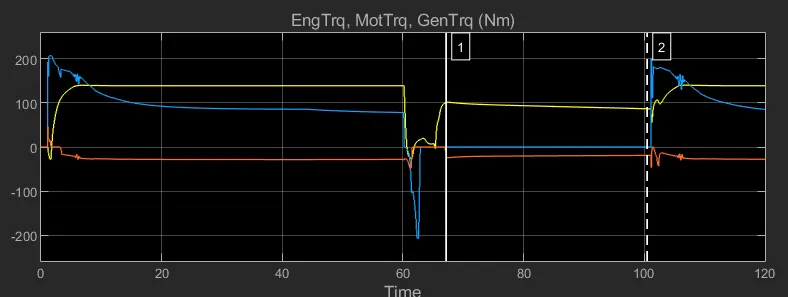
- The below image shows generator torque curve in magnified way which was not clear in above image for observation.
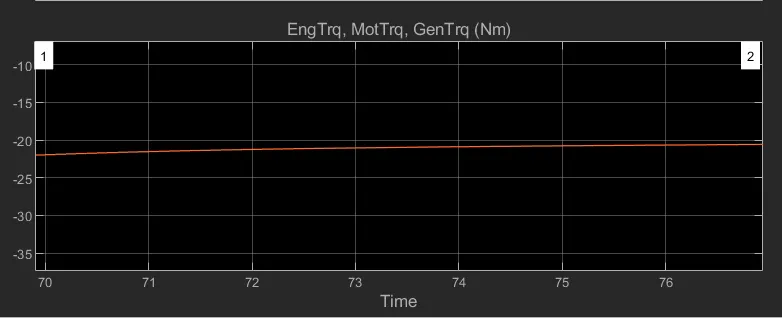
ENGINE TORQUE OBSERVATION:
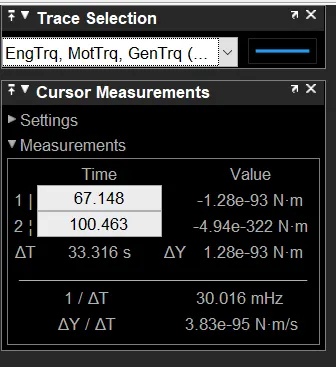
GENERATOR TORQUE OBSERVATION:
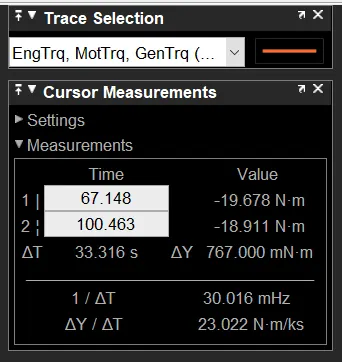
MOTOR TORQUE OBSERVATION:
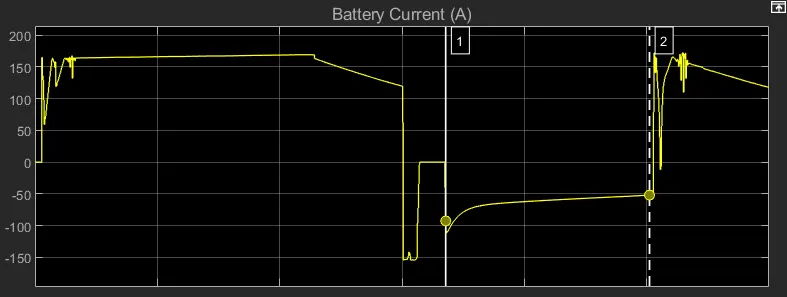
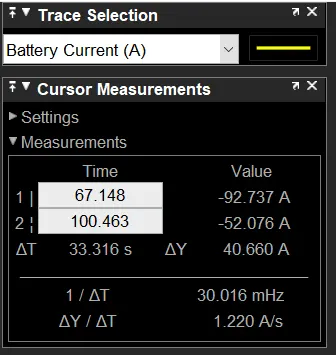
BATTERY CURRENT OBSERVATION:
BATTERY SOC OBSERVATION:
CONCLUSION FROM THE ABOVE IMAGES:
- Red color line is the generator speed line and it falls from around 8500 Rpm to around 5500 Rpm in the generator speed graph and Regeneration happens at this stage cuse vehicle and engine speed both are zero as it can be seen in the graph.
- At this stage Generator torque is negative which clearly means regenerative torque. This torque is around -22 Nm.
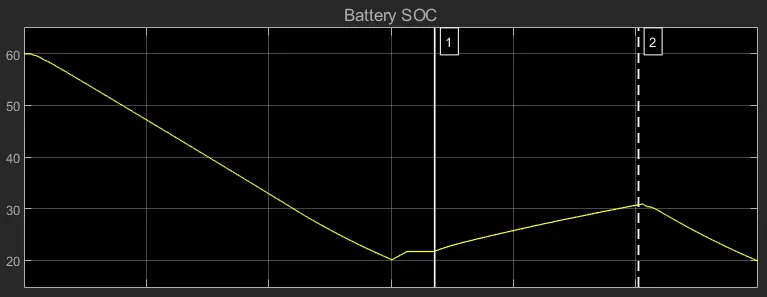
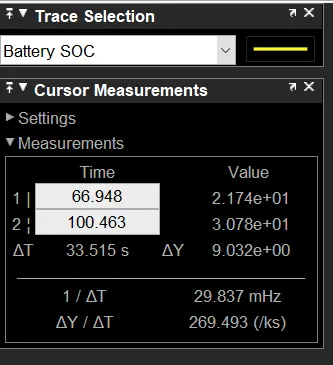
- During this time range Battery current is negative that means it is charging. which is why at same time range the battery SOC is rising from 21% to 30%.
COMPARISON OF HEV AND PURE EV POWERTRAIN:
BY KEPPING THE WOT PARAMETER, GRADE AND WIND VELOCITY PARAMETER SAME.
We get the below results.
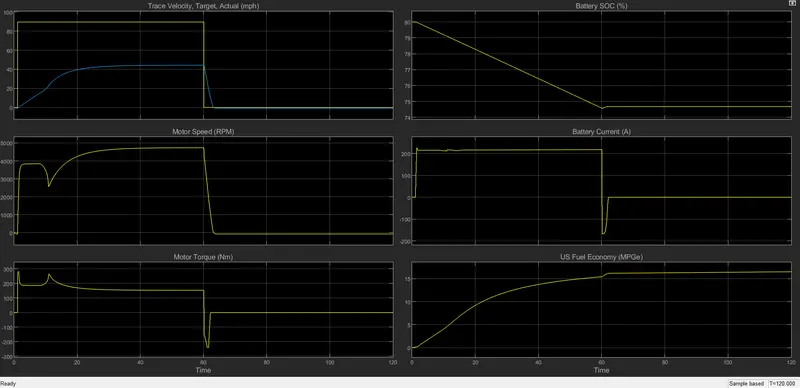
PURE EV DRIVETRAIN:
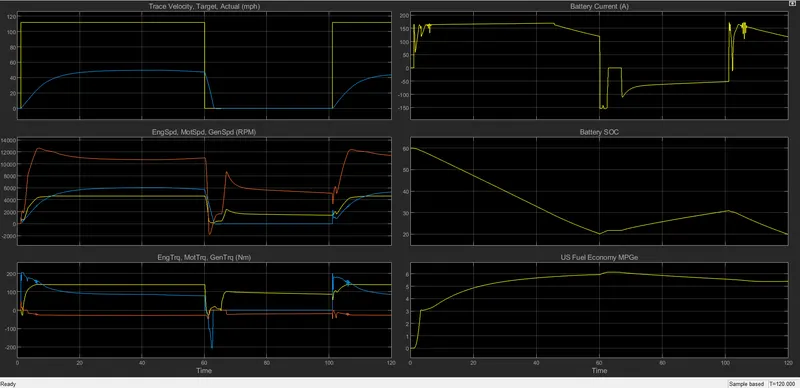
HEV POWERTRAIN:
DIFFERENCES:
As we can see both the graphs are completely different for same parameter and simulation time. If we consider the Time Range of 66 seconds - 100 second's to compare between HEV and Pure EV powertrain cause the same results for HEV have been discussed above. Then
- Vehicle velocity, Motor speed, Motor Torque and Battery current all zero in the time range of 66-100 seconds For Pure EV. which is not same for HEV and the observations are quite dynamic in HEV powertrain fro this time range.
- The battery SOC for pure EV drivetrain in time range from 66 to 100 seconds is 75% which is quite higher then HEV powertrain which is rising from 21% to 30% in time range 66-100 seconds.
- US Fuel Economy-MPGe for Pure EV drivetrain for same parameter which were given to HEV drivetrain is higher than the HEV drivetrain. For EV it is 15 MPGe for time range 66 to 100 seconds and in same time range HEV MPGe is less than 5.