Week-4 Challenge WOT Condition Part-2
TASK-1
MAPPED AND DYNAMIC MODEL
MAPPED MODEL: Mapped model is also called as the Static model. If we have data, we can map to particular block to create a mapped block. For example, if we have motors data, we can map data to particular mapped motor block. In the same way we can create the engine mapped block and generator mapped block if we have known the related data.
The static model going to work faster and it runs based on data given in the lookup table.
DYNAMIC MODEL: Dynamic model is going to represent the actual components, dynamic model is created by using the individual components of a machine so, we can analyse the impact of individual engine components on the overall performance. Dynamic model is used to analyse more detailed. If we have component level data, we can create the dynamic model.
STEPS TO CHANGE MODEL TYPE:
- Open the HEV reference application, then open the passenger car block.
- Passenger car block was created by many sub blocks like engine block, electric plant and drive train block.
- To activate other engine model, Right click on the engine block, go to variant option.
- Then go to Label model active choice.
- In that select the model which you want to activate.
- Then that model will be activated.
- In the same we can change the motor and generator model also.

TASK-2
MILES PER GALLON CALCULATION
OBJECTIVE: To find how does the model calculate miles per gallon and which factors are considered to model the fuel flow.
DESCRIPTION:
Miles Per Gallon (MPG): Miles Per Gallon is a fuel economy rating determined by how a car can travel on a gallon of gasoline or diesel.
Notations:
- 1000 w = 1kw (w/1000)
- 1 gallon = 33.7 kwh
- 1 hr = 3600 s
- 1 gallon = 0.00378541 m3
- 1 m3 = 264.172 Us gal
- 1 m = 0.000621371 mile
Block Diagram representing the how MPG will be calculated for HEV vehicle
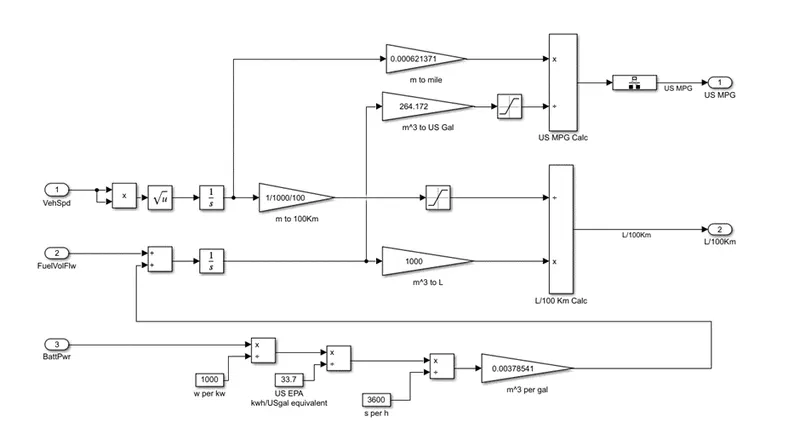
- The Hybrid Electric Vehicle uses both the battery power and the engine power to run the vehicle.
- The HEV model will calculate the MPG of the vehicle by adding the battery power and the engine power.
- The battery power is converted to kw by dividing it by 1000 (1000w per kw).
- Then the battery power in kw is divided by the US gallon equivalent (1gallon = 33.7 kwh).
- The result obtained will be in 1/hr (kw/kwh = 1/h).
- Then the time in hr is converted to sec by dividing it with 3600 (1hr = 3600s).
- The time in sec is then multiplied with 0.00378541m3 (1 gallon = 0.00378541 m3) to convert it in to m3/s.
- Then the battery power in m3/s is added to fuelvolflow as the vehicle runs with both the powers, and then integrated the result value to convert it in to m3.
- Then the value in m3 is multiplied with 264.172 (1m3=264.172 US gal).
- Here we got the equivalent value of total gallons used by the vehicle.
- To find the miles per gallon the vehicle speed is multiplied by itself.
- Then the resultant value is taken under square root and integrated to get the distance travelled by vehicle in m.
- Then the distance in m is multiplied with 0.000621371 to convert it in to mile
- The distance in mile is then divided with total gallons used by the vehicle to get the miles per gallon.
- The total gallons value is passed through saturation block by allocating the higher and lower values in the saturation block.
Factors considered to model the fuel flow
- Engine Speed
- Engine Torque
- Battery voltage (SOC)
- Vehicle weight
- Air intake
- Drive Cycle
TASK-3
HEV REFERENCE VEHICLE MODEL
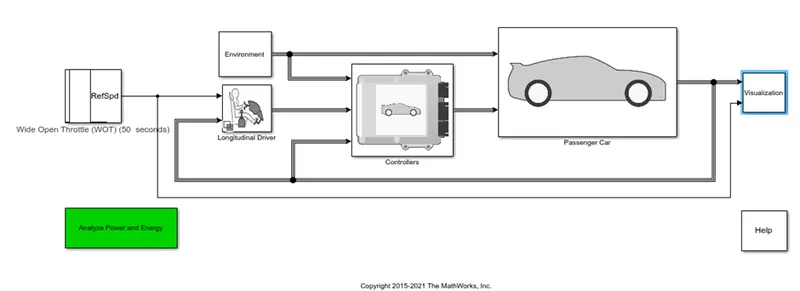
HEV VEHICLE MODEL WITH WOT DRIVE CYCLE:
CASE-1:
HEV reference file with WOT drive cycle:
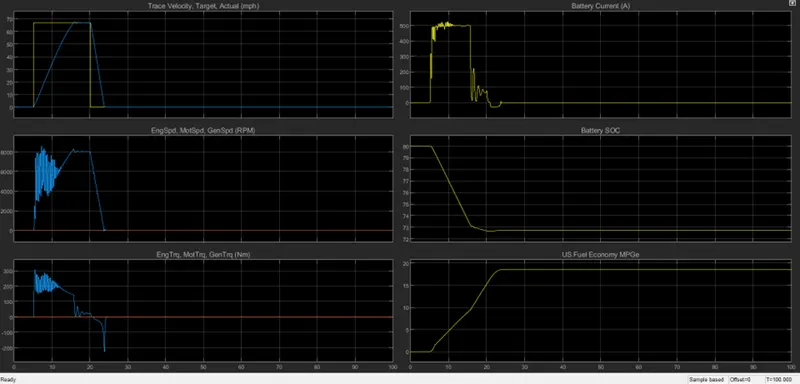
DESCRIPTION:
In this case to run the HEV model WOT drive cycle is used and given start time 5sec, nominal refence speed 30m/sec, deceleration time 20sec.
- From the above Trace velocity graph, we can observe that for given throttle input around 67mph motor accelerated to its maximum speed around 67mph in 10.6secs.
- In this case battery power alone driven the vehicle throughout the entire drive cycle so, engine stayed in off mode which we can observe in the second graph i.e., motor, engine, generator speed graph.
- We can observe that top speed of the motor is around 8600rpm at 7.2sec.
- Battery current reaches to around 525A at the time of starting and settled at around 500A and current decreased due to deceleration.
- Battery state of charge (SOC) is 80% before start of vehicle and 70% battery discharged. SOC reached to 73% at the end of the drive cycle.
- We can also observe gasoline equivalent MPGe
CASE-2:
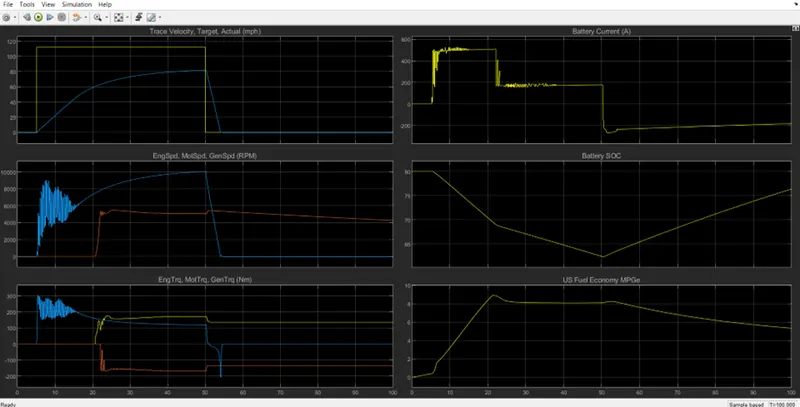
DESCRIPTION:
In this case to run the HEV model WOT drive cycle is used and given start time 5sec, nominal refence speed 50m/sec, deceleration time 50sec.
And also changing the parameters Gradeability=7, wind velocity=6;
- From the above Trace velocity graph, we can observe that for given throttle input around 100mph motor accelerated to its maximum speed around 80mph in 40secs.
- Here in this case motor output speed is not reached to its 100% input acceleration due to added effect of wind velocity and gradeability.
- In this case both motor and engine operated to drive the vehicle because battery power alone not sufficient enough to run the vehicle throughout entire drive cycle which we can observe in the second graph i.e., motor, engine, generator speed graph.
- Motor is alone operated from starting of drive cycle up to 20secs.
- After 20secs engine started to run the vehicle.
- We can observe that top speed of the motor is around 10000rpm at 50sec. At that time both engine and motor are together driving the vehicle.
- Torque of the motor and engine is positive and generator toque is negative.
- Battery current reaches to around 525A at the time of starting and after staring the engine it falls down to around 200A.
- Battery state of charge (SOC) is 80% before start of vehicle and 18% battery discharged. SOC reached to 62% at the end of the drive cycle.
- We can also observe gasoline equivalent MPGe
TASK-4
COMPARISON OF EV AND HEV MODEL
To compare the EV and HEV models used WOT drive cycle and given start time 5sec, nominal refence speed 50m/sec, deceleration time 50sec for both models.
And also changing the parameters Gradeability=7, wind velocity=6 for both models and keeping all other parameters same.
HEV Results:
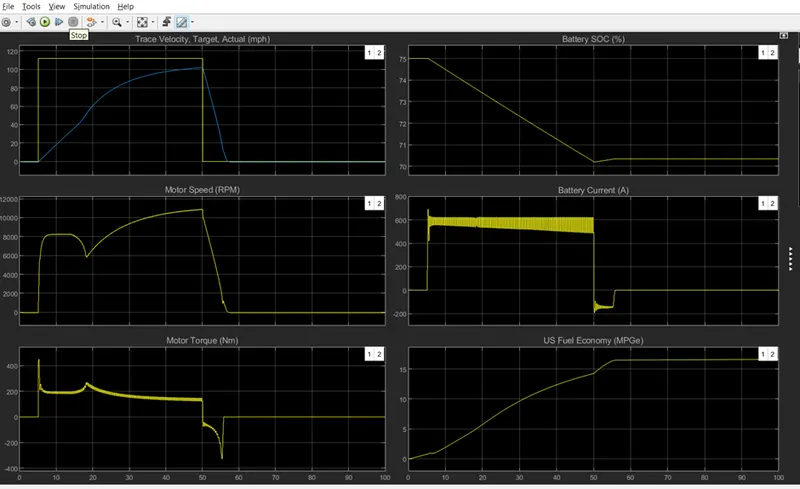
EV Results:
COMPARISON:
- By comparing EV and HEV results we can observe that max velocity of EV is 100mph and max velocity of HEV is 80mph.
- Motor torque is high in HEV compared to EV. In HEV motor torque is around 300NM in EV motor torque is around 200NM.
- Battery SOC is dropped from 80% to 62% in HEV and SOC is dropped from 75 % to 70% in EV.
- Battery current in HEV around 500A in motor alone mode, after starting the engine battery current dropped to around 200A, but in EV its fluctuated around 600A.
- US fuel economy is higher in pure EV vehicle compared to HEV.