Week-4 Challenge WOT Condition Part-2
Ans1A:
Difference between mapped and dynamic model of Engine, Motor and Generator
Mapped model vs Dynamic model
- Mapped models are basically look up tables with predefined valuse but Dynamic model input values are calculated by simulink blocks.
- Mapped model simulation time is much lesser than dynamic blocks.
- The actual resuts may not reassembles the simulation result for mapped model but it does for Dynamic model.
| Mapped engine model | Dynamic Engine model |
| It represent overall engine behaviour as a set of lookup tables as the functions of commanded load and measured engine speed. | It disintigrate engine behaviour into individual component models that account for engine dynamics. |
| Suitable for analysis and design activities that do not require an engine subsystem dynamic characteristics. | Suitable for designing control, and diagnostic algorithms that depend on dynamic subsystem states. |
| Mapped Motor model | Dynamic Motor model |
| It implements mapped motor and drive operating in torque-control mode. The output torque tracks the torque reference demand and includes a motor-response and drive-response time constant. | The model will be built using Simulink blocks and feedback. |
| Mapped Generator model | Dynamic Generator model |
| All the parameters will be pre-defined in the block for this model. | This model will be built using the Simulink blocks and the all the input values will be dynamic. |
Ans1B: How to change model type in a simulaton
- step1: Install powertrain blockset addon to matlab.
- step2: Open Matlab.
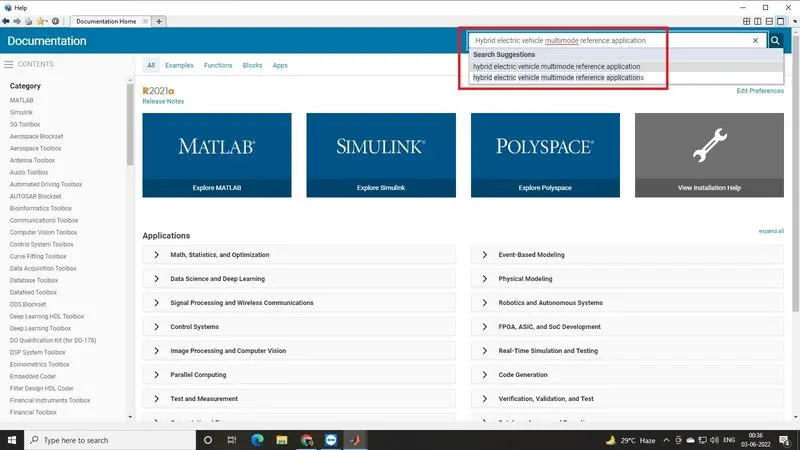
- step3: Click help and search for "Hybrid electric vehicle multimode reference application".
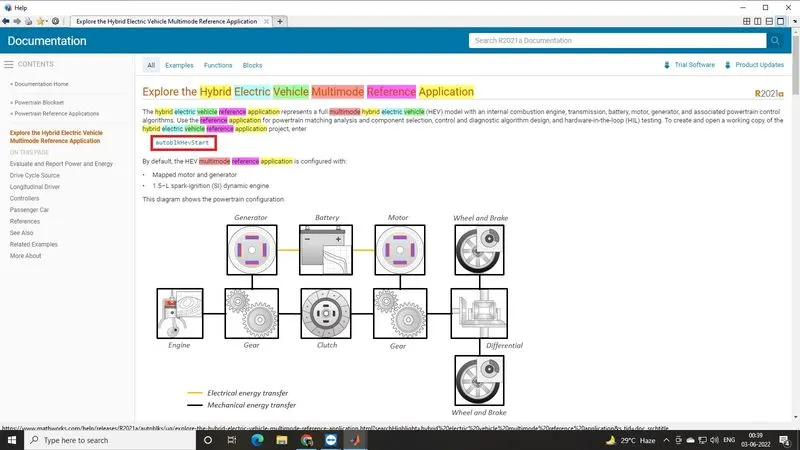
- step4: Click on "
autoblkHevStart" (wait till its create and open a working copy of the hybrid electric vehicle reference application project)
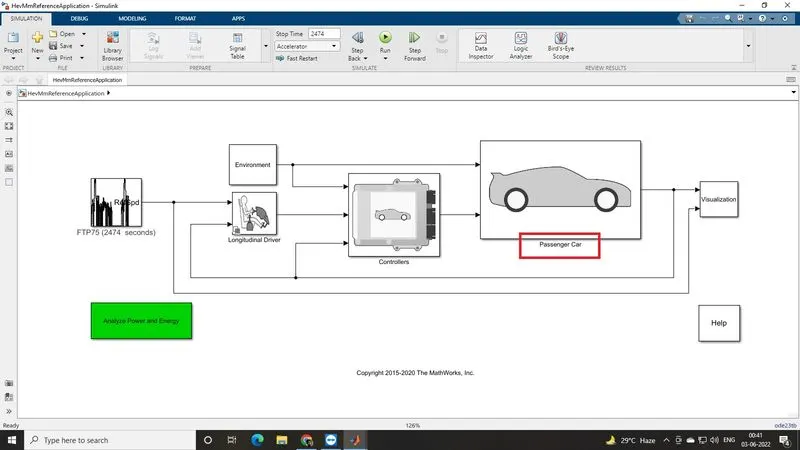
- step 5: Open the block named as Passenger car.
- step 6: Again open the block named as electric plant and here we will find three main blocks are battery , generator and motor.
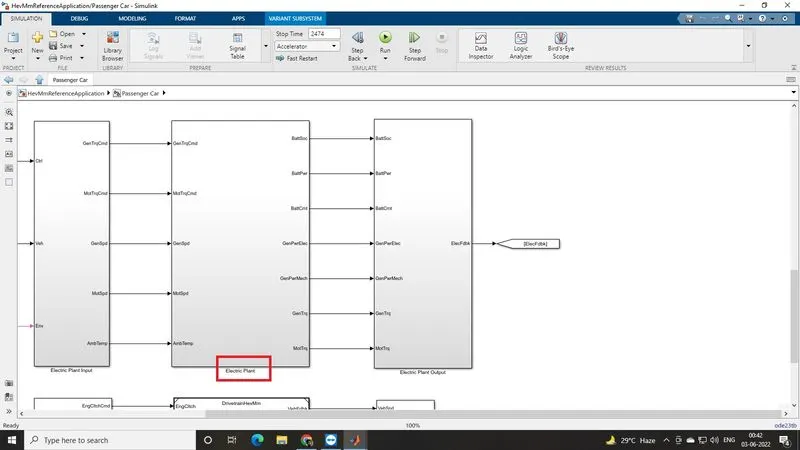
- step7: Generator and motor blocks contains both mapped model and dynamic model which are named as GenMapped / GenDynamic and MotMapped / MotDynamic.
- step8: Open generator block , from toolstrip bar open modelling and expand design tab and click variant manager.
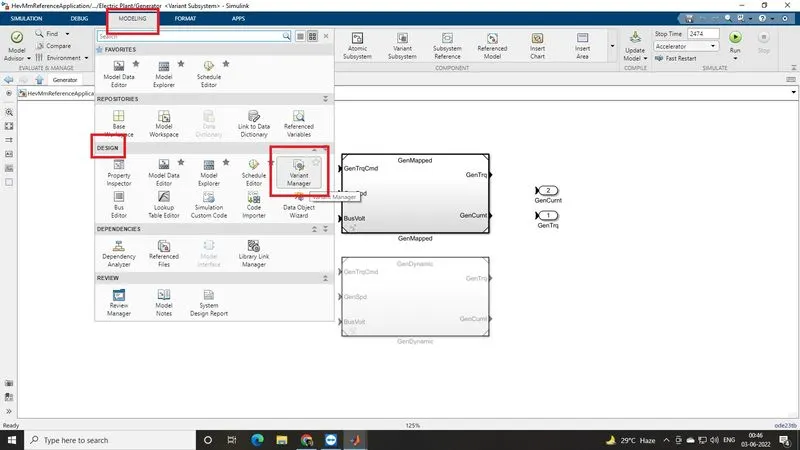
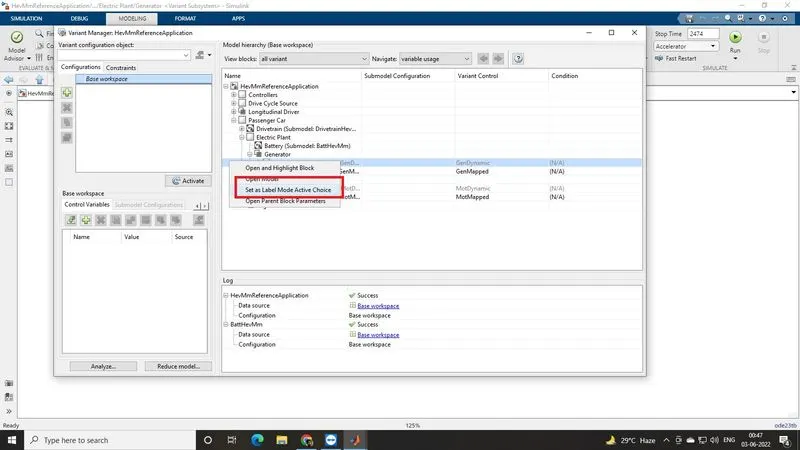
- step9: A new window will open for variant manager. Here from model hierarchy expand motor and generator.
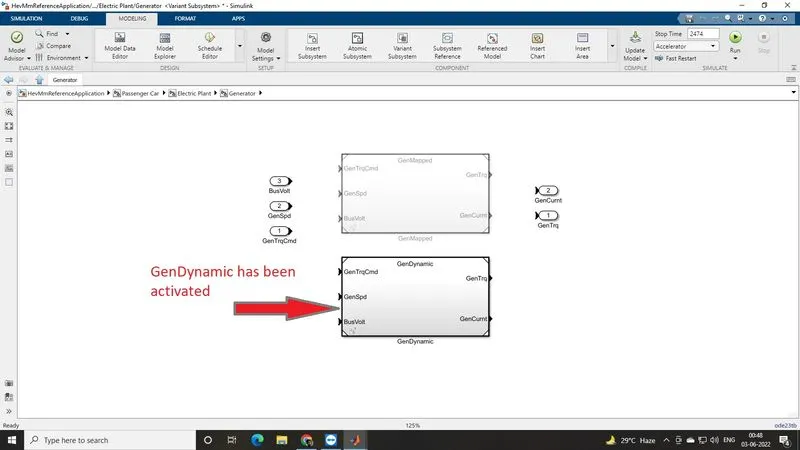
- step10: Set MotDynamic and GenDynamic active by selecting "set as level mode active choice" which will activate the Dynamic model.
- step11: Set MotMapped and GenMapped active by selecting "set as level mode active choice" which will activate the Mapped model.
Ans2A: How does the model calculate miles per gallon?
Miles per gallon or MPG: MPG, or miles per gallon, is the distance, measured in miles, that a car can travel per gallon of fuel. MPG is also the primary measurement of a car's fuel efficiency: The higher a car's MPG, the more fuel efficient it is. The U.S. Environmental Protection Agency, or the EPA, is the government agency responsible for certifying a vehicle's MPG figures. A car's MPG can be inconsistent because it is affected by a number of different factors, so it is difficult to get an accurate measurement. For example, factors like traffic and road conditions can affect MPG in any given context. That's why the EPA runs tests over a standard set of courses, then averages the results to calculate a vehicle's official MPG.
Miles and gallons are imperial measurements that are used in the United States. We're unlikely to see these measures in Europe or Asia. Instead, European/Asian countries use liters per 100 kilometers, or l/100km, to measure fuel efficiency.
Calculating MPG as per the model:
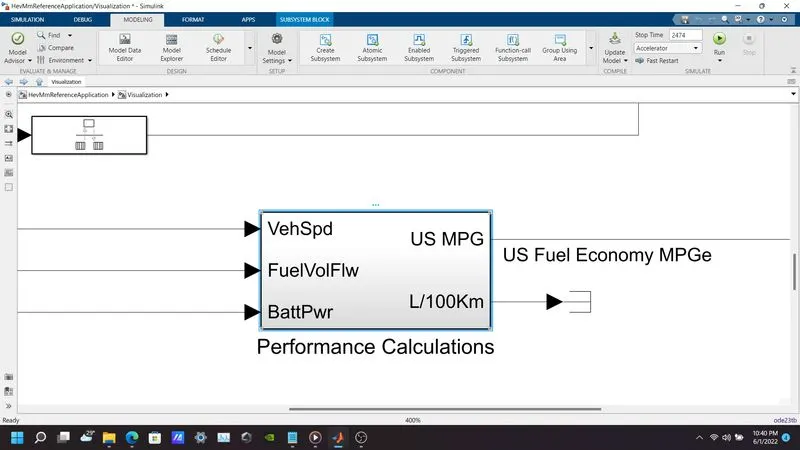
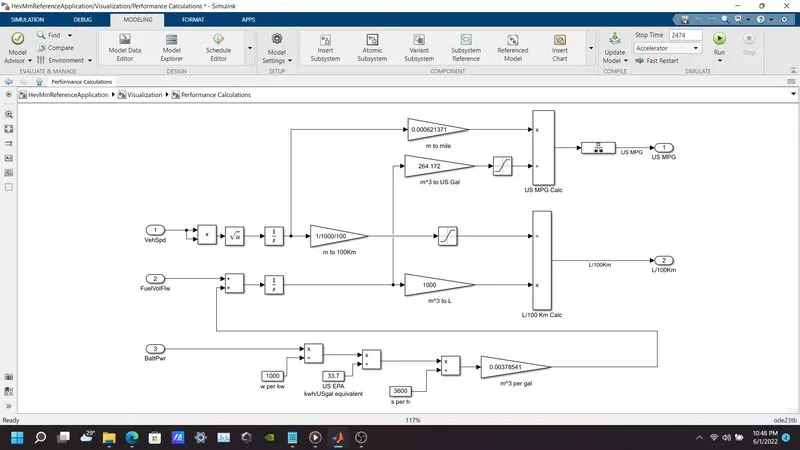
- Open rference application model in MATLAB and inside the visualisation block their is a block named performence calculatiion which is used for calculation of MPG.
- For better understanding the math behind the calculation open the block named performence calculation.
- 264.172 US Gallons = 1000L , 1mi/kWh = 33.705 MPGe hours of Energy in electric vehicles.
- Here vehicle speed (X) is multiplied itself and then square rooted. The value is then integrated (1/s) and converted into meters(m). Then the meters(m) is converted into miles in the block (m to mile) then it is divided by US Gal to get US MPG.
- For US Gallon we need to divide battery power divided by 1000 and then divide by 33.7. Now it is converted fron sec to hours by dividing with 3600 then it is converted to m^3 per gal.
- The value is finally converted into Gallon and used as MPG after dividing miles with gallon.
Ans2B:
Factors considered in model fuel flow:
- Vehicle speed
- fuel flow volume
- battery power
Ans3A:
As per question we created two conditions as follows,
| Condition No | Drive cycle | Grade | Wind Velocity |
| Condition 1 | WOT | 0 | 0 |
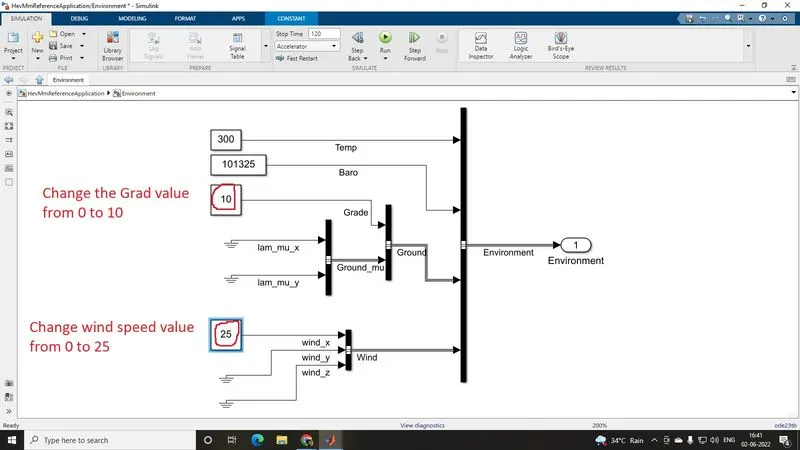
| Condition 2 | WOT | 10 | 25 |
Operation:
- step1: Open "Hybrid electric vehicle multimode reference application".
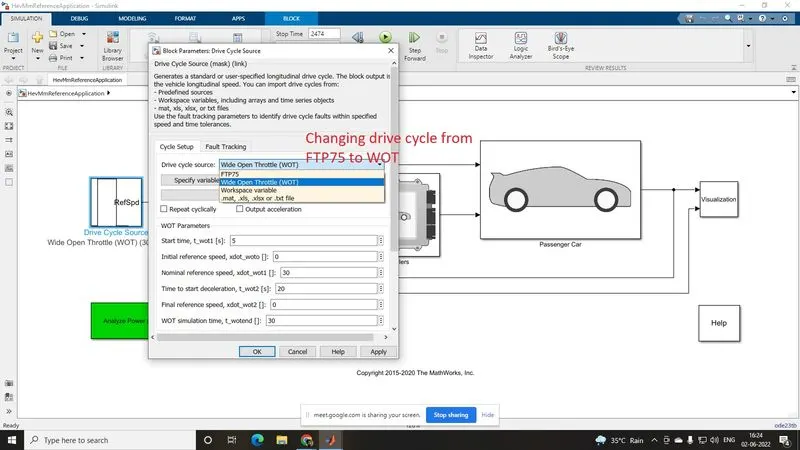
- step2: Now change drive cycle from FTP75 to WOT from drive cycle block.
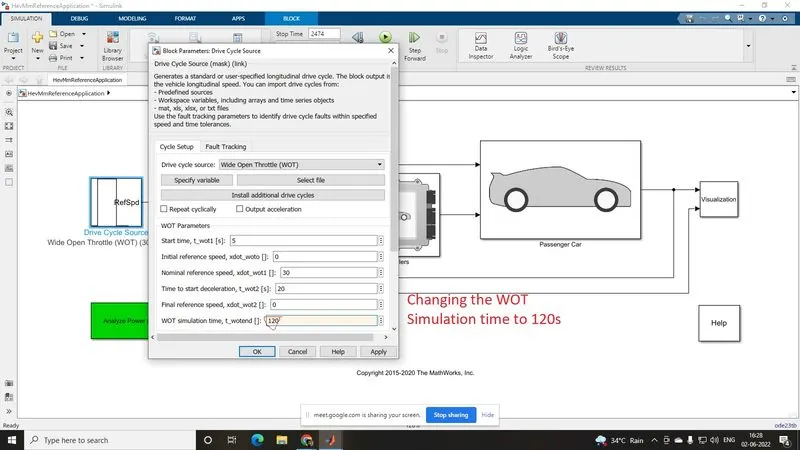
- step3: change simulation time to 120 sec.
- step4: Hit run simulation.
- step5: open the result from Performence and FE simulation scope.
- step6; Now change grade and wind velocity to 10 and 25 (assumed).
- step7: Open result and compare.
Result:
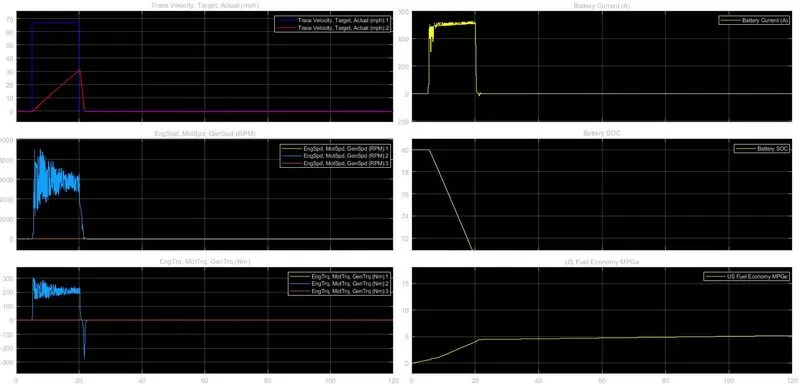
Condition1:
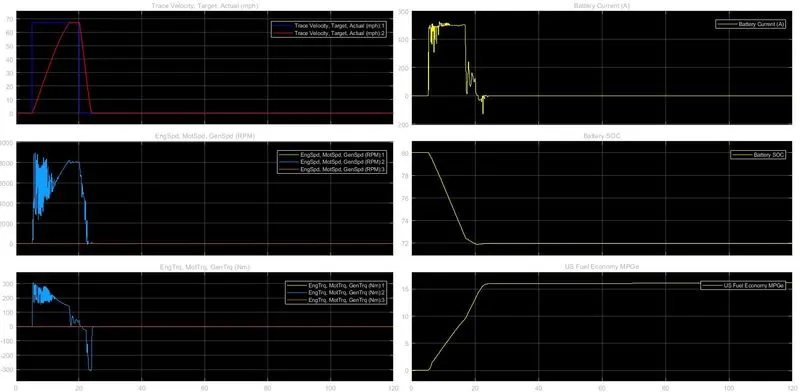
- The target velocity actual was able to achieve 67.1 mph. The battery current was increased upto 500 Amp and maintained for a
duration of 14.8sec. - Engine speed is able to achieve 8990 RPM and battery State of Change (SOC) was decrease form 80 to 72.
- Engine torque increases intially and goes to negative after 21st second and the peak torque achieve was around 305 Nm. The fuel
economy was increased from 0 to 16 and remains constant.
Condition2:
- The target velocity actual was only able to achieve 30.9 mph. The battery current was increased upto 500 Amp and maintained for
a duration of12.8 sec. - Engine speed was able to achieve 9120 RPM but for a small duration of time and battery State of Charge(SOC) was decrease from
80 to 70 - Engine tonque increases initially and goes to negative after 21st second and the peaktorque achieve was around 293 Nm. The fule
economy was increased from 0 to 5.7.
Comparison: The effects fall upon the vehicle's characteristics due to increased Grade and wind velocity are ,
- Achieved target velocity is decreased.
- SOC decreased which means battery getting discharged below SOC level.
- Fuel economy will decrease.
Ans4A:
Objective: Keeping all other parameters same, comparing the simulated results of hybrid and pure electric powertrains. The parameters are
- Driving cycle for WOT 120 sec simulation time.
- Grade value is 10.
- Wind velocity value is 25.
Operation:
- step1: Follow all steps mentioned in ANS3A.
- step2: Open EV reference model from Matlab help.
- step3: Change the above parameters mentioned above.
- step4: Open result.
- step5: Now we have the resuts of both HEV and EV reference model with same parameters , now we can compare the results.
HEV Result:
EV Result:
Comparison:
HEV reference
- The target velocity actual was only able to achieve 30.9 mph. The battery current was increased upto 500 Amp and maintained for
a duration of12.8 sec. - Engine speed was able to achieve 9120 RPM but for a small duration of time and battery State of Charge(SOC) was decrease from
80 to 70 - Engine tonque increases initially and goes to negative after 21st second and the peaktorque achieve was around 293 Nm. The fuel
economy was increased from 0 to 5.7
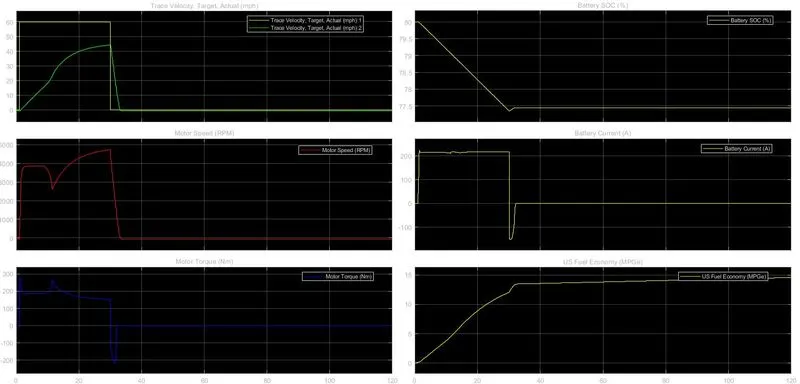
EV reference
- The target velocity actual was only able to achieve 44.2 mph. The battery current was increased upto 225 Amp and maintained for
a duration of 28.5 sec. - Engine speed was able to achieve 4734 RPM but for a small duration of time and battery State of Charge(SOC) was decrease from
80 to 77.3 - Motor tonque increases initially and goes to negative after 29th second and the peaktorque achieve was around 280 Nm. The fuel
economy was increased from 0 to 14.5.
Conclution:
- For 120 sec simulation time achieved velocity in EV is higher than HEV .
- Fuel economy is better in EV.
.