Week - 4
- Implement control logic of a “washing machine” using Stateflow as per given sequence:
- If the power supply is available, the system gets activated
- If the Water supply is not available, stop the process & indicate through LED
- Soaking time should be 200s followed by Washing time of 100s.
- Then rinsing happens for next 20s & dryer runs for 50s
The above given question we have a automatic washing machine whose running condition is as per the above question. Regarding this the state flow will be as follows.
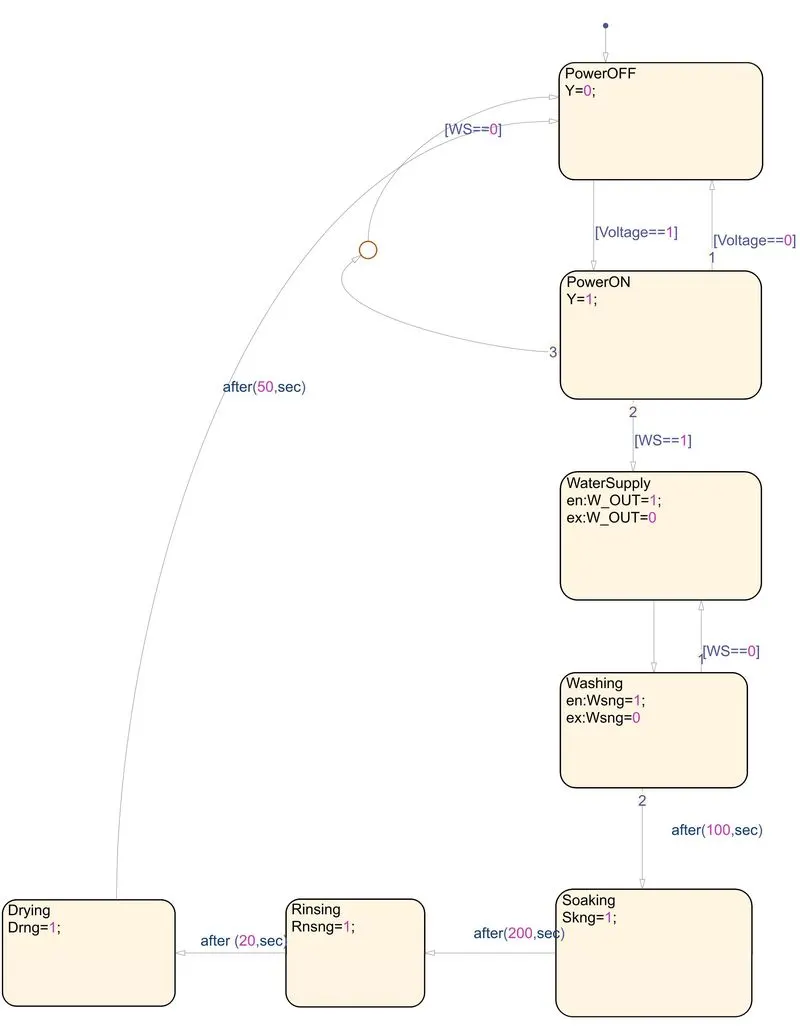
Here we draw this flow chart from the start point which consider as 0. Then when the power supply is on it goes to the next state which is power on. During the power supply on if the water supply is available then it will go the next state otherwise it will return back to the off mode. To monitor this we have create an output of water supply. When water supply is on then the washing will start. After 100 sec of washing the it will flow to the next state which is soaking and then after 200 sec of staying at soaking state it goes to rinsing state and after 20 sec of rinsing it goes to the drying state. Therefore after 50 sec of drying it goes back to power off state.
This is the actual practical scenario of automatic washing machine whose condition is as same as the question given above.
The base model of this state flow as below.
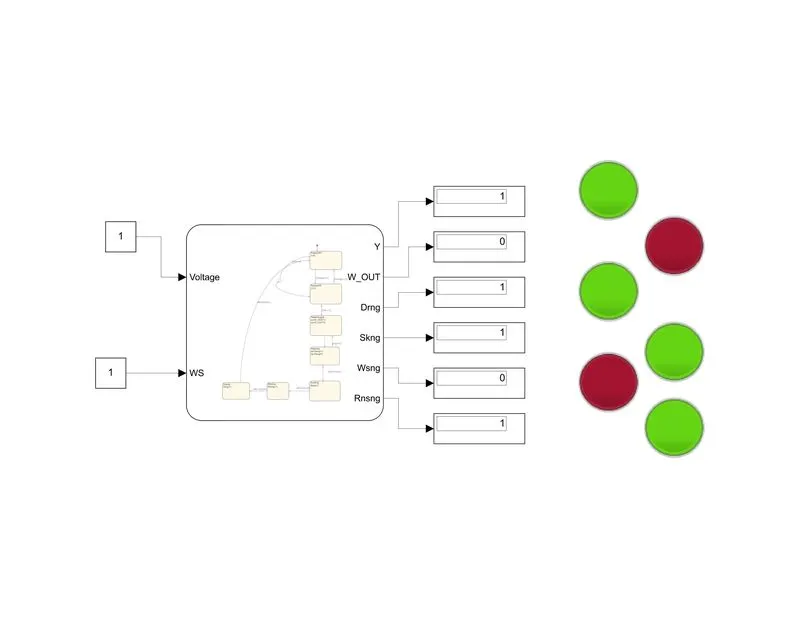
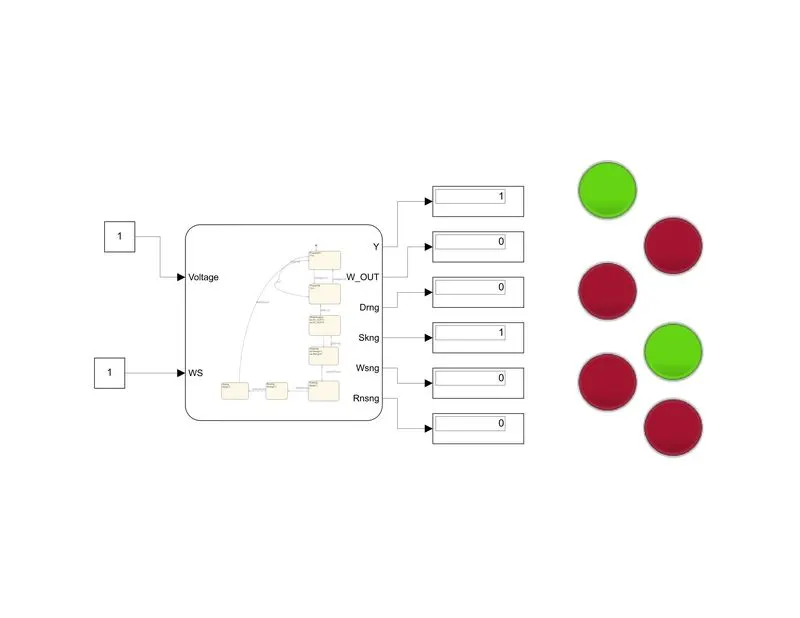
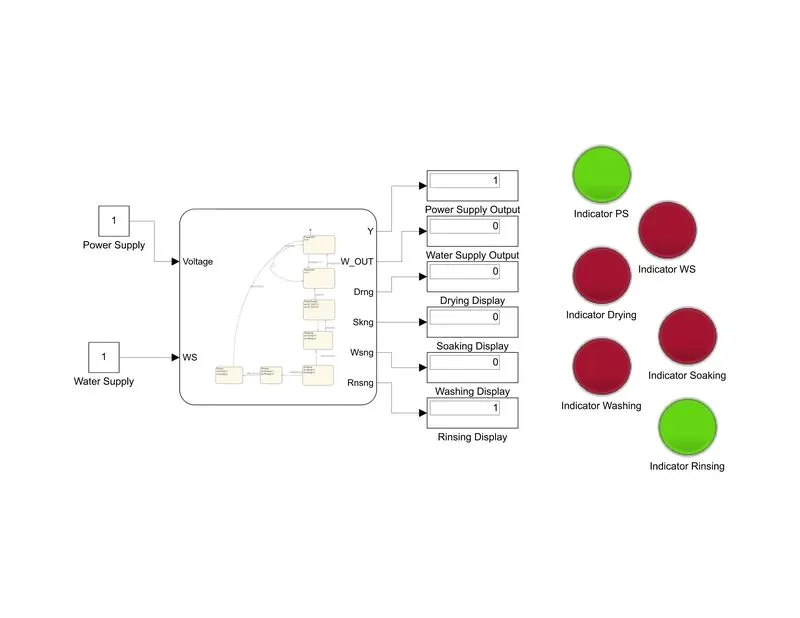
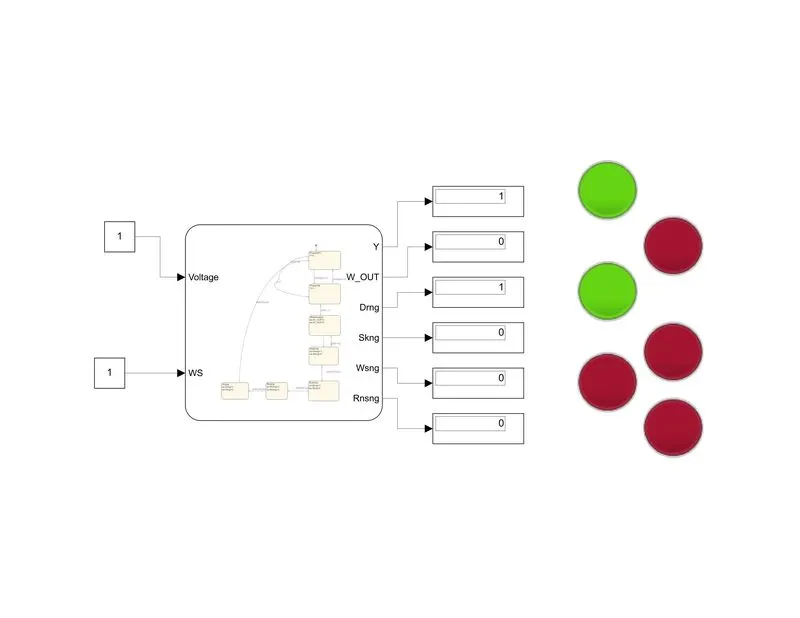
Here we have created 6 outputs on which we have connected some displays and two input port which one is for voltage and another is for the water supply.
We have use constant for on or off. So to denote this state we can use 1 and 0 as binary operation respectively and the further process happens and indicators are used for the indication of the state.
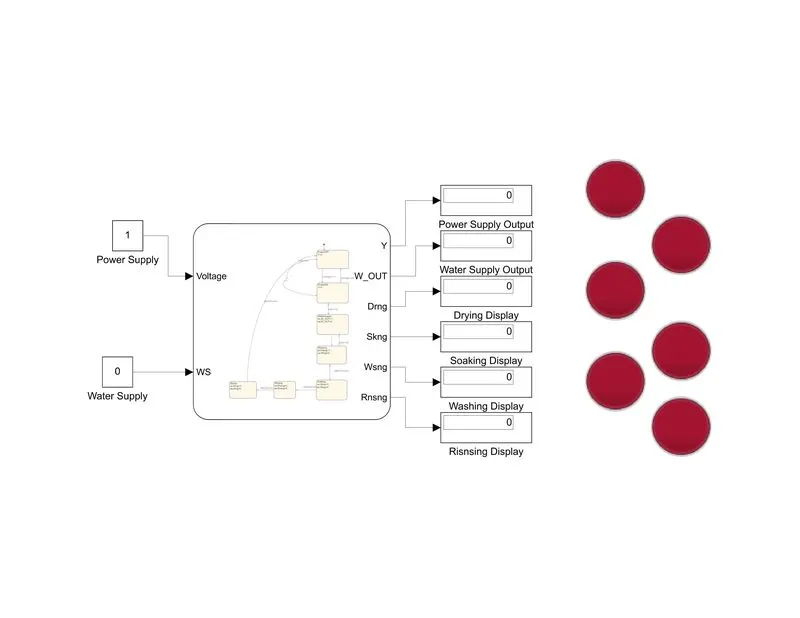
State flow and indication are as follows.
Operation with power supply ON and water supply OFF.
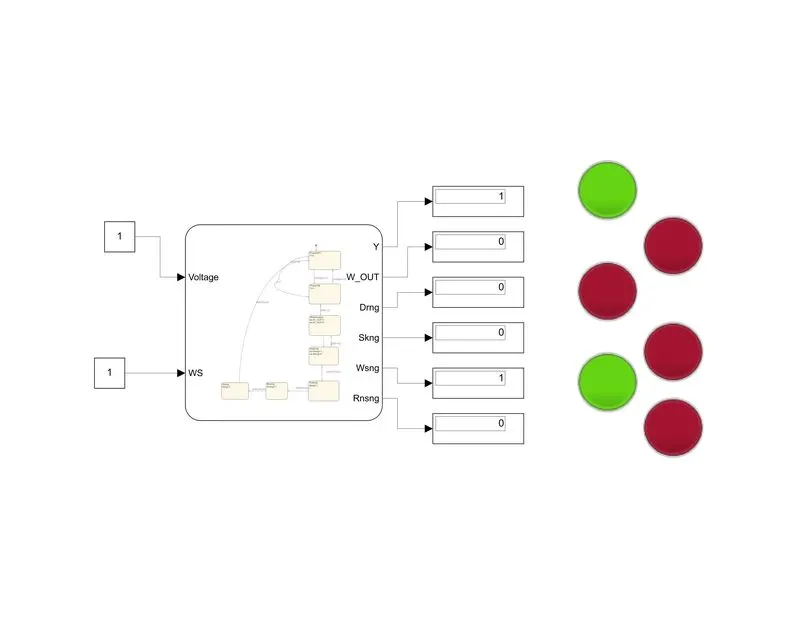
Washing operation with power supply and watersupply ON
Soaking operation with power supply and water supply ON
Rinsing opewration with power supply and water supply is ON
Drying operation with power and water supply ON
So these are the operations are being asked to the question.
2. Make a Simulink chart for the “Gear shift” logic as per below conditions:
Speed Range(kmph) Gear
0 to 15 1
16 to 25 2
26 to 40 3
41 to 60 4
Above 61 5
Give speed input while the simulation is running & display the gear number.
Ans: As per the above question the following chart may be prepared.
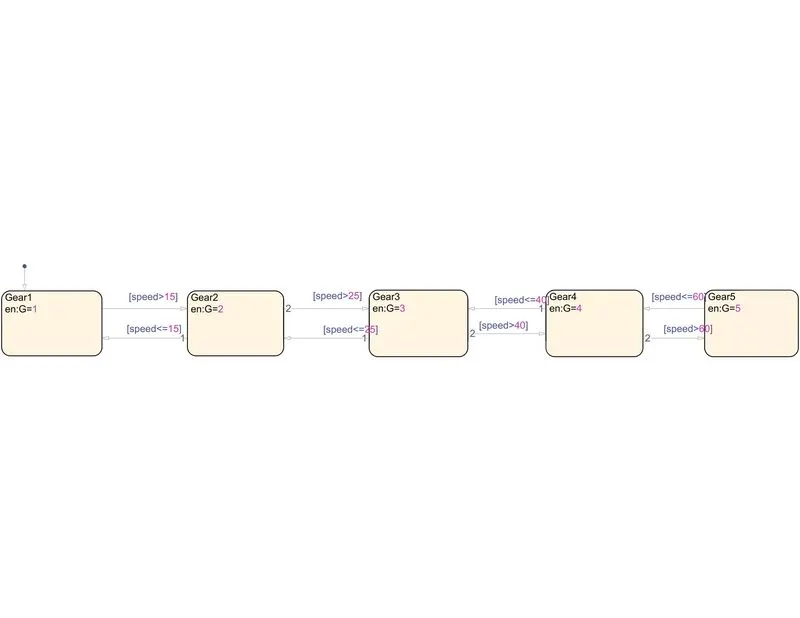
If we follow the above chart we will find that if the speed will increased then the gear level will also be shifted from ascending order and vice versa.
This chart will satisfy the above question.
The base model of this chart is as follows.
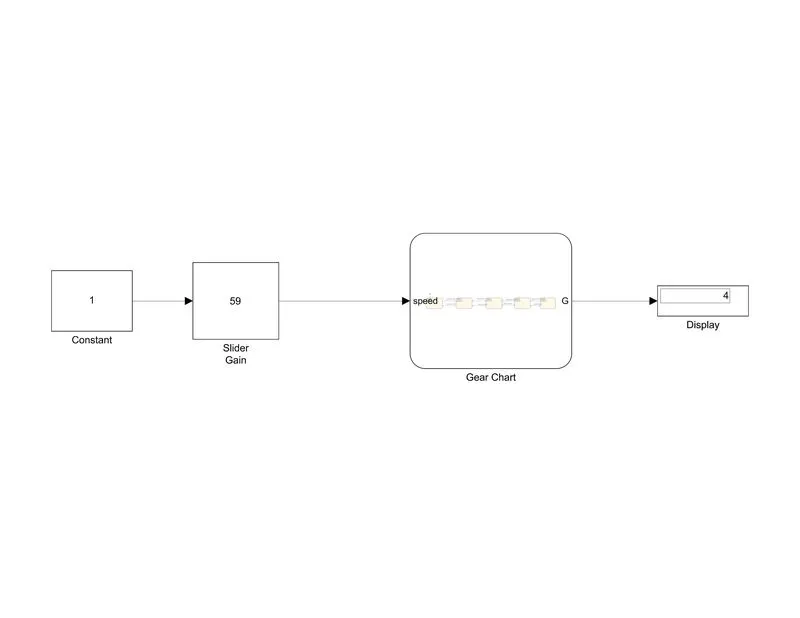
Here I am using a display for monitoring the gear level and in input I am using a slider gain which can act as a accelerator which increase the speed gradually and down the speed in same way. This is the most practical scenario of any car or bike.
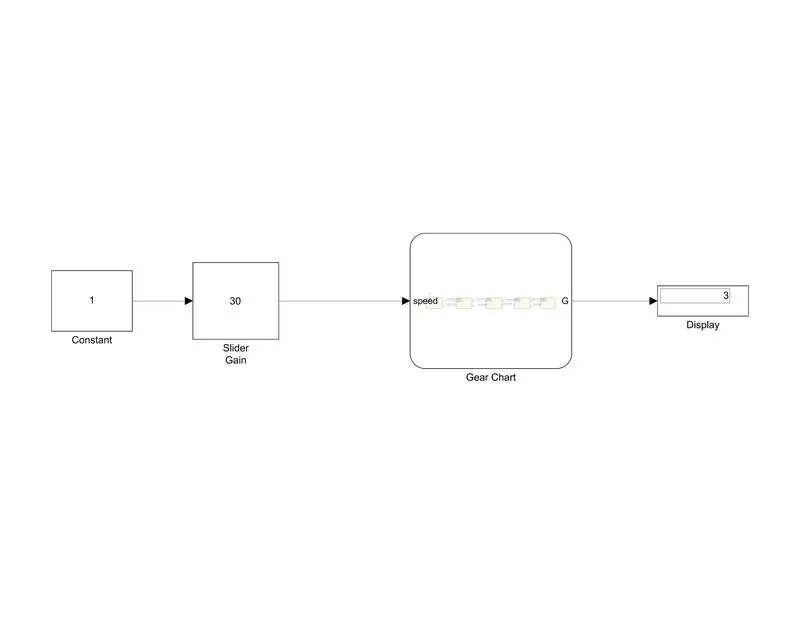
The gear position on the speed 30kmph is as follows.
The gear position on speed 73 kmph
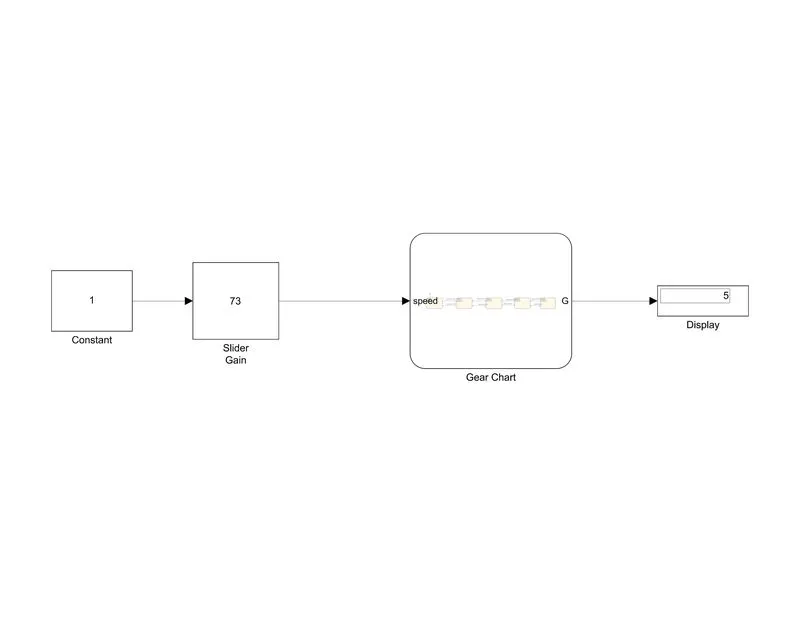
these are the two examples given by which we can see the gear position on the display. This is how the above mentioned condition is satisfied.