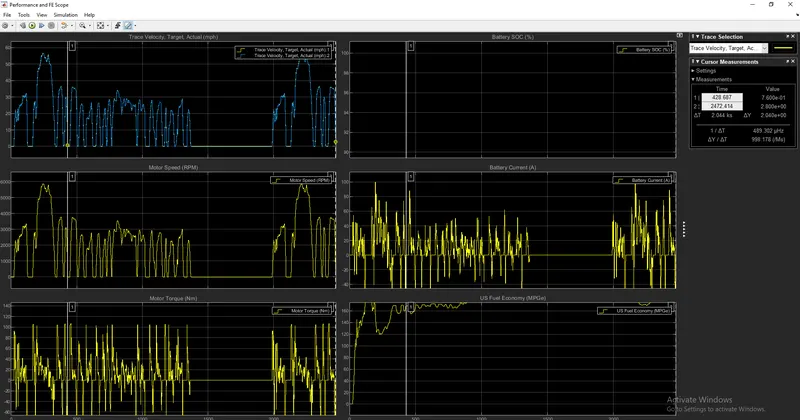
Week-4 Challenge WOT Condition Part-2
ANSWER:-
1.What is the difference between mapped and dynamic model of engine, motor and generator? How can you change model type..
Mapped and Dynamic subsystem of Electric Motor/GeneratoR:
Mapped:-
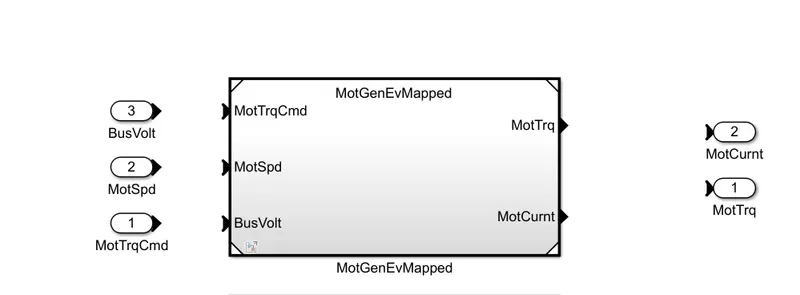
Mapped Model::-
- The mapped model is one type where the data points are pre_assigned in lookup tables.
- The engine or motor torque required is sensed and the motor or engine block generates the requiered torque output just as required simply without considering the real time motor or engine, parameters
- The output values are stored for the corrresponding given input values of the engine motor and generator.
- The accuracy of this type is not that high but the simulation will be done in much less time as it does not run by real time parameters.
dynamic model of engine:-
* The figure below shows the working phase of the dyanamic model.
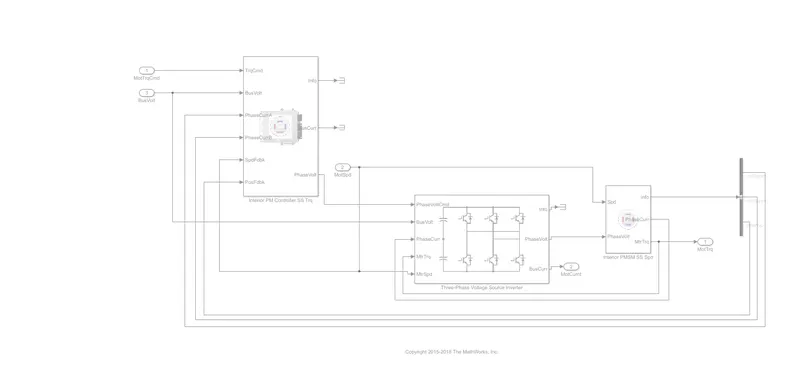
Dyanamic Model:
* The dyanamic model in other hand uses the combination of the outputs from various subsystems to generate the output.
* It runs by real time simulation where the required input from the drive cycle is taken and for that individiual real time simulation gets performed and summing all the results of the subsystem gives the output for the simulation.
* As per the drive cycle requirements the initial Bus voltage ,current is given along with the vehicle feedback so that it runs the actual simulation at that particuclar moment throught the drive cycle.
* The accuracy of this model is very high as it considers the real outputs from all the subsystem to generate the output.
* The simulation will take very long time to complete as it has so many individual simulations running by all the subsystem of the engine , motor/generator.
Miles per gallon
- Miles per Gallon is a fuel economy rating determined by how far a car can travel on a gallon of petrol or Diesel for a Engine powered car.
- In case of an electric vehicle it tells us the energy which is equivalent that of a engine powered carto propel the car through a distance.
- The amount of Fuel Energy required to move a engine powered car through a distance is determined and then it is compared to the eqivalent amount of electric energy required to move the car throgh the same distance and is expressed as the miles per gallon.
- The powertrain blockset has a model that calculates the miles per gallon for all kinds of vehicle.
2.How does the model calculate miles per gallon? Which factors are considered to model fuel flow:-
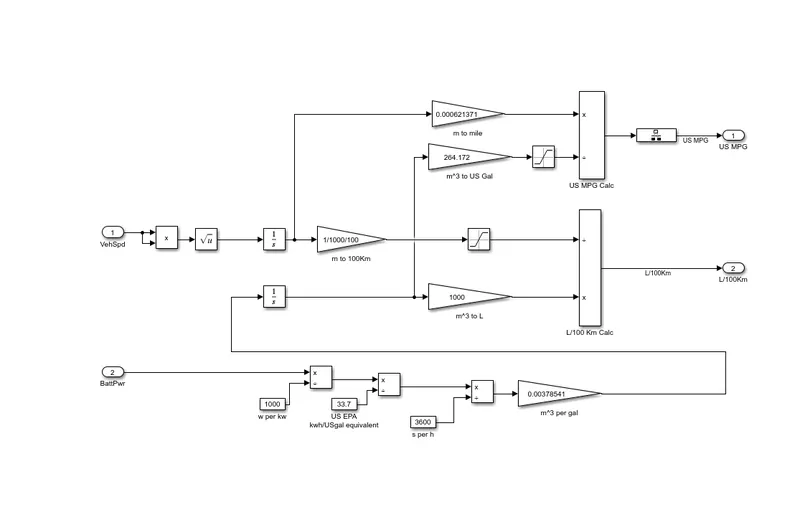
MODEL IN THE SUBSYSTEM OF VISUALISATION `rarr`performance calculation:-
Miles per gallon:-
- Miles per Gallon is a fuel economy rating determined by how far a car can travel on a gallon of petrol or Diesel for a Engine powered car.
- In case of an electric vehicle it tells us the energy which is equivalent that of a engine powered carto propel the car through a distance.
- The amount of Fuel Energy required to move a engine powered car through a distance is determined and then it is compared to the eqivalent amount of electric energy required to move the car throgh the same distance and is expressed as the miles per gallon.
- The powertrain blockset has a model that calculates the miles per gallon for all kinds of vehicle.
Vehicle Speed And Fuel Flow:-\
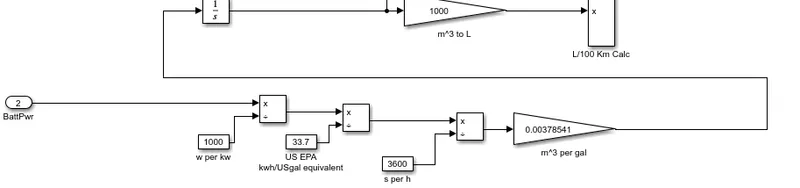
- The Vehicle speed is a important factor while considering the fuel consumption at that particular time,so to determine the fuel consumption throughout the drive cycle.
- To convert speed to Distance we can Integrate with time and we are doing the same of converting the velocity to get distance covered by integrating.
- Then the Fuel flow is expressed as the mass flow rate (i.e) the amount of fuel at each moment in Kg/Sec. Now integrating this will result in the mass of the fuel and by using this 1 we convert it to the volume and by multiply by 1000 to get it in Litres.
- By comparing the two results we can get the amount of litre consumed to Run for 100km.
3.Run the HEV ReferenceApplication with WOT drive cycle. Change the grade and wind velocity in the environment block. Comment on the results
HEV - WOT Drive Cycle (Data Input)
The cycle was carried out for 60 seconds.
Performance Scope - WOT Cycle
ACTUAL MODEL:-
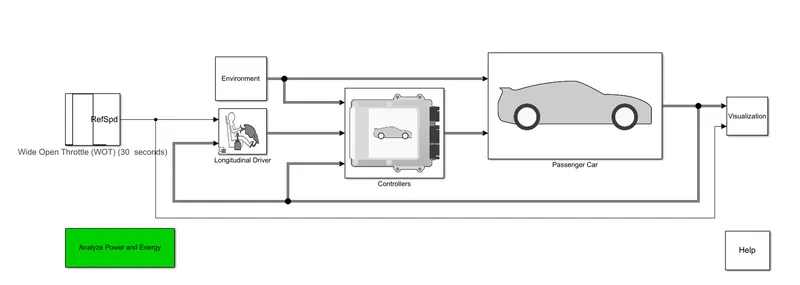
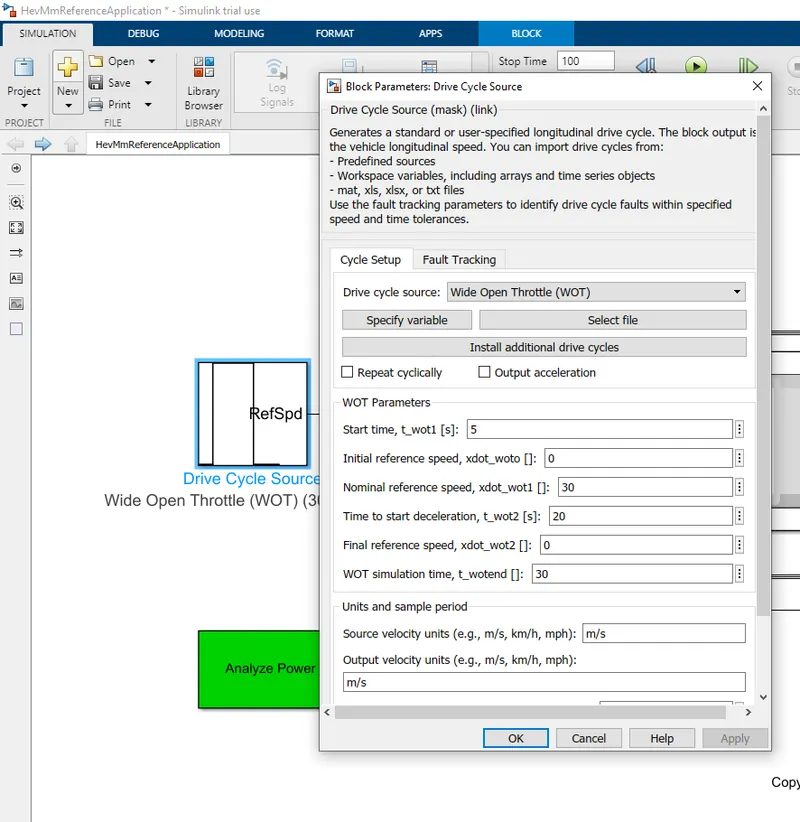
we create the Drive cycle source-wide open throttle(wot)
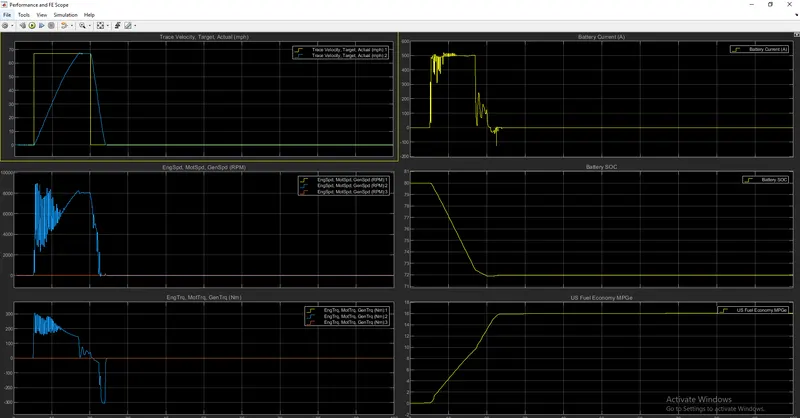
Performance Scope - WOT Cycle:-
Observations:-
- Plot 1 (Trace Velocity Target vs Actual) - Through this plot it is denoted that the desired Velocity has not been met by the actual vehicle velocity. The desiered velocity was ranging at near about 140 mph but he actual velocity achieved was near to 110 mph.
- Plot 2 (Engine Speed, Motor Speed) rpm - This plot gives the detailed analysis for the achieved Engine and Motor speed in rpm. The contribution of both the Power Generating sources for meeting the required Velocity.
- Plot 3 (Engine Torque, Motor Torque and Generator Torque) Nm - This plot gives the detailed analysis of the Engine, Motor Torque and Generator Torque.
- Plot 4 (Battery Current) A - This plot denotes the power produced by the Battery and the readings are in Ampere.
- Plot 5 (Battery SOC) - This plot denotes the State Of Charge of the battery, this denotes the range of charge used for the achievement of velocity.
- Plot 6 (US Fuel Economy) MPGe - This is the Fuel Efficiency or the Range of the drive and the same is denoted in Miles Per Gallon equivalent.
WOT Cycle with changes in Grade and Wind Velocity
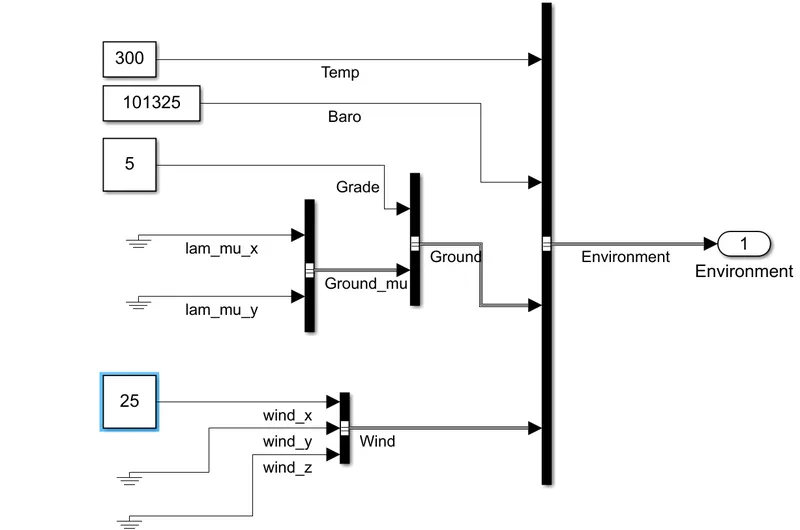
The variables input for the change in these aspects are as given below,
Comments/Comparison of the results obtained.
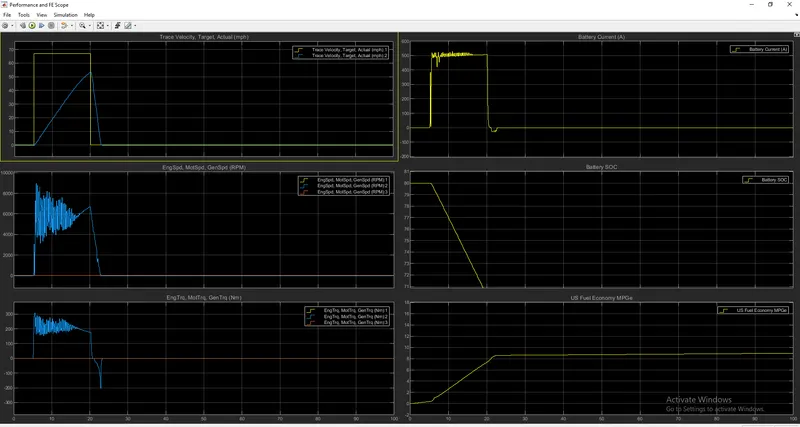
- Plot 1 (Trace Velocity Target vs Actual) - This is clearly visible that as the grade and the wind velocity is increased compared to the normal state the vehicle is not able to reach the target velocity.
- Plot 2 (Engine Speed, Motor Speed) rpm - In this plot comparing with the normal plot the Engine Speed has reduced to a steep slope on the negative side as compared to the normal situation the grade is increasing the load on the engine and thus the targeted Engine Speed is not met.
- Plot 3 (Engine Torque, Motor Torque, Generator Torque) Nm - There are multiple variations in all these aspects and the same is visible in both the results of Normal and with the Grade and Wind Velocity.
- Plot 4 (Battery Current) A - Battery current has been fluctuating at a higher range as compared to the normal after the vehicle is reaching near to the steady/stable pace the fluctuation starts and is simulated.
- Plot 5 (Battery SOC) - The Battery State of Charge remains more or less similar in both the cases and are resulted at 65% after the end of the WOT Cycle.
- Plot 6 (US Fuel Economy) MPGe - The average fuel economy differ in the range of 6 and 9 mph in both the scenarios.
Question - 4
Keeping all other parameters same, compare the simulated results of hybrid and pure electric powertrains.
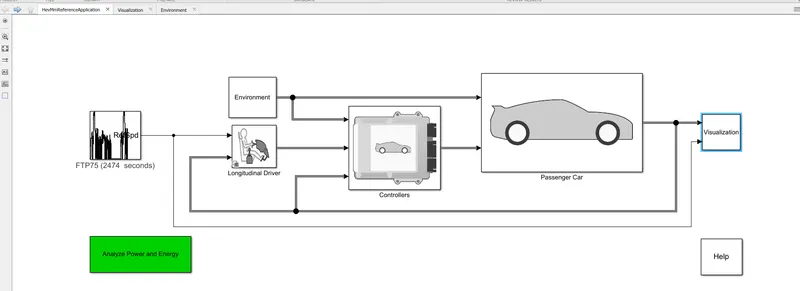
Below mentioned vehicle is simulated for the HEV Reference:-
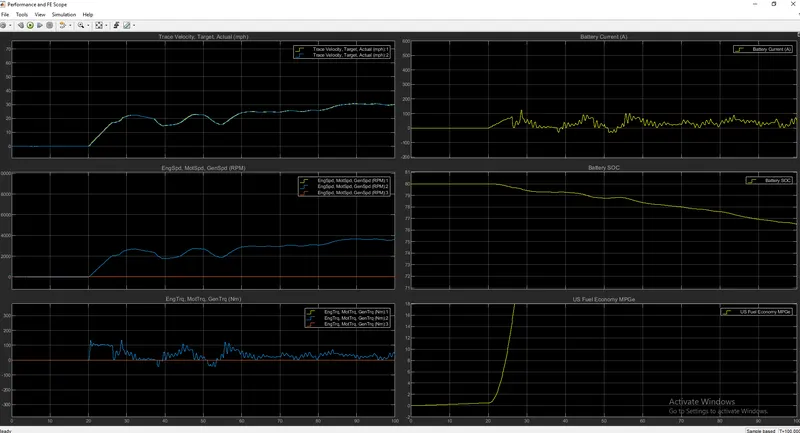
The Performance and FE Results obtained are appended as below,
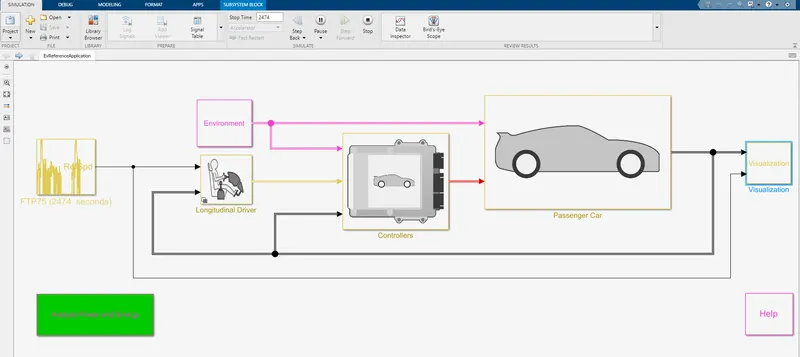
Below mentioned vehicle is simulated for the EV Reference:-
The Performance and FE Results obtained are appended as below,