Week-4 Challenge WOT Condition Part-2
- What is the difference between mapped and dynamic model of engine, motor and generator? How can you change model type?
Powertarin blockset has two types of subsystems
1.Mapped subsystem of engine,motor & generator:
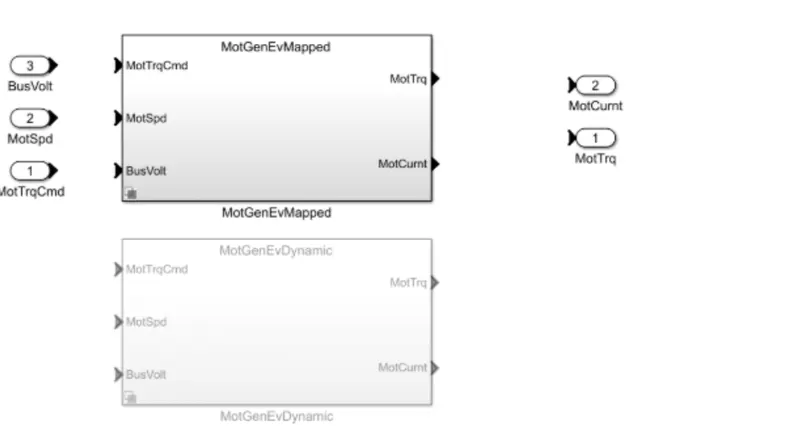
a) Mapped subsystem are suitable for analysis and design.It does not required engine subsyetem dynamic characteristics.
b) Mapped Models represnts macro engine behaviour as a set of lookup tables(fule flow, air flow,brake torque,exoust temp,efficiency & emissions)as a function of commanded load and measured engine speed.
c) This type of model has low accuracy.but it can be developed and analysed in short period of time.
2. Dynamic subsystem of engine,motor &generator:

a)The dynamic model in other hand uses the combination of the outputs from various subsystems to generate the output.
b)As per the drive cycle requirements the initial Bas voltage current is given along with the vehicle feedback so that it runs the actual
simulation at that particuclar moment through the drive cycle.
c)The accuracy of thiss model is very high as it considers the real outputs from all the subsystem to generate the output.
d)The simulation will take very long time to complete.
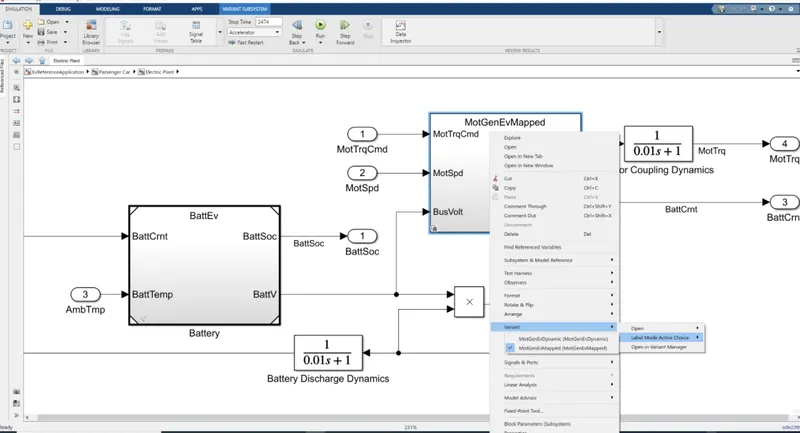
To select those two modules/ subsystems we will follow the following step sequence :
1.Open the EV model in Simulink
2.Enter to the passanger car block
3.Check for Electric plant block
4. Inside the motor block we can select either mapped or dynamic subsystem.
2.How does the model calculate miles per gallon? Which factors are considered to model fuel flow?
The vehicle fuel efficiency is calculated as miles per gallon(mpg)&Miles per gallan equivalent.
1. for the gasoline vehicles it is calculated as miles per gallon(mpg).
2.For hybride & EV's it is calculated as miles per gallon equivalnt (ege).
Miles per gallon equivalent (pge).mpg is the number of millies your cor can drive per gallon of gasfiguring out on mpge rating is a little more complicated since engines that can use an alternative source of fuel cant be measured by liquid gallons of fuelthe mpge rating is calculated by figuring out the number of milles a vehicle can go using the same energy content as gallon of gas the epa calculated that 33.7 kilowatt hours of electriccity is equivalent to one gallon of gas
We should go inside ev reference block that is performance calculations
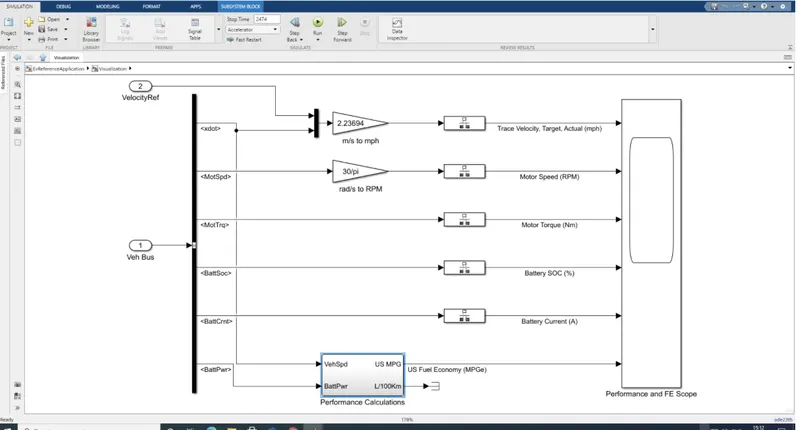
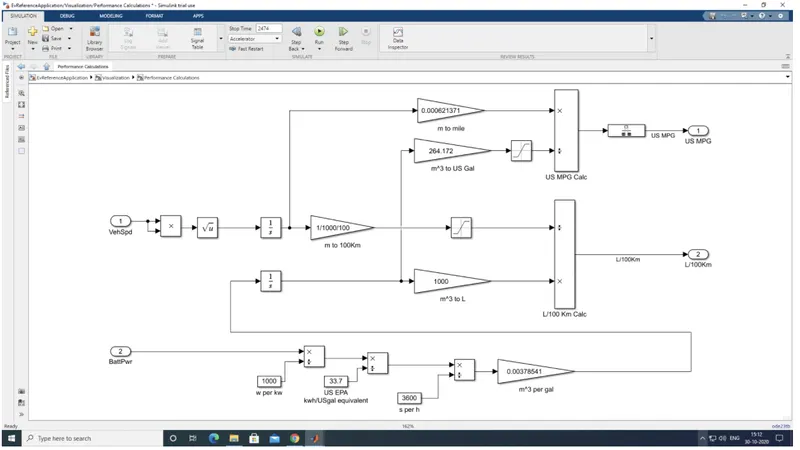
Here, three different inputs are taken into considerationis:
1 vehicle speed
2.fuel flow
3 battery power
The vehicle speed inputs is in m/s which is converted into miles by multiplying with 0.000821371
1.similarly the kilogram of fuel is converted into cubic meter by multiplying byt/(1000+0.739) this cubic meter value is then converted into gallons by multiplying it with 264 172 the mile value and gallon value is used to find mpg of the vehicle
2.now the battery value is initially converted from watts to kwh by dividing with 1000 and then to gallon equivalent by again dividing it with 33.7(sincw 337 kwh-1 gallon) then divide the value by 3600 to get in per seconds and multiply by 0.0037654into get the value in cubic meter per
gallons
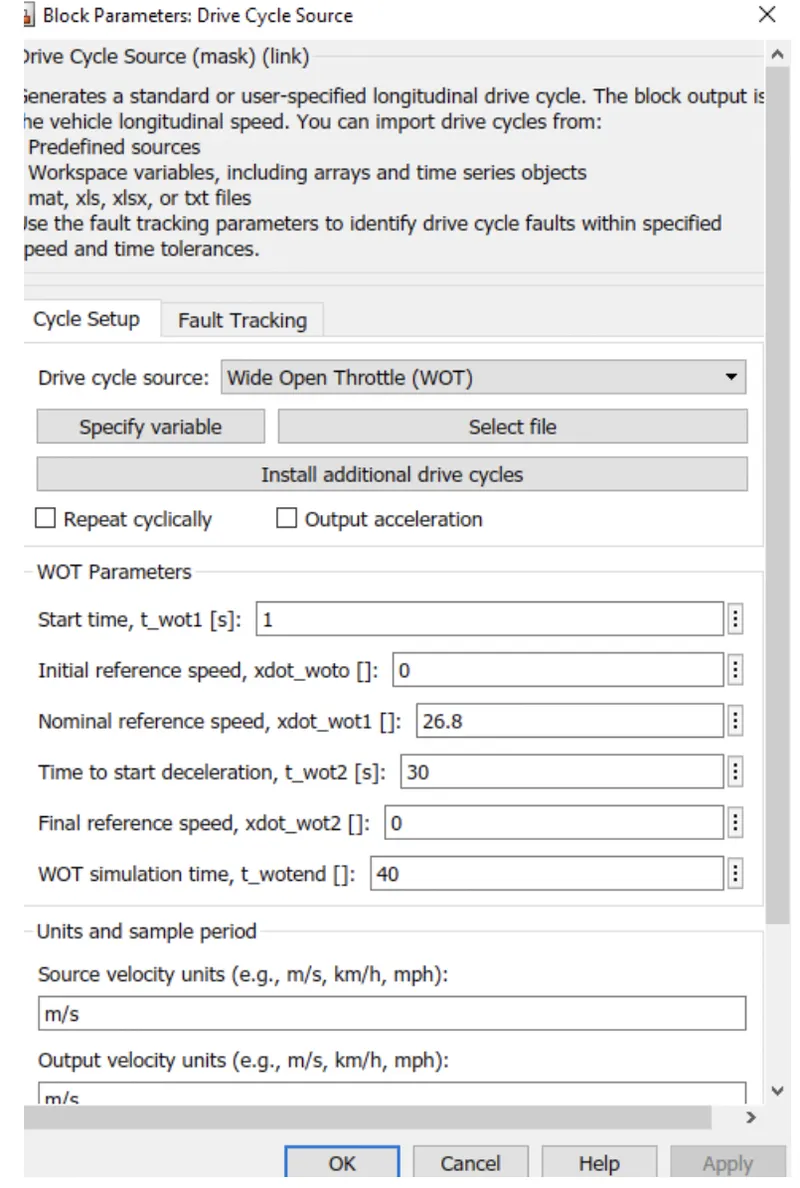
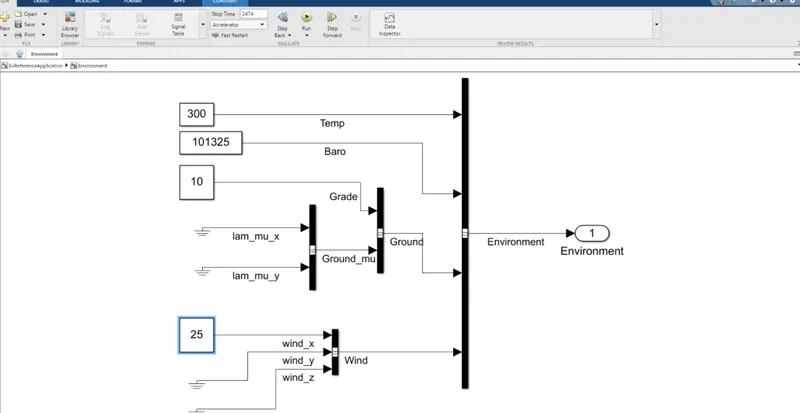
3.Run the HEV ReferenceApplication with WOT drive cycle Change the grade and wind velocity in the environment block. Comment on the results.
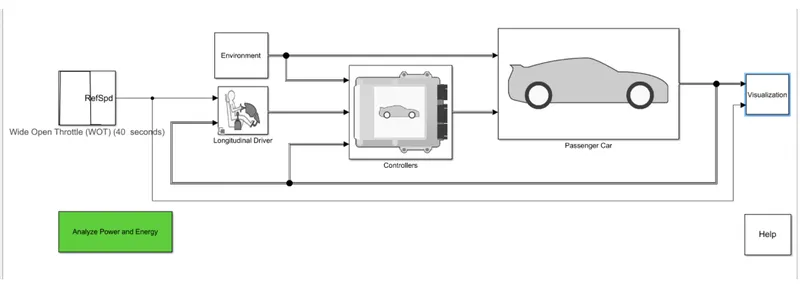
1.In the powertrain blockset we have selected the bybrid electric vehicle and this is the simulink model
2.Here we can select the input parameters as we wish and we can Run the simulation to check the results.
Results:
Conclusion :
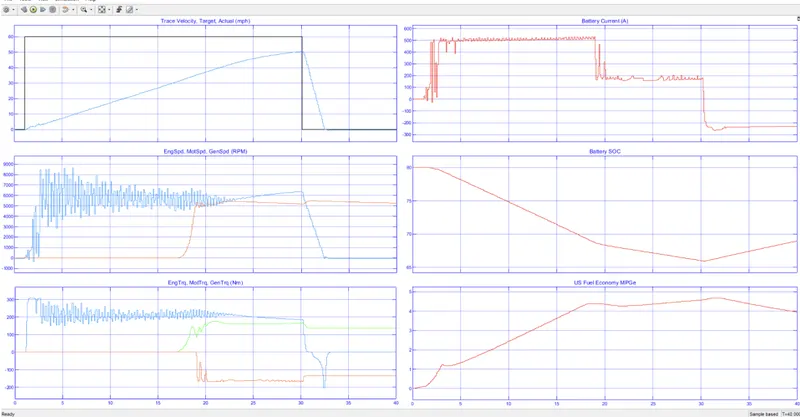
plot 1
trace velocity,target.actual top velocity achieved -50.1 mph.
plot 2
motor&engine rpm
time taken to accelerate=29.034 sec. time token to deaccelerate=2.471 sec. top motor rpm-5712 rpm.
plot 3
motors engine torque maximum motor torque 306.6 N-m. maximum engine torque = 174.7 N-m
top engine rpm 5451 rpm)
plot 4
battery current
the battery supply current is at its maximum value of 167 ampere when full throttle is applied by the user drastically to the value of negative 150 during deaccelaration of the vehicle.
plot 5
battery soc
the battery soc will falls from 80 to 65 % during accelaration of vehicle and it increases slightly to 65 to 70 accelaration due to regenerative braking.
plot 6
fuel economy.
maximum fuel economy achieved 4.675.
4 keeping all the parameters same.compare the simulated results of pure and hybird electric powertrains.
Ans
simulated results of HEV
Simulated result of EV s follows :
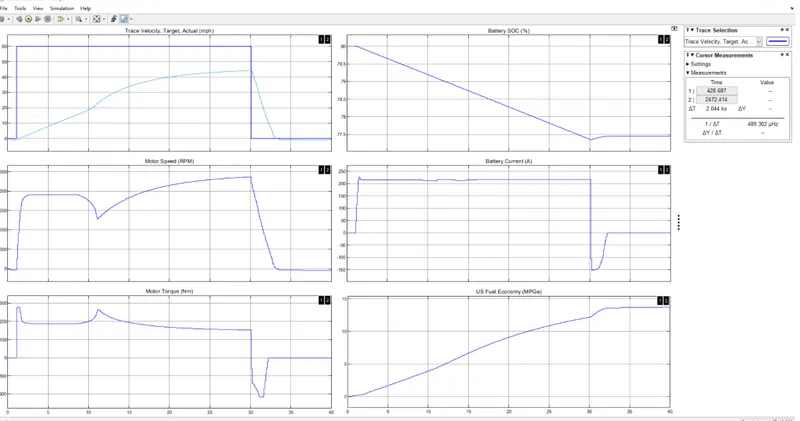
Conclusion:
1.The top speed achived by HEV is higher than the pure EV.
2. the fule economy of HEV is poor than the pure EV.
3.The battery current Capacity of HEV is lesser than the pure EV.
4. The HEV is producing some emision gases. But in case of pure EV there is no such emission case.
5. The HEV motor producing less torque and spped alone compared to pure EV.
6. The travel range of HEV is much higher than the pure EV.