Week-4 Challenge WOT Condition Part-2
AIM:
- To find the difference between the mapped and dynamic model of engine, motor, and generator? How can you change the model type?
- To study How does the model calculates miles per gallon? Which factors are considered to model fuel flow?
- To Run the HEV Reference Application with WOT drive cycle. Change the grade and wind velocity in the environment block. Comment on the results.
- To compare the simulated results of hybrid and pure electric powertrains. Keeping all other parameters the same
Solution:
- difference between the mapped and dynamic model of engine, motor, and generator
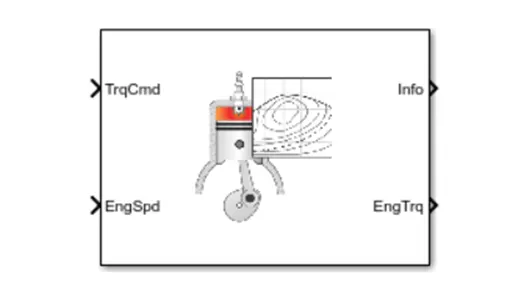
mapped engine: The Mapped SI Engine block implements a mapped spark-ignition (SI) engine model using power, air mass flow, fuel flow, exhaust temperature, efficiency, and emission performance lookup tables.
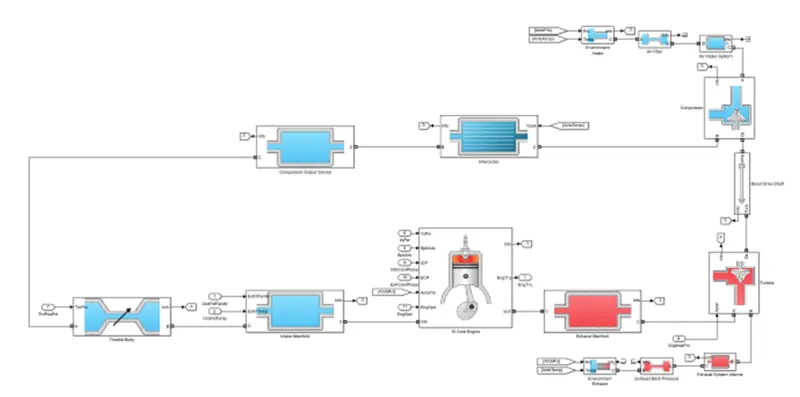
Dynamic engine: The model decomposes the engine behavior into engine characteristics that are separated into lower-level components. By combining components in this way, the models capture the dynamic effects
- If you need a more detailed dynamic model and have component-level data.
- To analyze the impact of individual engine components on the overall performance.
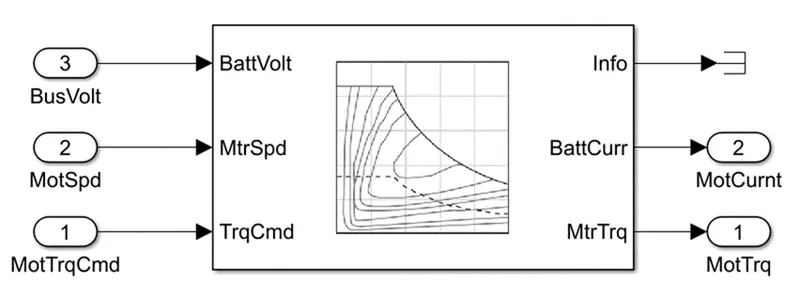
Mapped Model Motor: The behavior of the macro motor can be represented as a set of lookup tables of efficiency, torque curve, rpm, power curve, Temp. etc.
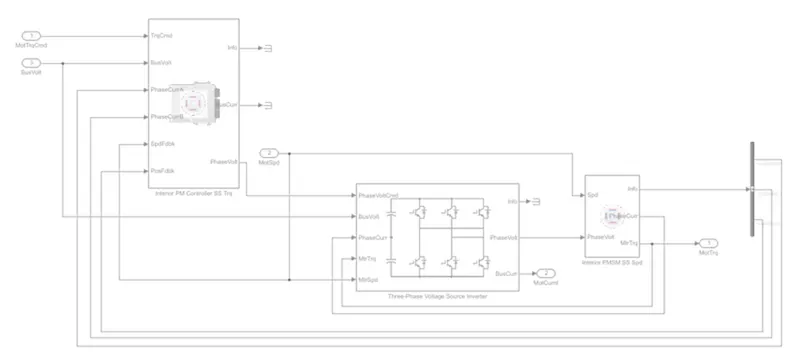
Dynamic Model Motor: Dynamic Model of a motor performs a real-time simulation of components that takes place in an original system to generate an output and also the dynamic model of a motor decomposes motor behavior into individual component models.
Mapped Model Generator: The behavior of the Macro generator can be represented as a set of lookup tables of generator efficiency, motor torque, etc.
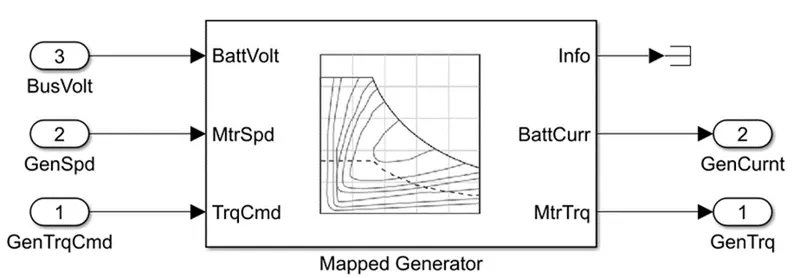
Dynamic Model Generator: Dynamic Model of a generator performs a real-time simulation of components that takes place in an original system to generate an output and also the dynamic model of a generator decomposes generator behavior into individual component models.
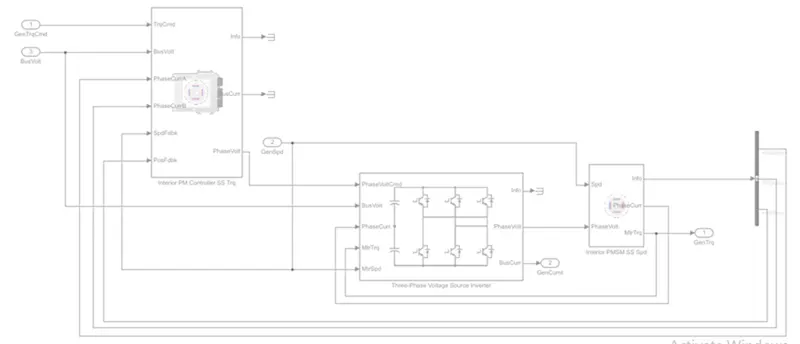
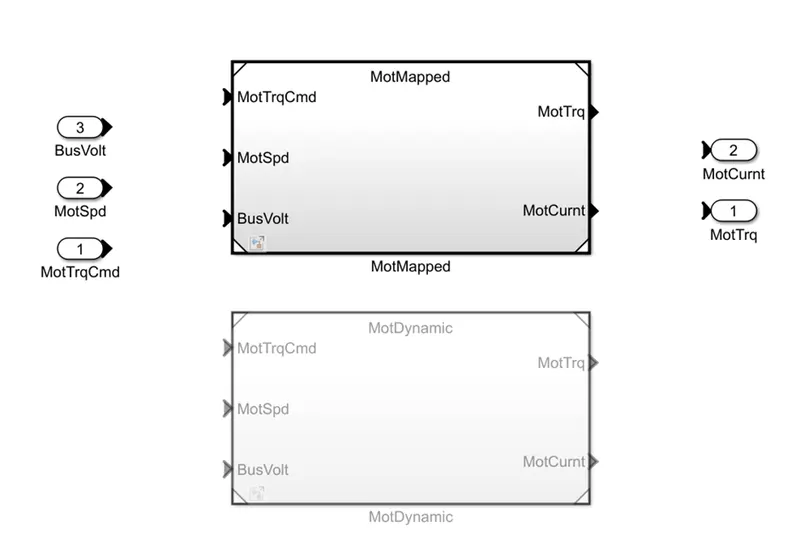
Now we can change the model type:
- We can change the model type from mapped to dynamic and from dynamic to mapped based on the application
- We have to open the powertrain block and set the module in Matlab documentation for the required vehicle.
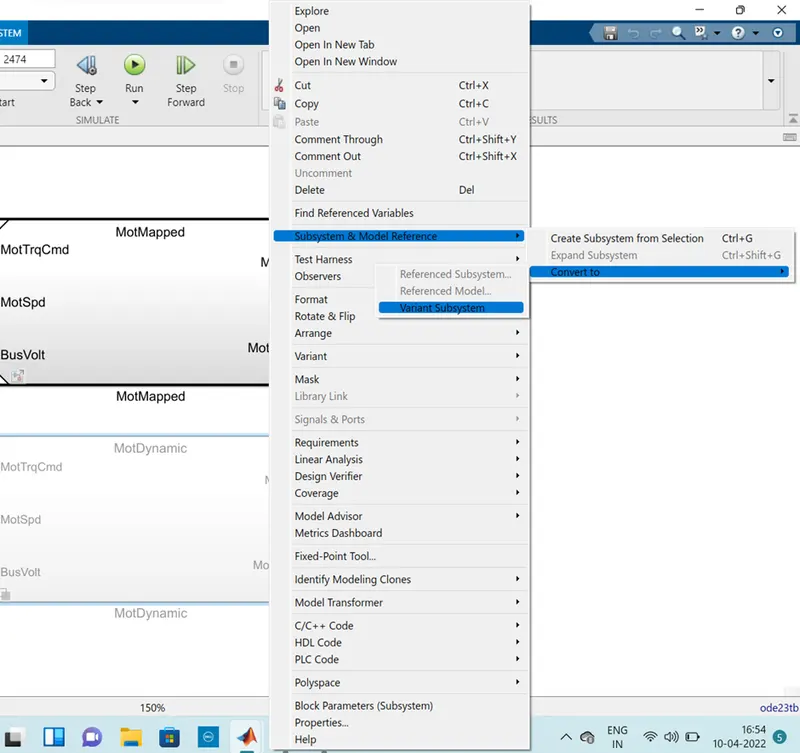
- Next, we have to right-click on the motor on the vehicle model and have to select subsystem& model reference.
- In subsystem & model reference we have to select the option convert to the variant subsystem.
The above process is given below,
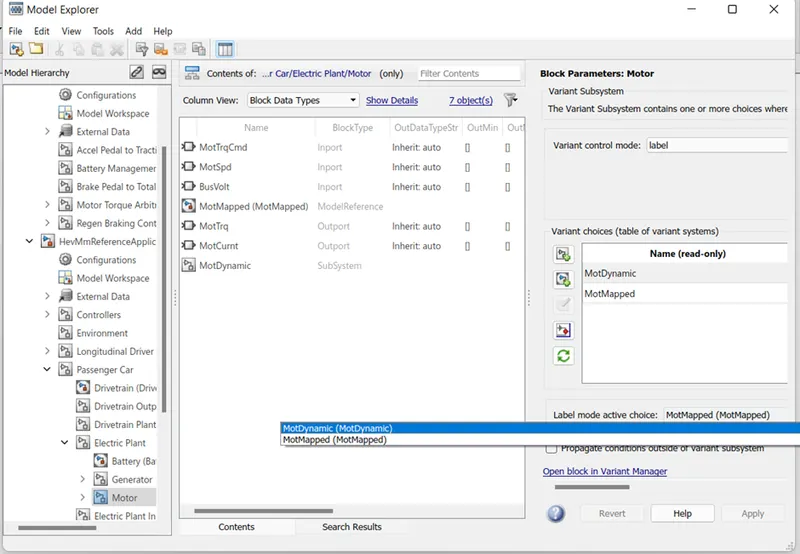
Then by using model explorer we can change the model type. The following process is shown below,
- To study How does the model calculates miles per gallon? Which factors are considered to model fuel flow?
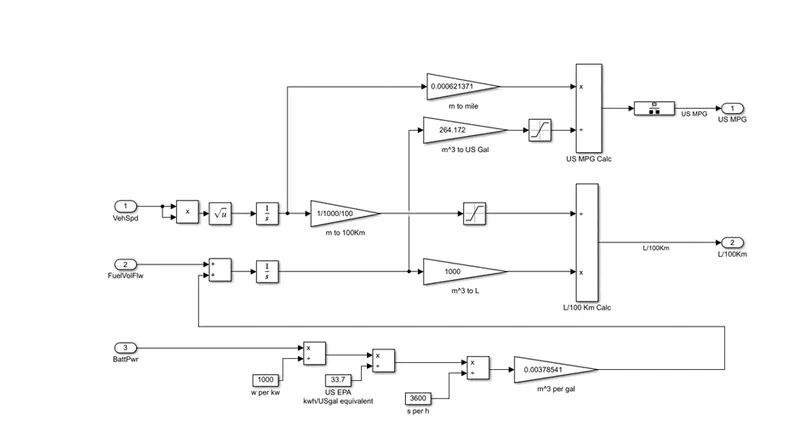
The reference model taken here for consideration is HEV and as it operated on both the battery and the fuel injection engine.
- The final output or fuel efficiency is calculated by keeping into consideration the battery and the vehicle speed/ kilometers driven. The fuel efficiency is calculated and it is converted after the saturation thus the fuel efficiency is calculated.
- As we know 264.17 US gallons is 1000L
- Conversion from cubic meter to gallon(m^3 to gallon)
Factors considered modeling fuel flow,
- Vehicle speed
- Battery power
- Fuel flow
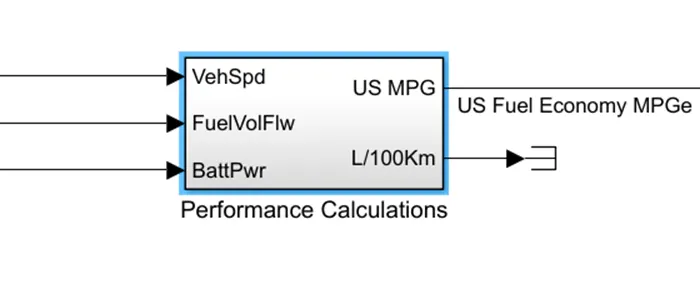
- To Run the HEV Reference Application with WOT drive cycle. Change the grade and wind velocity in the environment block. Comment on the results
HEV power train block:
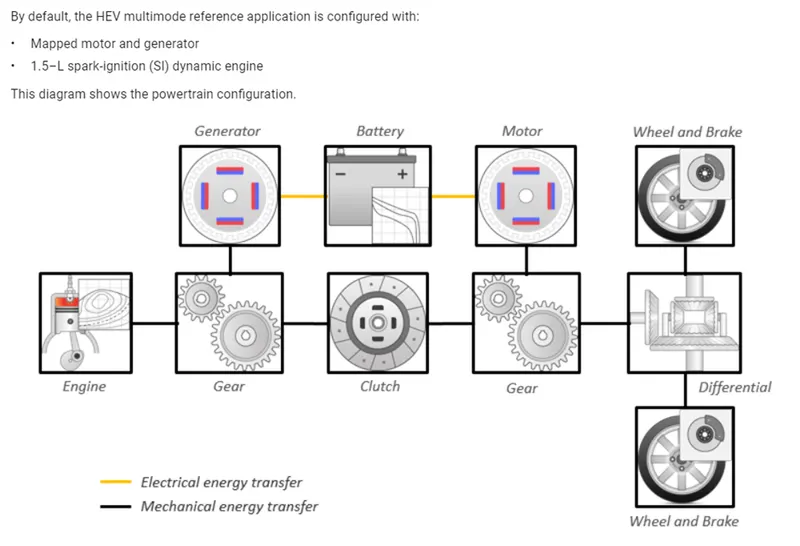
Simulink:
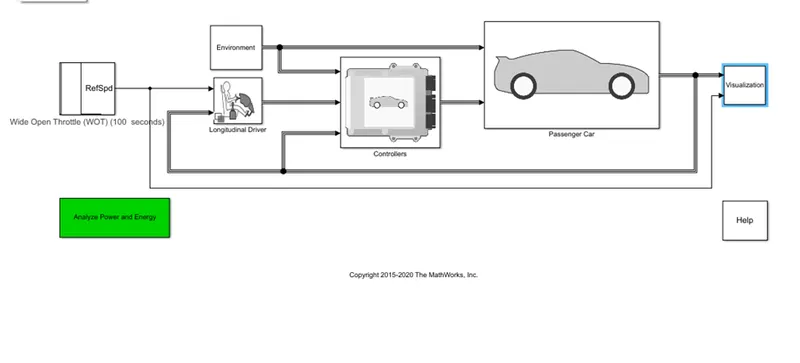
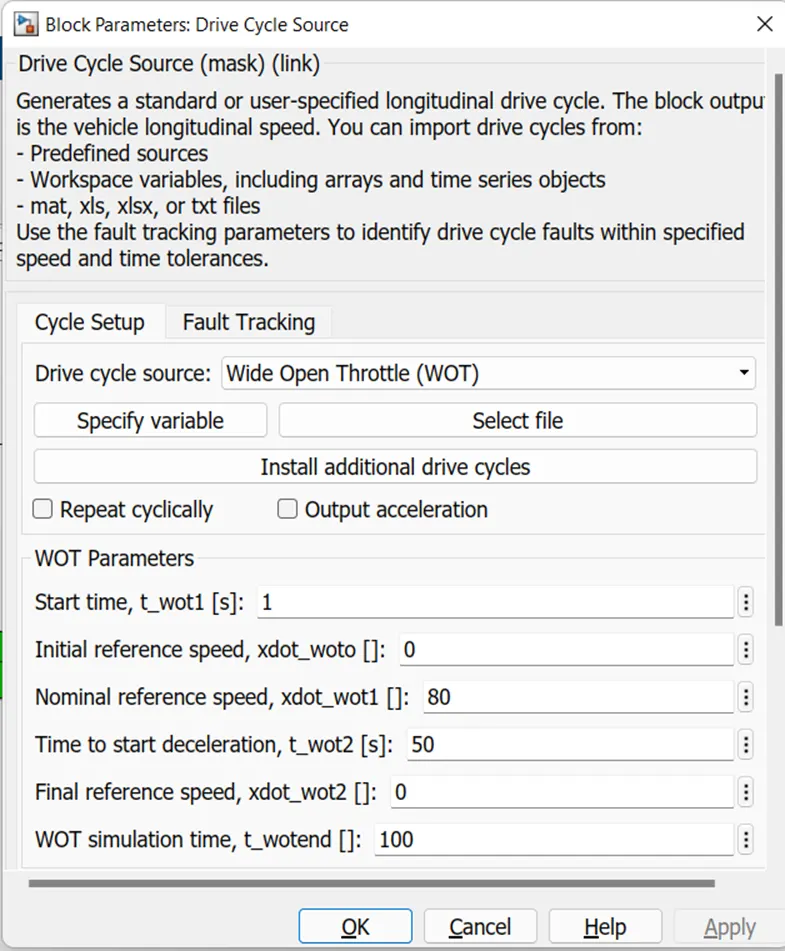
The input data is WOT drive cycle,
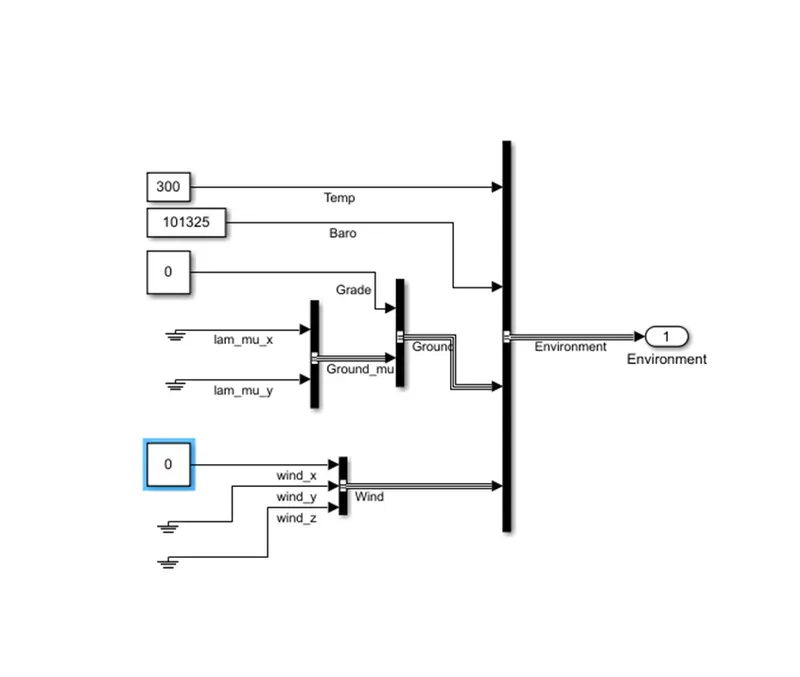
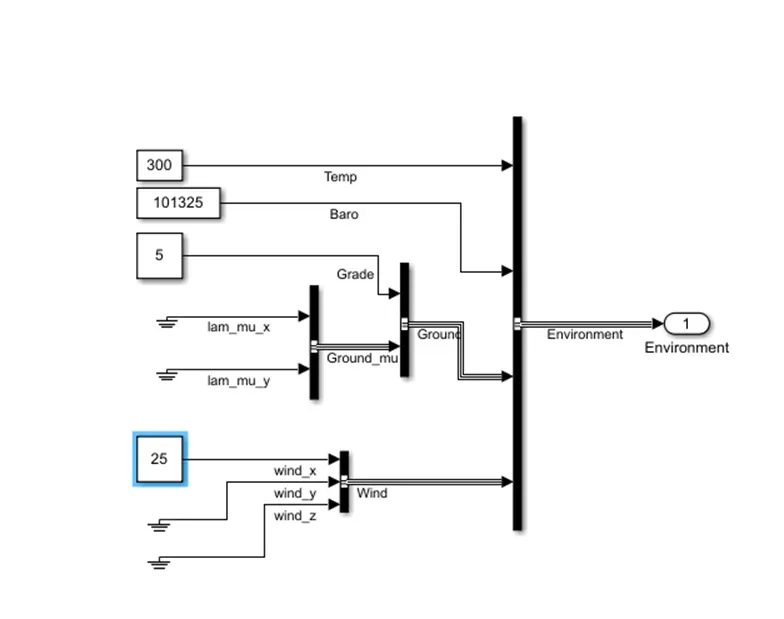
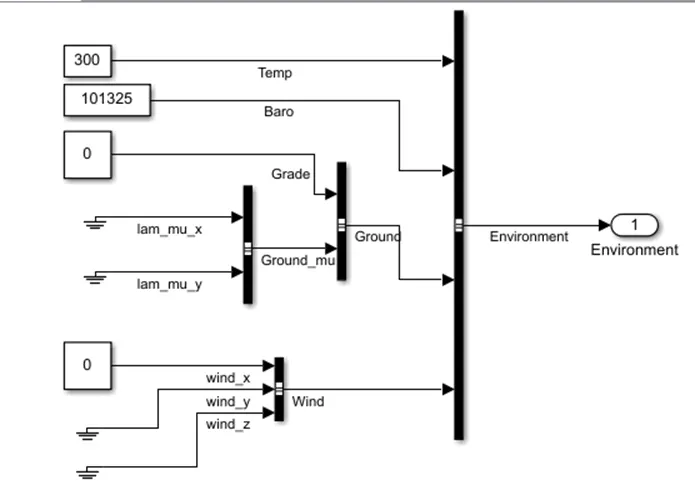
Initially, grade value and wind speed are zero
Result:
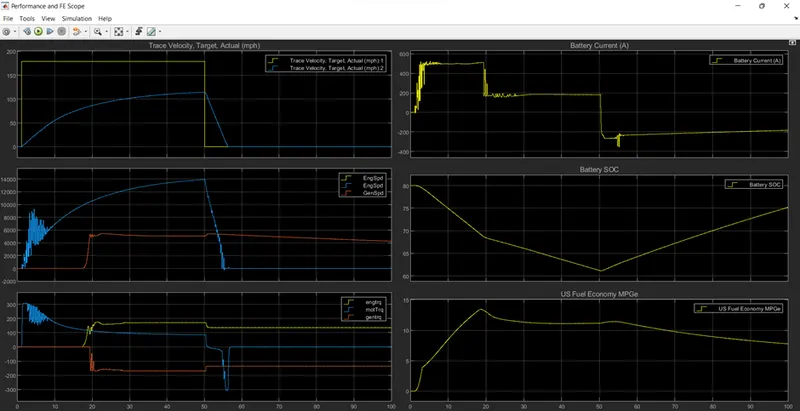
plot 1: trace velocity target vs actual
It shows the velocity of the vehicles for the drive cycle data with the scale on the x-axis
- The top speed achieved is 115mph
- The acceleration time to reach 115mph is 50
- The deceleration time from 115mph to a minimum is 6.45 sec
Plot 2: Engine Speed, Motor Speed, Generator Speed(RPM)
It shows the changes in the speed of the engine, motor, and Generator in RPM throughout the drive cycle.
- Peak Engine Speed is 5420 rpm.
- Peak Motor Speed is 13480rpm.
- Peak Generator Speed is 5538 rpm.
Plot 3: Engine Torque, Motor Torque, Generator Torque(Nm)
It shows the Torque characteristics and the changes of the engine, motor, and generator in (Nm) throughout the drive cycle.
- Peak Engine Torque is 173.34 Nm.
- Peak Motor Torque is 306.64 Nm.
Plot 4: Battery Current (A)
It shows the Battery Current values(A) and their changes for various acceleration inputs as per the driven cycle.
- The Peak Current Discharge from Battery is 511.83 A
- The Peak Current Charging to the Battery is -183.36 A
Plot 5: Battery SOC
It shows the Battery State of Charge SOC(%) and its changes corresponding to the driving inputs.
- The State of Charge decreased from 80% to 61.28% of charge in 50.2seconds for the specified driving conditions.
Plot 6: US Fuel Economy MPGe
It shows the Fuel Economy as Miles per Gallon for the corresponding input driving conditions.
- The highest Miles per Gallon MPGe is 13.4
Now we apply the grade value and wind speed
The performance scope- WOT cycle
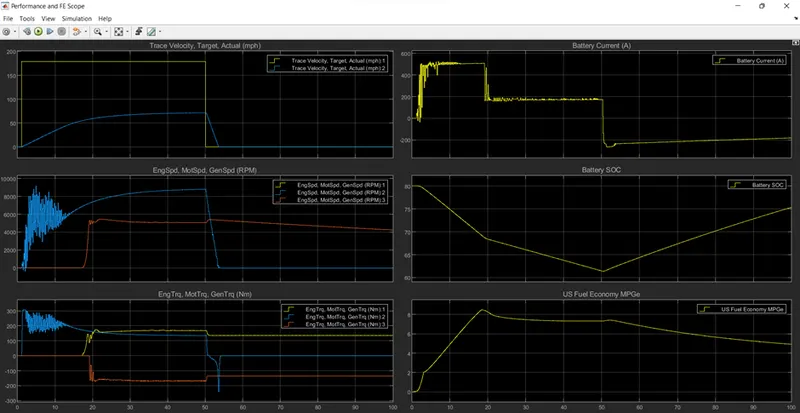
plot 1:trace velocity target vs actual
It shows the velocity of the vehicles for the drive cycle data with the scale on the x-axis
- The top speed achieved is 72.7mph
- The acceleration time to reach 72.7mph is 48.98
- The deceleration time from 72.7mph to a minimum is 3.3 sec
Plot 2: Engine Speed, Motor Speed, Generator Speed(RPM)
It shows the changes in the speed of the engine, motor, and Generator in RPM throughout the drive cycle.
- Peak Engine Speed is 5538 rpm.
- Peak Motor Speed is 8855 rpm.
- Peak Generator Speed is 5538 rpm.
Plot 3: Engine Torque, Motor Torque, Generator Torque(Nm)
It shows the Torque characteristics and the changes of an engine, motor, and generator in (Nm) throughout the drive cycle.
- Peak Engine Torque is 177.34 Nm.
- Peak Motor Torque is 306.64 Nm.
Plot 4: Battery Current (A)
It shows the Battery Current values(A) and their changes for various acceleration inputs as per the driven cycle.
- The Peak Current Discharge from Battery is 521.83 A
- The Peak Current Charging to the Battery is -255.36 A
Plot 5: Battery SOC
It shows the Battery State of Charge SOC(%) and its changes corresponding to the driving inputs.
- The State of Charge decreased from 80% to 61.28% of charge in 51.085 seconds for the specified driving conditions.
Plot 6: US Fuel Economy MPGe
It shows the Fuel Economy as Miles per Gallon for the corresponding input driving conditions.
- The highest Miles per Gallon MPGe is 8.48.
- To compare the simulated results of hybrid and pure electric powertrains. Keeping all other parameters the same
EV powertrain:
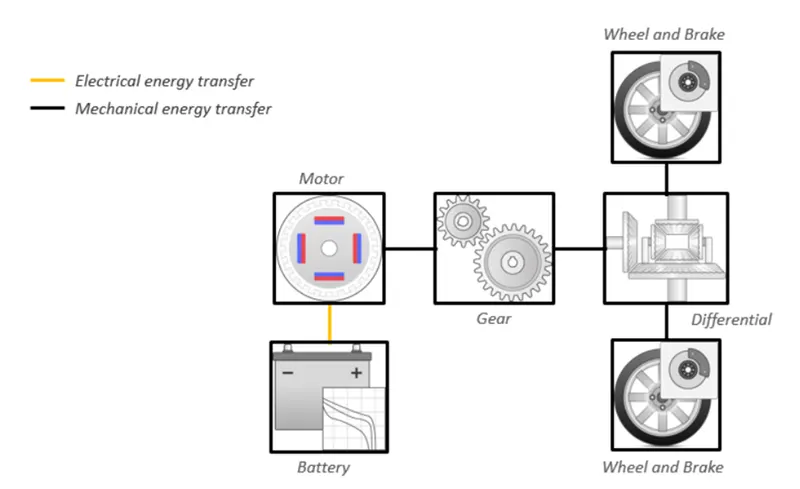
Simulink:
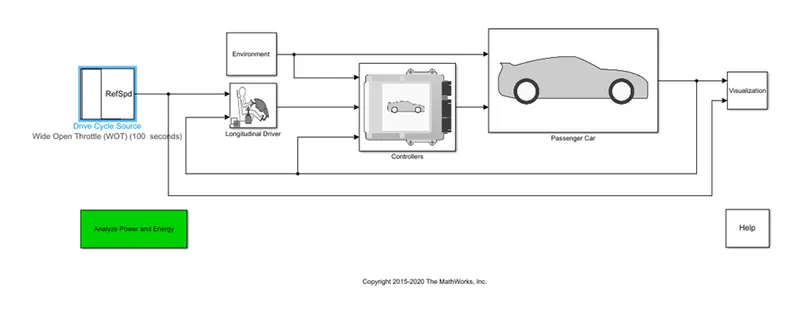
Initially, the grade value and wind speed is zero
Result:
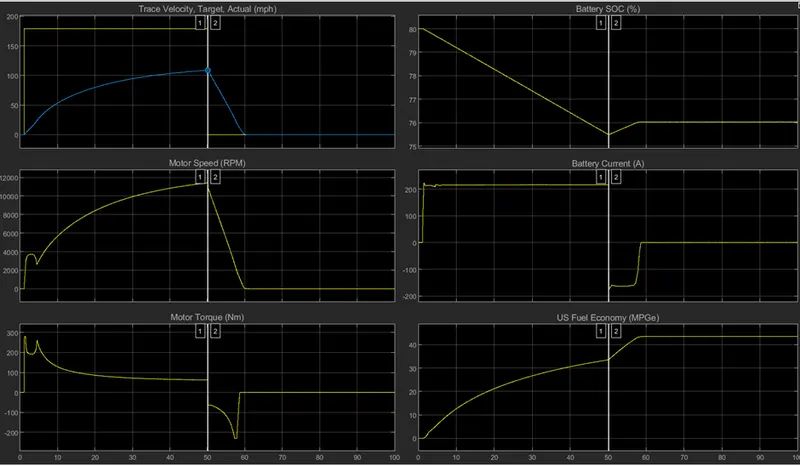
plot 1:trace velocity target vs actual
It shows the velocity of the vehicles for the drive cycle data with the scale on the x-axis
- The top speed achieved is 108.8mph
- The acceleration time to reach 108.8mph is 50.13sec
- The deceleration time from 108.8mph to minimum is 9.9 sec
Plot 2: Engine Speed, Motor Speed, Generator Speed(RPM)
It shows the changes in the speed of the engine, motor, and Generator in RPM throughout the drive cycle.
- Peak Motor Speed is 11400 rpm.
Plot 3: Engine Torque, Motor Torque, Generator Torque(Nm)
It shows the Torque characteristics and the changes of the engine, motor, and generator in (Nm) throughout the drive cycle.
- Peak Motor Torque is 279Nm.
Plot 4: Battery Current (A)
It shows the Battery Current values(A) and their changes for various acceleration inputs as per the driven cycle.
- The Peak Current Discharge from Battery is 221 A
- The Peak Current Charging to the Battery is -173 A
Plot 5: Battery SOC
It shows the Battery State of Charge SOC(%) and its changes corresponding to the driving inputs.
- The State of Charge decreased from 80% to 76% of charge in 49.085 seconds for the specified driving conditions.
Plot 6: US Fuel Economy MPGe
It shows the Fuel Economy as Miles per Gallon for the corresponding input driving conditions.
- The highest Miles per Gallon MPGe is 43
Now apply grade value and windspeed
Result:
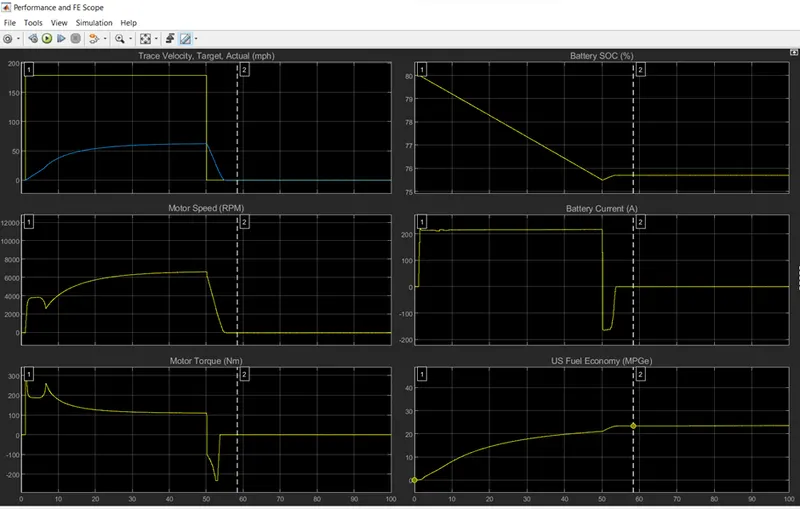
plot 1:trace velocity target vs actual
It shows the velocity of the vehicles for the drive cycle data with the scale on the x-axis
- The top speed achieved is 62mph
- The acceleration time to reach 62mph is 50.138sec
- The deceleration time from 62mph to a minimum is 5.5 sec
Plot 2: Engine Speed, Motor Speed, Generator Speed(RPM)
It shows the changes in the speed of the engine, motor, and Generator in RPM throughout the drive cycle.
- Peak Motor Speed is 6603 rpm.
Plot 3: Engine Torque, Motor Torque, Generator Torque(Nm)
It shows the Torque characteristics and the changes of an engine, motor, and generator in (Nm) throughout the drive cycle.
- Peak Motor Torque is 271Nm.
Plot 4: Battery Current (A)
It shows the Battery Current values(A) and their changes for various acceleration inputs as per the driven cycle.
- The Peak Current Discharge from Battery is 211 A
- The Peak Current Charging to the Battery is -163 A
Plot 5: Battery SOC
It shows the Battery State of Charge SOC(%) and its changes corresponding to the driving inputs.
- The State of Charge decreased from 80% to 76% of charge in 49.085 seconds for the specified driving conditions.
Plot 6: US Fuel Economy MPGe
It shows the Fuel Economy as Miles per Gallon for the corresponding input driving conditions.
- The highest Miles per Gallon MPGe is 23.5
Conclusion:
- The electric vehicle is less top speed when comper to hybrid electric vehicles in the same environment
- The efficiency of electric vehicles is higher than hybrid electric vehicles
- Electric vehicles produce zero emission