Week-4 Challenge WOT Condition Part-2
Problem 01:
Aim:
To analyze the difference between the mapped and dynamic models of engine, motor, and generator and change the model type.
Theory:
There are two types of combustion engine models in the Powertrain Blockset, they are,
- Mapped Model
- Dynamic Model
Mapped Model:
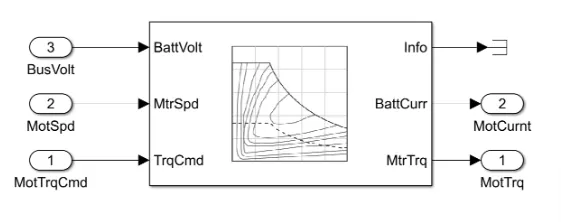
The model uses a set of steady-state lookup tables to characterize engine performance. The tables provide overall engine characteristics, including actual torque, fuel flow rate, BSFC, and engine-out exhaust emissions.
-
If you have engine data from a dynamometer or a design tool like GT-POWER.
-
For quasi-steady-state engine simulations.
Dynamic Model:
Dynamic System Models generally represent systems that have internal dynamics or memory of past states such as integrators, delays, transfer functions, and state-space models. Most commands for analyzing linear systems, such as bode, margin, and linearSystemAnalyzer, work on most Dynamic System Model objects. For Generalized Models, analysis commands use the current value of tunable parameters and the nominal value of uncertain parameters.
-
If you need a more detailed dynamic model and have component-level data.
-
To analyze the impact of individual engine components on the overall performance.
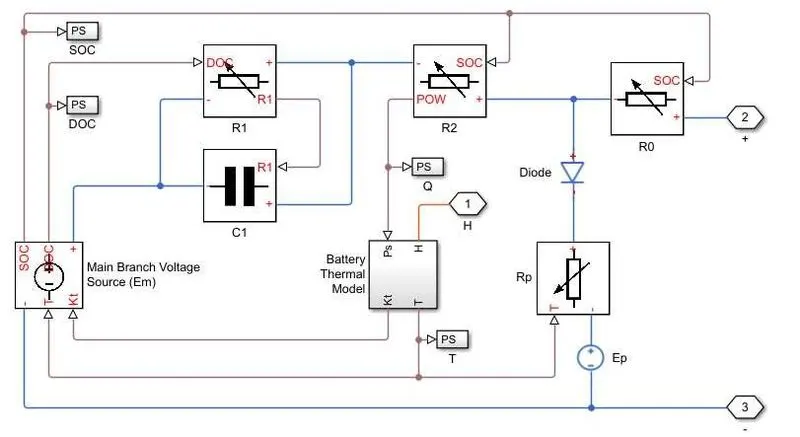
The above figure shows the dynamic model of a battery.
Steps to change model type:
First, have to select the vehicle type and then click the workflow block of the Simulink model.
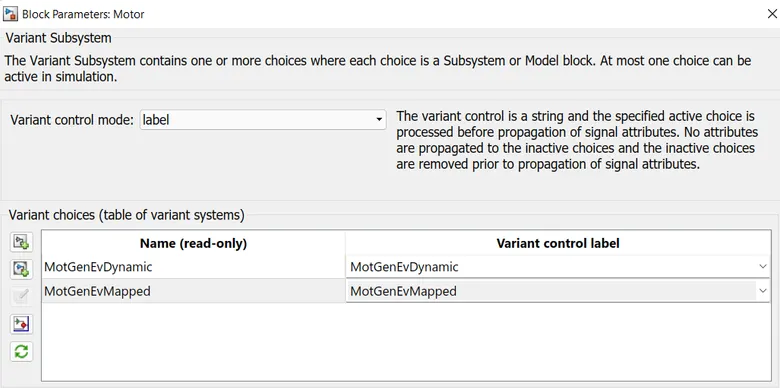
Then select the block to see the block parameters. Then select the type of model as required.

Problem 02:
Aim:
To calculate miles per gallon of the model and find, which factors are considered to model fuel flow.
Reference: The model taken is EV Reference Vehicle
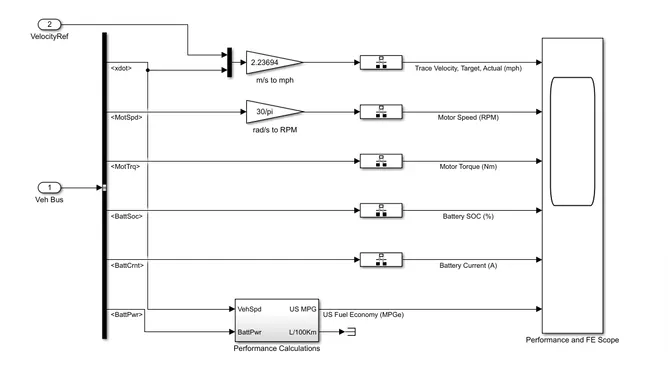
To find miles per gallon the model takes vehicle speed, battery power and fuel flow as consideration.
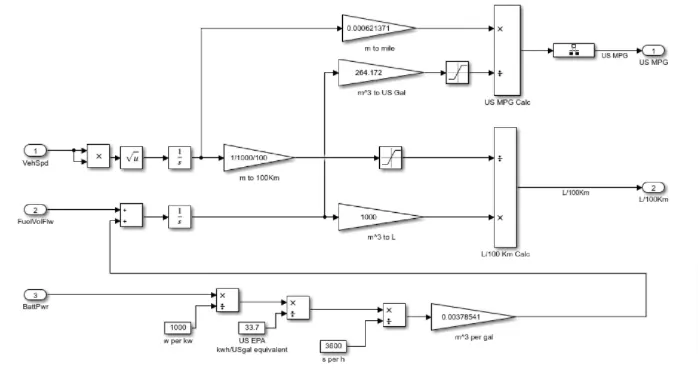
According to the calculations, a 1 kWh battery can run the vehicle for 3.125 miles. Therefore, 1 gallon of fuel can be assumed as 33.7 kWh. so, the vehicle can run 105 miles.
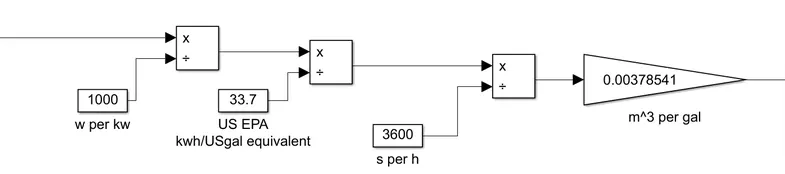
Therefore, 1 gallon is equal to 33.7 KWh. It is converted into an equivalent US gallon by multiplying with 264.172.
The miles per gallon are calculated with the value related to the US Gallons.
Problem 03:
Aim:
To Run, the HEV ReferenceApplication with WOT drive cycle then Changes the grade and wind velocity in the environment block and Comments on the results.
Hybrid Electric Vehicle:
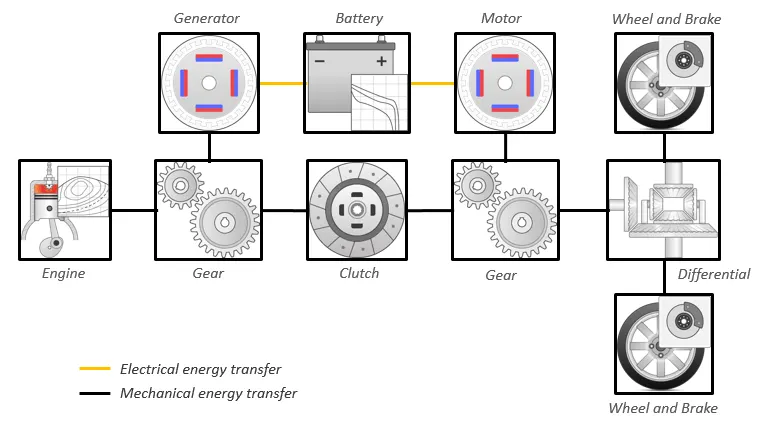
The hybrid electric vehicle reference application represents a full multimode hybrid electric vehicle (HEV) model with an internal combustion engine, transmission, battery, motor, generator, and associated powertrain control algorithms. Use the reference application for powertrain matching analysis and component selection, control and diagnostic algorithm design, and hardware-in-the-loop (HIL) testing.
Command Line:
By using below command the HEV Model is opened and analyzed.
cd(setupExample('autoblks/HEVMultimodeReferenceApplicationExample'));helpersetuphevmm
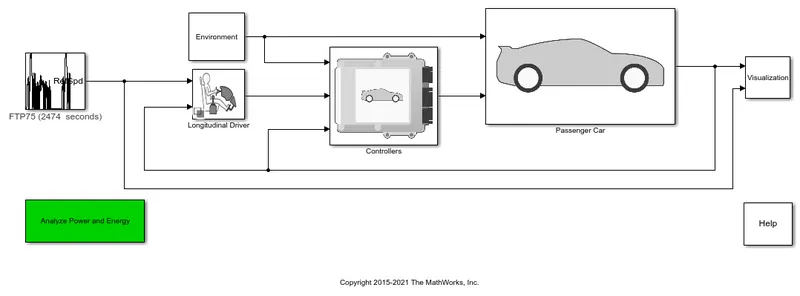
Change Drive Cycle from default to Wide Open Throttle Drive Cycle.
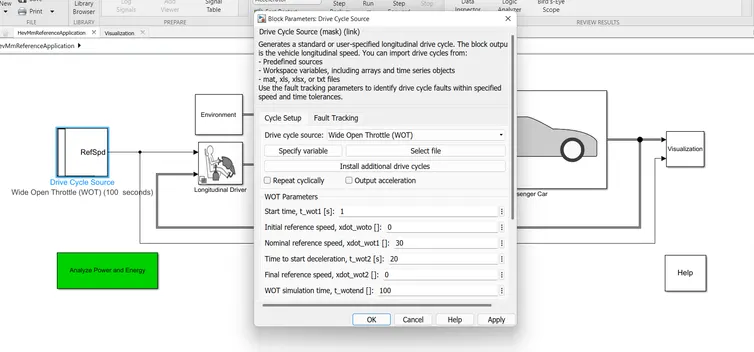
Case 1:
Simulation:
After selecting the drive cycle run the simulation
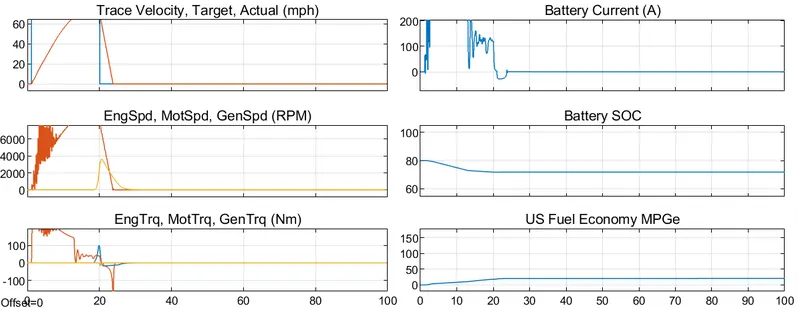
Here we can see the results in 6 different graphs,
Graph 1: Velocity of the vehicle
The first graph shows the velocity of the vehicle according to the drive cycle. The wide-open throttle is given so, the acceleration is starting suddenly high and decreased.
Graph 2: Speed
This graph shows the various speed parameters like engine speed, Motor speed, and generator speed in RPM. At the high acceleration in a starting stage, the speed is slightly high and reduced to the normal level.
Graphs 4 & 5: Battery Current
At the initial stage, the battery uses high current and is stabilized over some time
Graph 3: Torque
The various torque parameters like Engine, motor and Generator torque is measured in Newton Meter. Here the torque is reduced tragically when the vehicle moves to high speed.
Case 2:
Change in gradient and wind velocity parameters:
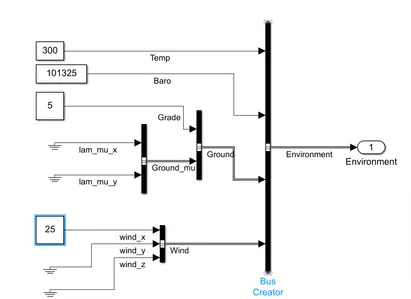
- The gradability is changed to 5 degrees
- wind velocity is changed to 25 m/s
Simulation:
Simulation is done after changing the gradability and wind velocity and same drive cycle.
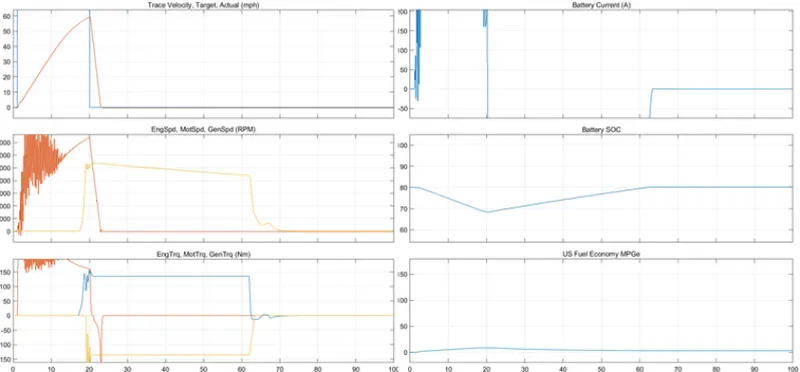
Graph 1: Velocity of the vehicle
The first graph shows the velocity of the vehicle according to the drive cycle. The wide-open throttle is given so, the acceleration is starting suddenly high and decreased.
Graph 2: Speed
This graph shows the various speed parameters like engine speed, Motor speed, and generator speed in RPM. At the high acceleration in a starting stage, the speed is slightly high and reduced to the normal level.
Graphs 4 & 5: Battery Current
At the initial stage, the battery uses high current and is stabilized over some time
Graph 3: Torque
The various torque parameters like Engine, motor, and Generator torque are measured in Newton Meter. Here the torque is reduced tragically when the vehicle moves to high speed.
Problem 04:
Aim:
To Keep all other parameters the same, compare the simulated results of hybrid and pure electric powertrains.
Fully Electric Vehicle:
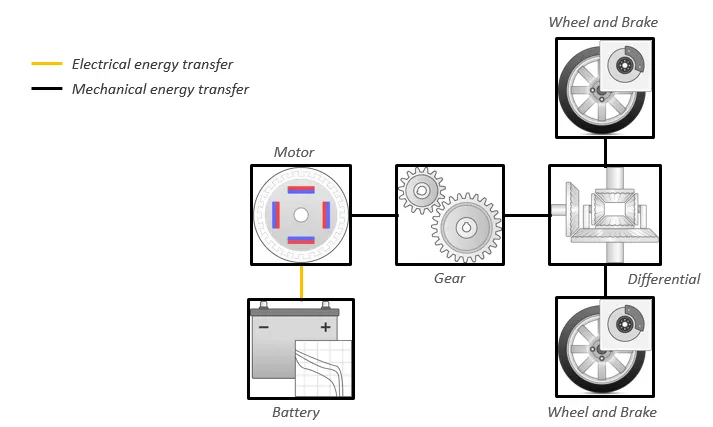
Command Line:
By using the following command the Electric Vehicle Application is successfully imported
cd(setupExample('autoblks/EVReferenceApplicationExample'));helpersetupev
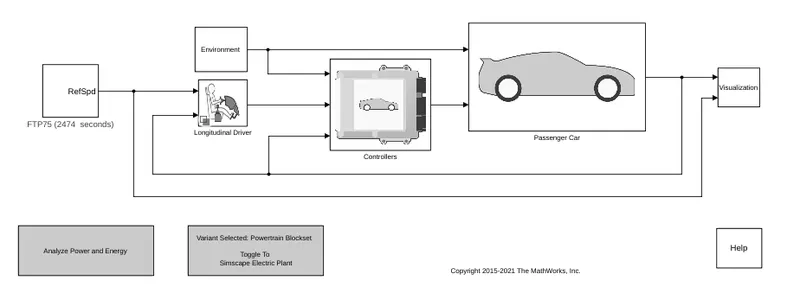
Simulation:
After selecting WOT drive cycle the simulation is done
Comparing HEV and EV in a single output:
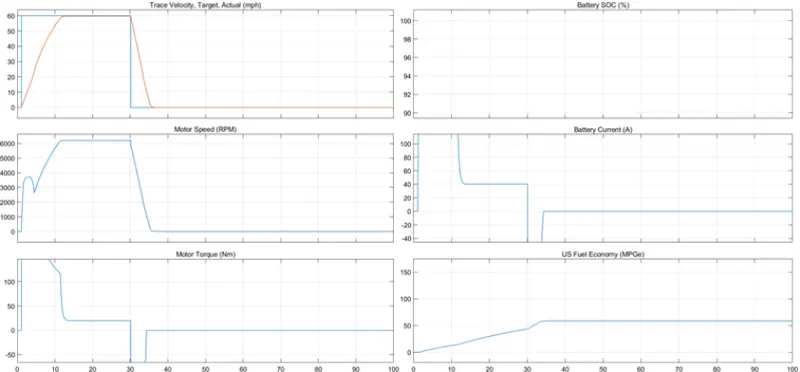
By comparing both HEV and EV models the stability and performance of the EV model are better than the HEV model.
Electric Vehicle VS Hybrid Electric Vehicle:
- The electric vehicle when compared with hybrid electric vehicles with the same environmental and Drive cycle conditions results in less top speed achievement.
- The electric vehicle produces more values of Motor speed and motor torque compared to the hybrid vehicle's motor alone, but the hybrid vehicle when it combines the torque of both motor and its engine it is higher than the electric vehicle's torque.
- As the pure electric car here uses a Lithium-ion battery compared to the Nickel-metal hydride battery the discharging capacity and the rate of charging are higher in the pure electric car.
- As it is able to discharge at a fast rate the motor can produce a high amount of torque instantly compared to the hybrid vehicle. Also, the state of charge shows the battery efficiency of the pure electric to be higher than the hybrid vehicle and this is also due to the battery type used in these cars.
- The efficiency of the Electric car is higher than the hybrid car which is evident from the miles per gallon numbers of both of these cars.
- The electric vehicle produces zero emissions whereas hybrid ones produce waste gas emissions. These are some of the observations from the comparison of the above simulations using Powertrain Blockset.
Result:
The analysis of Electric and Hybrid Electric Vehicle and the comparison of results is done successfully.