Week-4 Challenge WOT Condition Part-2
1)
Aim:
- To differentiate between mapped and dynamic engine of a vehicle in powertrain blockset.
Explaination:
| Mapped Type | Dynamic Type |
|
|
|
|
|
|
|
|
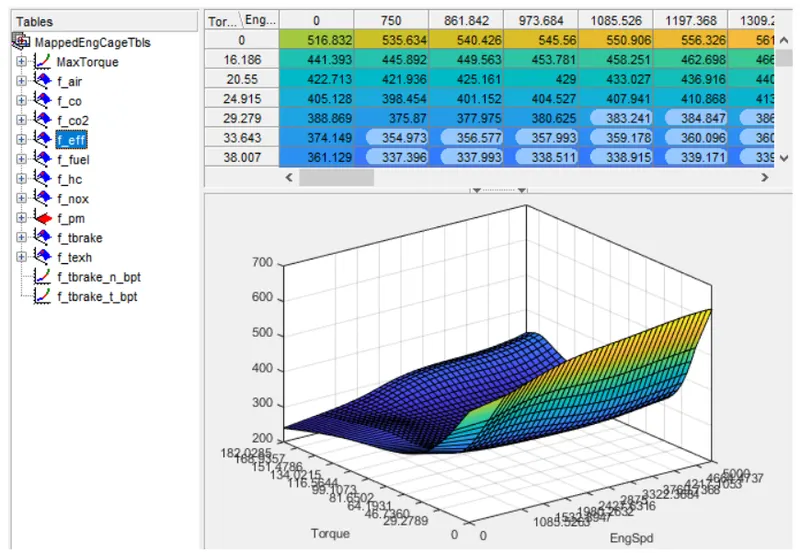
Mapped Engine:
- It represents the macro engine behaviour as a set of lookup tables such as brake torque, fuel flow, air mass flow, exhaust temperature, efficiency, emission etc as a function of commanded load and measured engine speed.
- This model is suitable for the analysis and design activities which donot require engine sub system dynamic characteristics.
Mapped Motor:
-
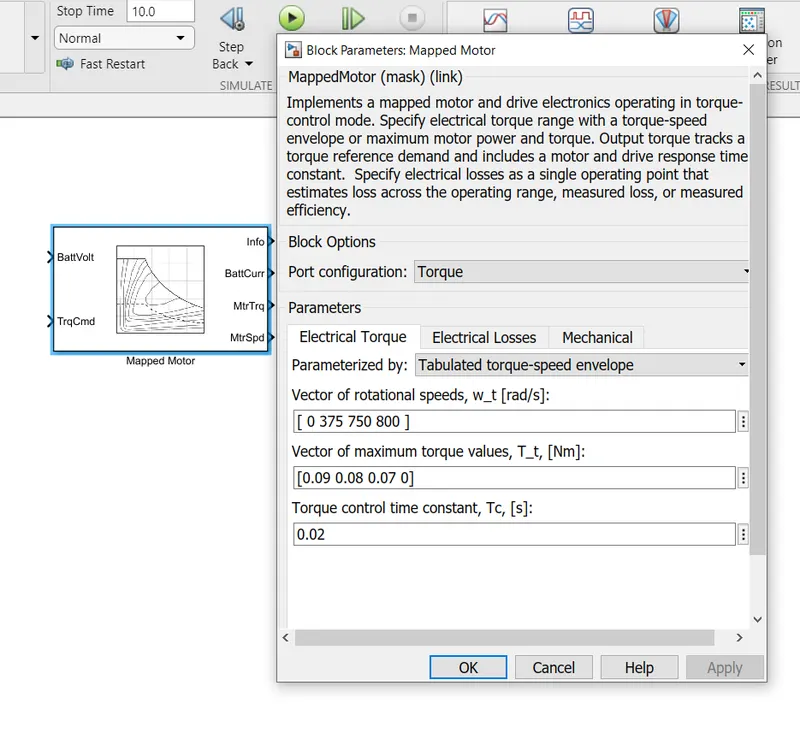
The Mapped Motor block implements a mapped motor and drive electronics operating in torque-control mode.
-
The output torque tracks the torque reference demand and includes a motor-response and drive-response time constant.
-
The block assumes that the speed fluctuations due to mechanical load do not affect the motor torque tracking.
Dynamic Engine:
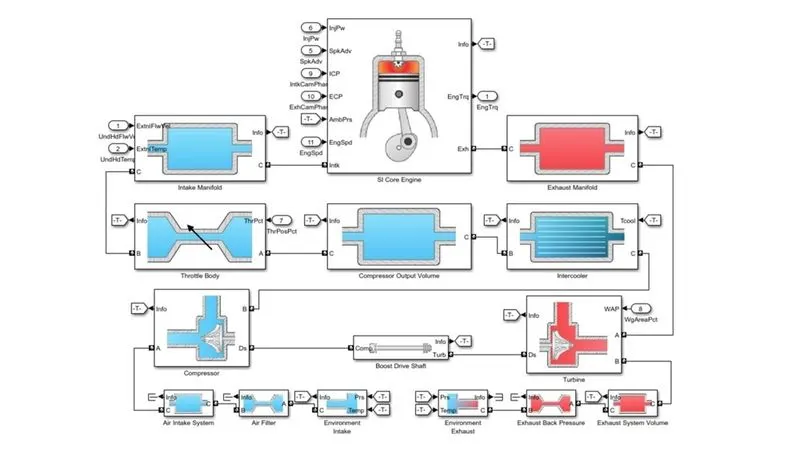
- It decomposes engine behaviour into individual component models such as intake airflow and turbocharger dynamics.
- It is also suitable for designing control, estimator and diagnostic algorithms that depends on dynamic subsystem state.
- Example: In closed loop AFR control algorithm development.
Dynamic Motor:
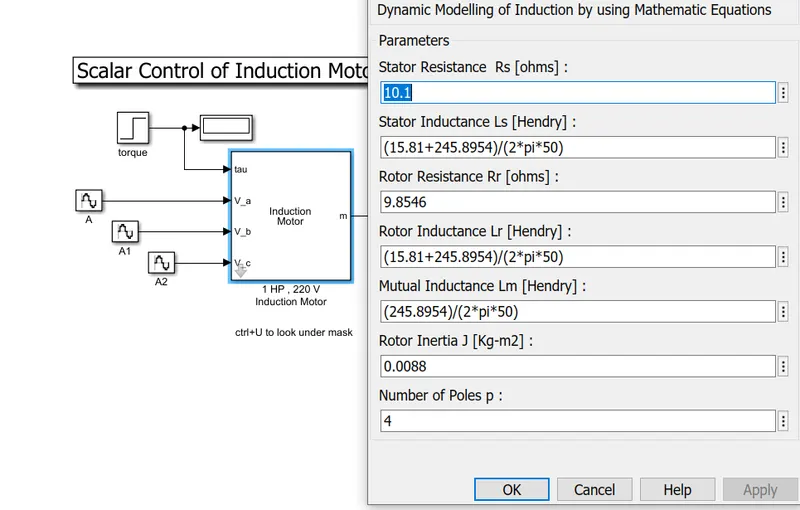
- The above diagram represents the dynamic model of a motor in which it decomposes the motor behaviour into motor mathematical characteristics that are seperated into lower level components.
To Change Model Type:
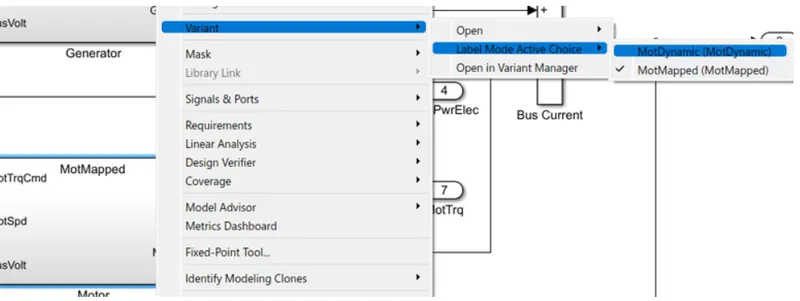
- To change the motor type from either mapped or dynamic mode we can right click on the required block.
- Choose variant option and select "Label mode active choice".
- The desired dynamic or mapped model will be obtained.
Result:
Differentiation between mapped and dynamic engine of a vehicle in power train blockset is analysed.
2)
Aim:
To find the procedure to calculate miles per gallon and factors considered to model fuel flow.
Explaination:
- MPG or miles per gallon is the distance measured in miles that a vehicle can travel per gallon of fuel.
- It is the primary measurement of fuels efficiency.
- Vehcile is said to have high fuel efficiency when it posess high MPG.
US MPG= (No. of miles driven by vehicle)/(Amount of fuel used (miles per liter))

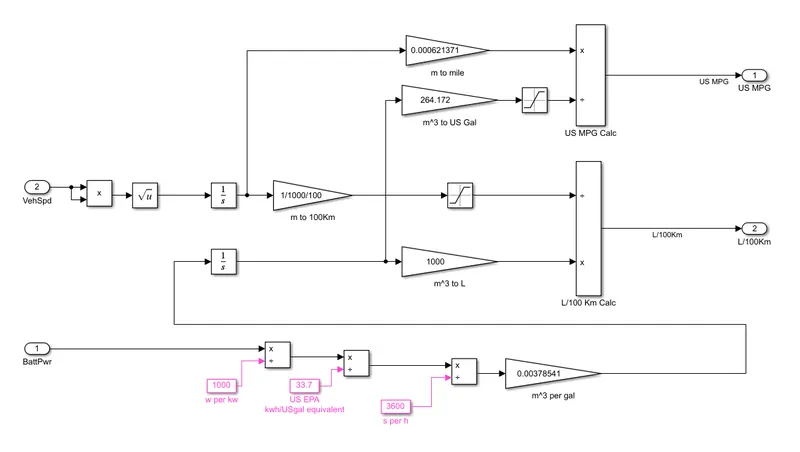
1)The obtained speed is squared from the input port of the vehicle.
2)Using integrating block the value is integrated.

1 meter=0.000621 mile

3)The above formula is used to convert the obtained value in miles........(a)

4)From the battery power input port we get power of the vehicle.

1 watt=0.001kw
1kilowatt=1000watts

5)Battery power is divided to 1000  watts per kw.

33.7kwh=1USGal as per the rating of EPA formula

6)The value is divided with 33.7 to convert it into USGal

1 hour=3600 seconds

7)Again the obtained value is divided with 3600 to convert into hour.

1US liquid gallon=0.00379 cubic meter

6)0.00379 is multiplied and integrated to obtained the value.

1 cubic meter=264.172 US liquid gallons

7)The value is converted into US liquid gallons by multiplying with 264.172
                                        ...................................(b)
8)The obtained value (a) is divided with (b) to get the US MPG in an electric vehicle.
Electric Vehicle:
Hybrid EV:
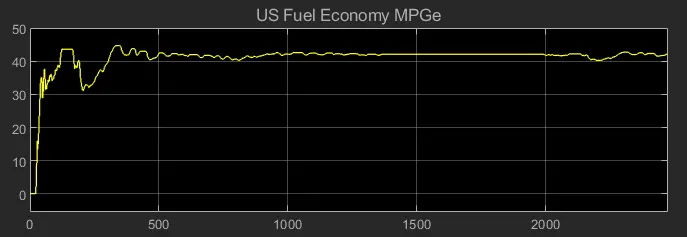
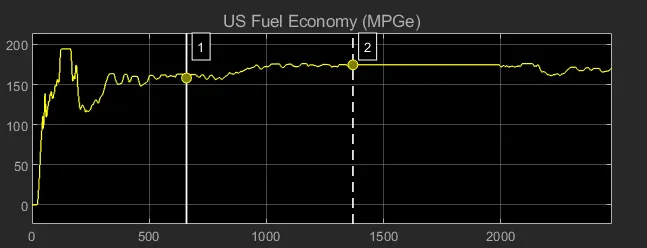
- The above graph represents the US fuel economy MPGe of both electric vehicle and hybrid vehicle.
Factors to be considered to model fuel flow :
- Vehicle speed
- Battery power
- Environmental condition
- Weight of the vehicle
- Forces acting on vehicle
Result:
Thus the procedure to calculate miles per gallon and factors considered to model fuel flow is done.
3)
Aim:
To change the grade and wind velocity of HEV Reference Application with WOT drive cycle and to observe its performance.
Principle:
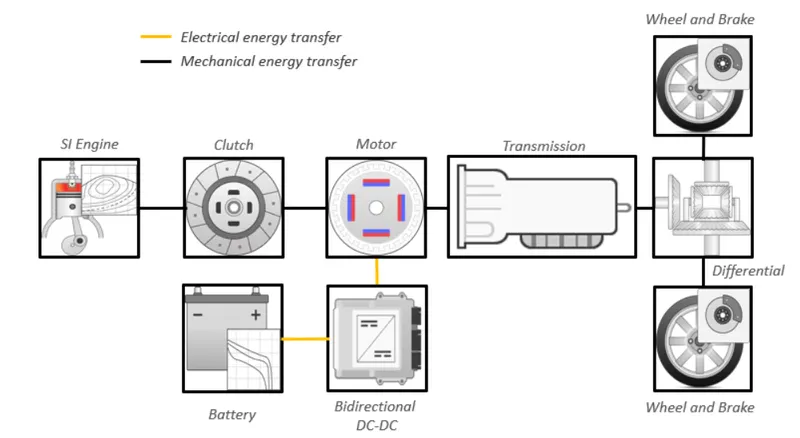
- The above image represents the electric hybrid vehicle in which the mapped SI engine is fed with required datas and it is connected to the clutch block.
- Similarly the Lithium ion battery is connected to birectional DC-DC converter such that the battery gets charged during the regenerative braking.
- Motor gives the required rotational output to run the vehicle by obtaining the required power from SI engine and battery as required.
- Through transmission block the output is given to the differential blocks connected to the wheels of the vehicle.
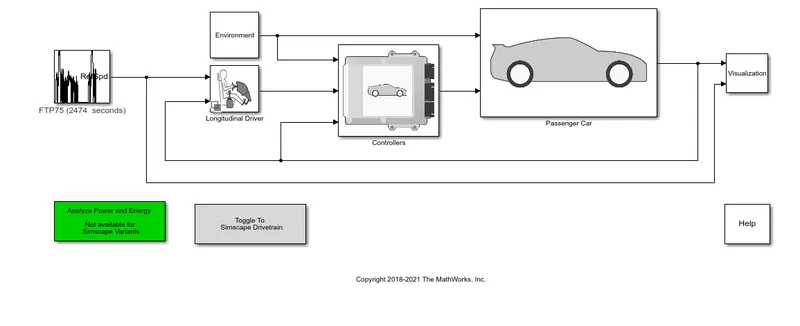
- In this image we can find that the drive cycle of FTP75 of 2474 seconds is connected to the longitudinal driver.
- Then the output is connected to the controller by considering various environmental factors such as temperature, atomospheric pressure, grade and wind velocity etc.
- The calculated value is given to the engine and electric input and the output is viewed through visualization block.
Simulation:
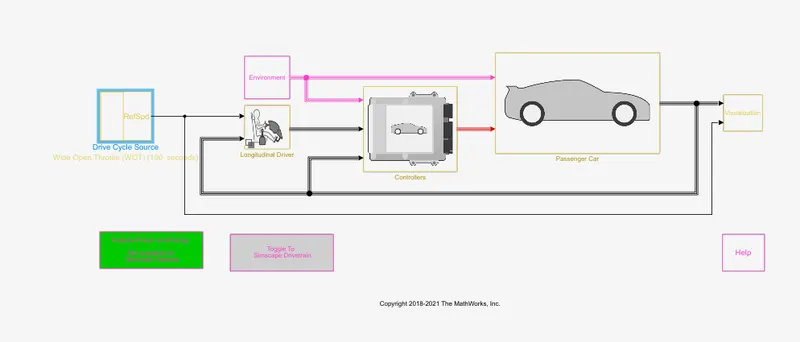
- From the above image we can see that Wide Open Throttle (WOT)drive cycle is fixed.
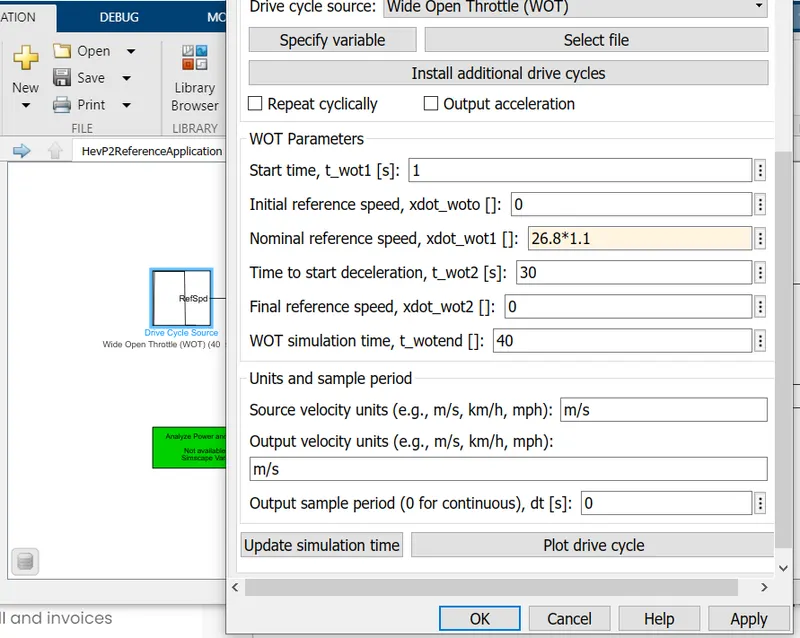
- Initial reference speed is kept zero and start time of WOT as 1.
- Reference speed as 26.8*1.1 and the deacceleration time in 30 seconds.
- The total simulation time is set as 40 seconds.
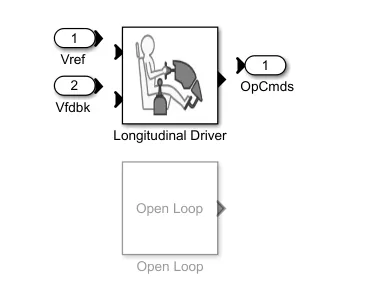
- The reference velocity from the drive cycle and the feedback velocity of the vehicle is given to the Longitudinal Driver block.
- Similarly the environmental parameters are assigned as shown in the image below.
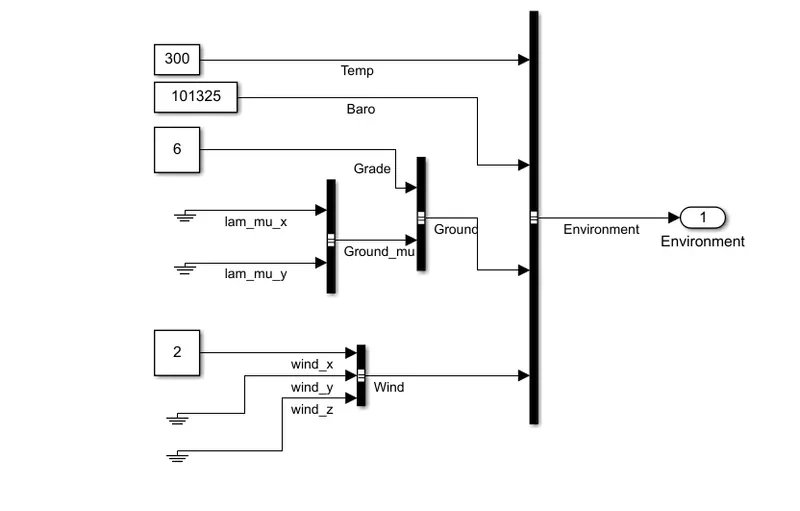
- Temperature is maintained at 300 K with atmospheric pressure of 101325 Pa.
- 6 degree grade is used with a wind velocity of 10 m/s.
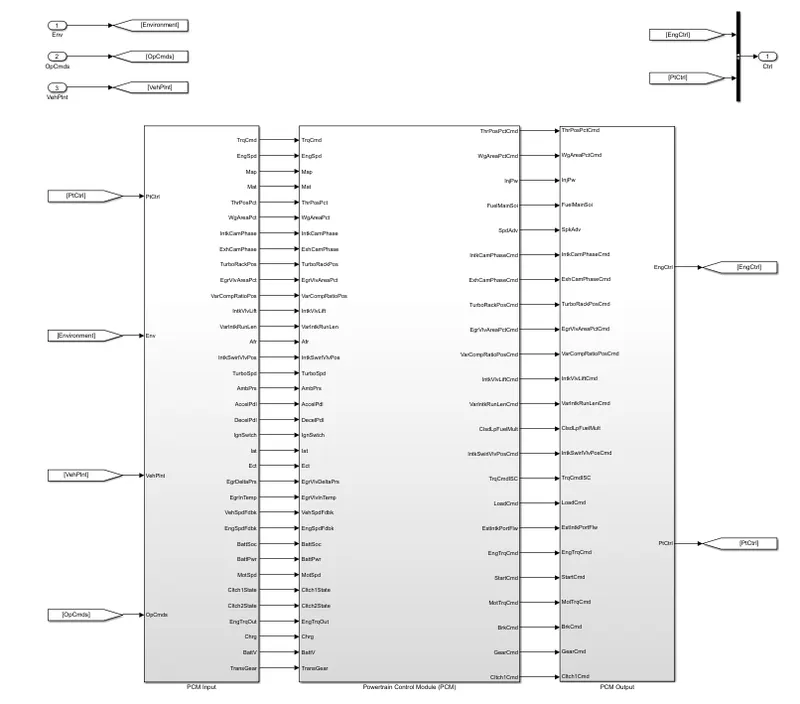
- All the parameters are given to the controllers PCM input as shown in the above image.
- The powertrain control module analyse the various inputs and gives the output through the PCM output port.
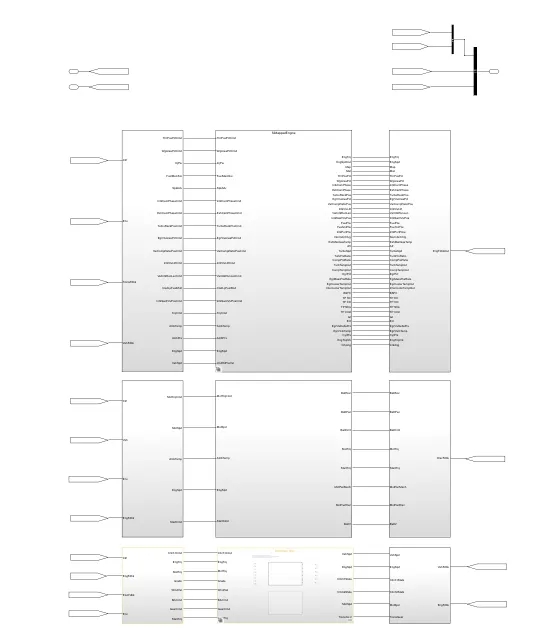
- The passanger car receives the output from controller to the engine and the electrical train block.
- Then the output of the vehicle is viewed through the visualizer block.
- Through the feedback loop the vehicle speed is fed back to compare with reference speed of the vehicle.
Output:
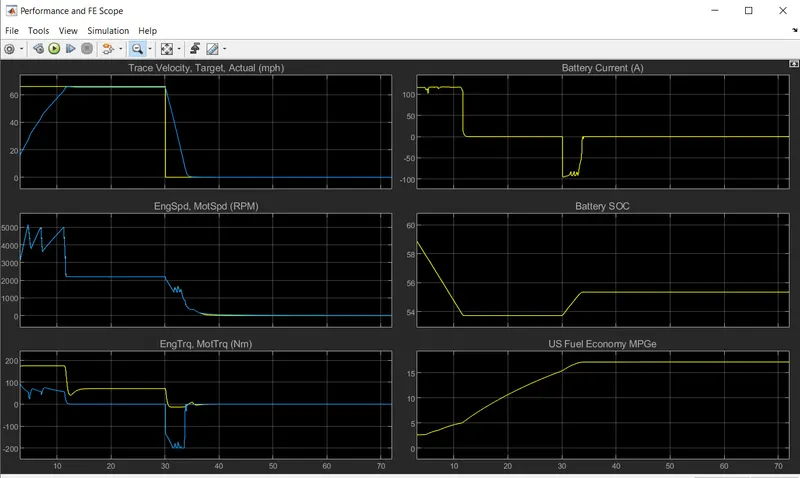
- Graph 1 velocity: For a period of 30 seconds the intial throttle is made 60m/s.
- Graph 2 motor speed : We can see that there is an increase and decrease in the speed from 5000 to 4000 RPM. Later the RPM gradually decreases to 2000 RPM during the decceleration (after 30 seconds) of the vehicle.
- Graph 3 motor torque: During acceleration the toque is increased nearly to 200 Nm and then gradually decreases to 100 Nm during decceleration.
- Graph 4 Battery Current:Maximum current (100 A) is used when the velocity is high and during decceleration the amount drecreases.
- Graph 5 Battery SOC: When the vehicle starts to run the amount of battery charge starts to decrease from 60% to 54% and during regerative braking it reaches 55%.
- Graph 6 US Fuel Economy: It is the distance in miles the vehicle travelled to the fuel used in miles per liter is MPG and here 16 MPGe is maintained in the hybrid electric vehicle.
Result:
The grade and wind velocity of HEV is changed with WOT drive cycle and its performance is analysed.
4)
Aim:
To Keep all parameters same and compare the simulated results of hybrid and pure electric powertrains.
Principle:
- An electric vehicle (EV) is a vehicle that uses one or more electric motors for propulsion.
- It can be powered by a collector system with electricity from extravehicular sources or it can be powered autonomously by a battery (sometimes charged by solar panels, or by converting fuel to electricity using fuel cells or a generator).
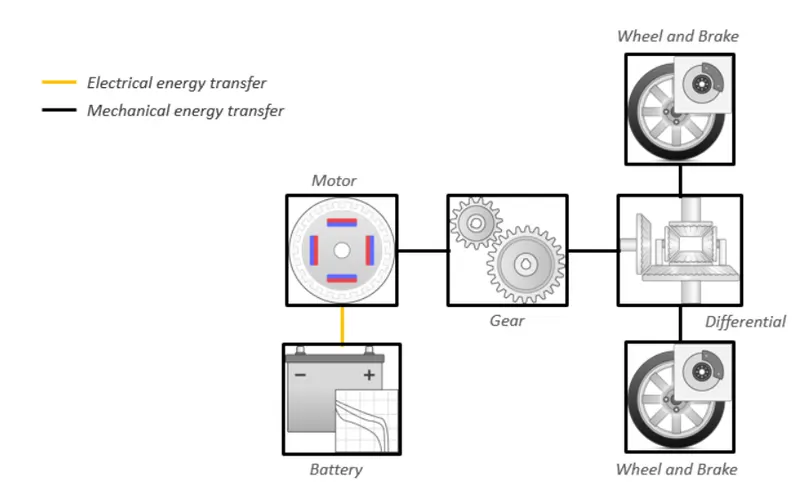
- In the above image we can see that battery supplys power to the motor.
- Then the motor is connected to the gear block and hence the wheels of the vehicle movies as per the required speed.
Simulation:
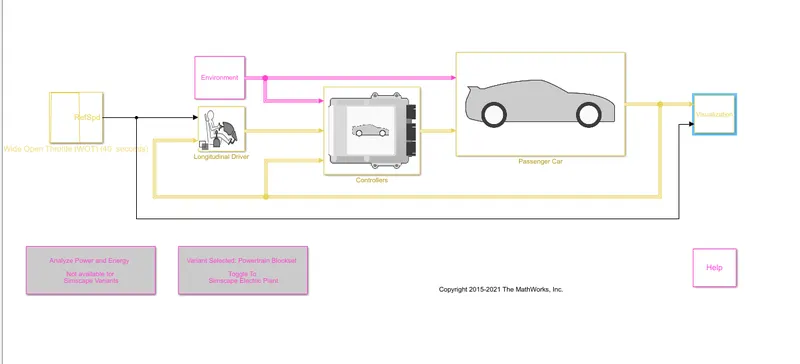
- The procedure followed for hybrid electric vehicle is done for the electric vehicle.
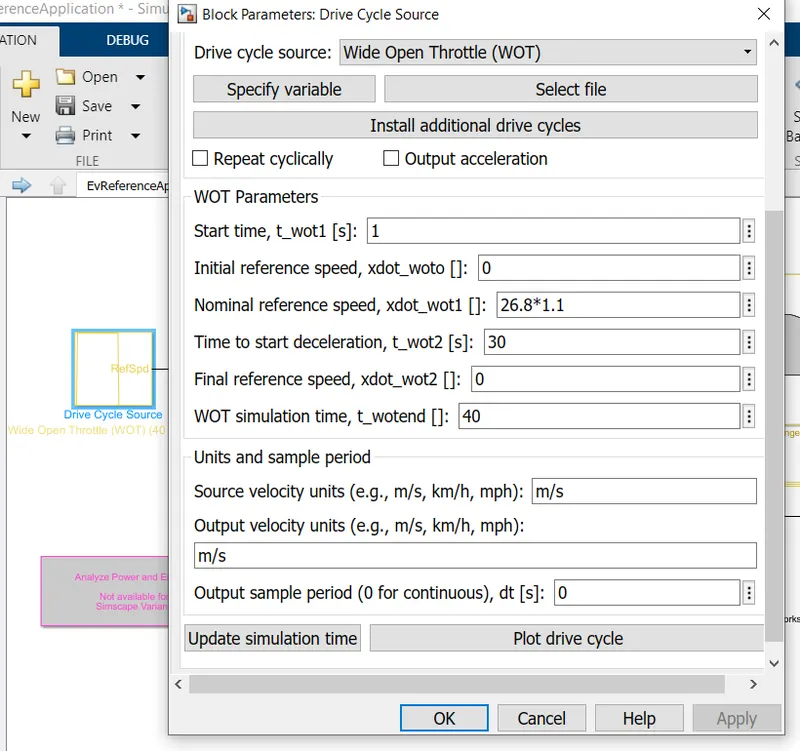
- From the above image we can see that Wide Open Throttle (WOT)drive cycle is fixed.
- Initial reference speed is kept zero and start time of WOT as 1.
- Reference speed as 26.8*1.1 and the deacceleration time in 30 seconds.
- The total simulation time is set as 40 seconds.
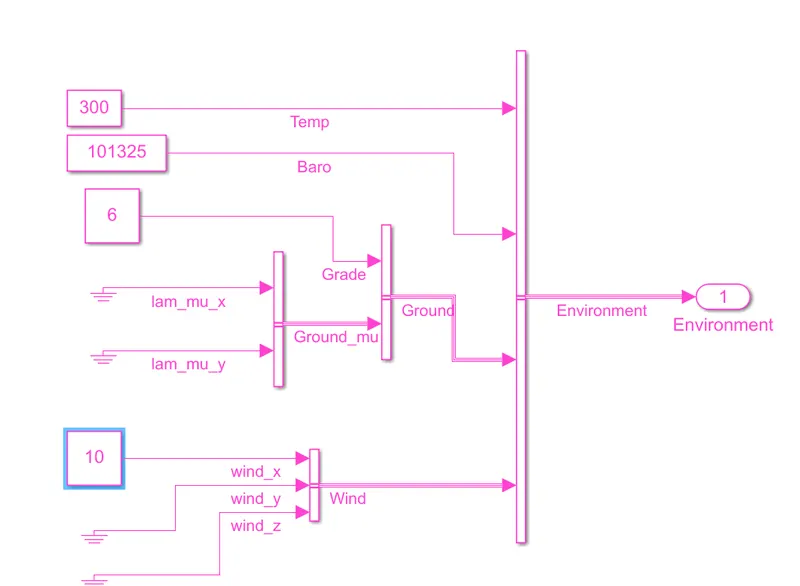
- Temperature is maintained at 300 K with atmospheric pressure of 101325 Pa.
- 6 degree grade is used with a wind velocity of 10 m/s.
Output:
Electric Vehicle:
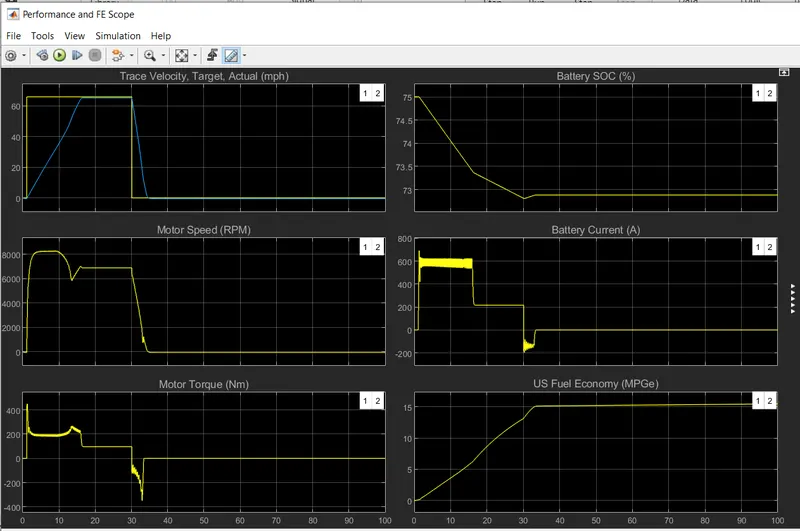
- Graph 1 velocity: For a period of 30 seconds the intial throttle is made 60.
- Graph 2 motor speed : We can see that there is an increase in the speed RPM when the velocity increases during acceleration and then decreases during the decceleration (after 30 seconds) of the vehicle.
- Graph 3 motor torque: During acceleration the toque is positive and gradually decreases and becomes negative during decceleration.
- Graph 4 Battery SOC: When the motor starts to run the amount of battery charge starts to decrease from 75% to 73%.
- Graph 5 Battery Current: Maximum current (400 A) is used when the velocity is high and during decceleration the amount drecreases to 200A.
- Graph 6 US Fuel Economy: It is the number of miles the vehicle travelled to the fuel used in miles per liter is MPG and here 15 MPGe is maintained in the electric vehicle.
Hybrid Electric Vehicle:
- Graph 1 velocity: For a period of 30 seconds the intial throttle is made 60m/s.
- Graph 2 motor speed : We can see that there is an increase and decrease in the speed from 5000 to 4000 RPM. Later the RPM gradually decreases to 2000 RPM during the decceleration (after 30 seconds) of the vehicle.
- Graph 3 motor torque: During acceleration the toque is increased nearly to 200 Nm and then gradually decreases to 100 Nm during decceleration.
- Graph 4 Battery Current:Maximum current (100 A) is used when the velocity is high and during decceleration the amount drecreases.
- Graph 5 Battery SOC: When the vehicle starts to run the amount of battery charge starts to decrease from 60% to 54% and during regerative braking it reaches 55%.
- Graph 6 US Fuel Economy: It is the distance in miles the vehicle travelled to the fuel used in miles per liter is MPG and here 16 MPGe is maintained in the hybrid electric vehicle.
Result:
Comparision of both pure electric vehicle and hybrid electric vehicle is done.
Attachment:
https://drive.google.com/file/d/1HgqVywh2CmwvwqisvFDjU9hP6XW4xSlZ/view?usp=sharing