Week-4 Challenge WOT Condition Part-2
- What is the difference between mapped and dynamic model of engine, motor and generator? How can you change model type?
ANS:
Mapped engines represent macro engine behaviour as a set of lookup tables (brake torque, fuel flow, air mass flow, exhaust temperature, efficiency, and emissions) as functions of commanded load and measured engine speed.
Dynamic engines decompose engine behaviour into individual component models that account for engine dynamics, most notably intake airflow and turbocharger dynamics.
Specify electrical torque range with a torque-speed envelope. Also Specify electrical losses as a single operating point that estimates loss across the operating range
Dynamic engine models are suitable for designing control. Estimator, and diagnostic algorithms that depend on dynamic subsystem states, for example, in closed-loop AFR control algorithm development. Mapped engine models are suitable for analysis and design activities that do not require engine subsystem dynamic characteristics, for example, in engine and transmission powertrain matching analysis for fuel economy, emissions, and performance. Dynamic Model decomposes the behaviour of component characteristics that are separated into lowering components in this way, the models capture the dynamic effects.
We can see that dynamic blocks have required input. like, TraCmd, EngSpd,
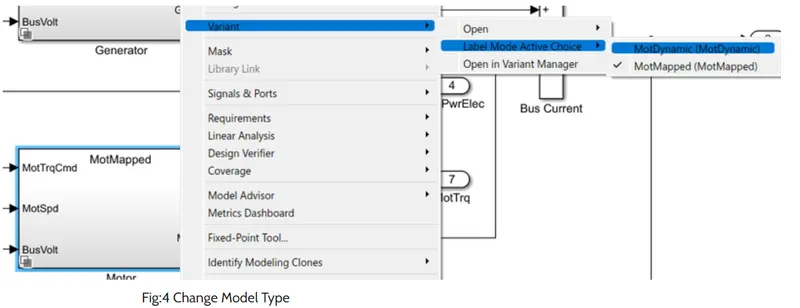
How can you change model type?
From Variant subsystem; we can activate the choice.
If we have 'Hybrid electric vehicle (HEV) - Multimode; file then this path needs to be followed
HevMmReferenceApplication> Passenger Car > Electric Plant > Motor (Variant subsystem) > Right click > Variant > labelmod active choice > select which to active.
- How does the model calculate miles per gallon? Which factors are considered to model fuel flow?
Miles per gallon (MPG) is a fuel economy rating determined by how far a car can travel on a gallon of gasoline or diesel. Although the metric version would be kilometres per litre, MPG is adopted in many metric-system countries, like Canada.
A gallon is a unit of measurement for liquids. In America, it is equal to about 3.785 litres. MPG, or miles per gallon, is the distance, measured in miles, that a car can travel per gallon of fuel. MPG is also the primary measurement of a car's fuel efficiency: The higher a car's MPG, the more fuel efficient it is.
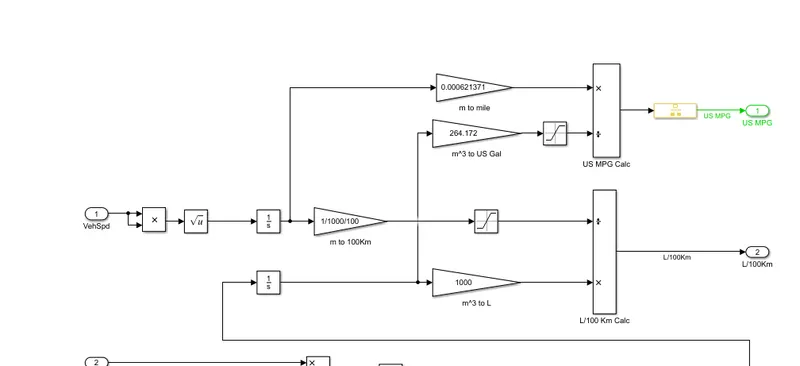
Factors considered in model fuel flow:-
1) Battery power Capacity should be high and vehicle power consumption should be low for higher MPG (Miles Per Gallon equivalent).
2) vehicle speed
3.Run the HEV Reference Application with WOT drive cycle. Change the grade and wind velocity in the environment block. Comment on the results.
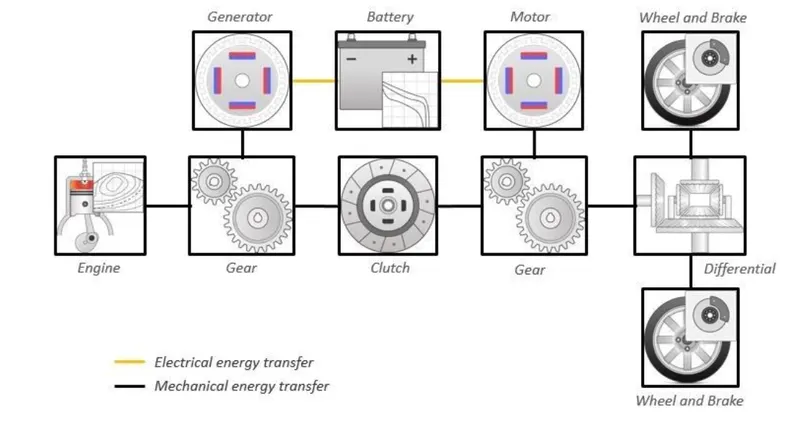
Here First we have simulated HEV on WOT with its default conditions. Where O-5 sec idle, 5-80 sec with speed 50 m/s , after 80 sec going to start deceleration, then remain O m/s until 210sec. Let's understand the above curve.
As per the 'Battery SOC curve' we can see at initial level battery at 80%. it's controlled by 'Relay block (SOC Controller Off/On) where Switch on Point "ChrgSOCHi" variable set at 80 & Switch off Point "ChrgSOCLo" variable set at 70.
As per the "RPM curve" we can see at initial level only the motor is started to power up the vehicle because of battery SOC at 80%. with time the battery SOC is going to discharge, and after 20 sec battery SOC going to below 70%. And at that point the same time Engine & Generator is started can be seen in "Torque curve".
As per the 'input velocity curve' it instantly increases O to 50 m/s. But as we can see, practically is that not possible, Velocity is increasing in a smooth radius. Here limiting factor is Battery output current(A). As per 'Current curve' we can see the max. current output is around 500 amp. After some time at around 44 sec the vehicle matched the top speed of input speed 112mph (-50m/s). Up to -40 sec the vehicle maintaining its top speed. As here "Parallel arrangement to transmit the power' so, motor rpm becomes high with the high speed of vehicle but due to engine running, torque is divided between motor and engine. That is why we can see battery current & motor torque reduced by about 65%.
After 80 sec, input speed is O. vehicle is going down to O. In 5 sec vehicle speed is becomes O. Between 80-85 sec we can see the motor has a negative torque & current value, Because of at that time the motor is not giving any output but for a short period of time it works as a generator. This is the regenerative braking system concept.
Now, after 85 sec we can see the vehicle speed is O m/s but still the engine and generator are on. Because of battery SOC at 58%. And as per 'SOC Controller, it is trying to recharge the battery up to 80%. As we can see, around 18Osec the battery is achieve 80% SOC. And then after 180 sec all component is turning off.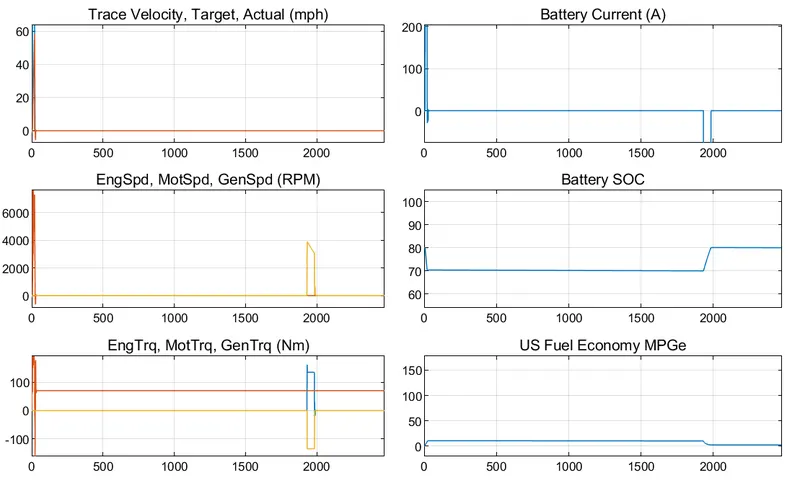
Result:-
- The target velocity actual was only able to achieve 50.4 mph. The battery current was increased up to 500 Amp and maintained for a duration of 14 sec.
- Engine speed was able to achieve 8000 RPM but for a small duration of time and battery State of Charge (SC) was decrease from 80 to 70.
- Engine torque increases initially and goes to negative after 20th second and the peak torque achieve was around 275 Nm. The fuel economy was increased from O to 8.7 and remains constant.
4) Keeping all other parameters same, compare the simulated results of hybrid and pure electric powertrains.
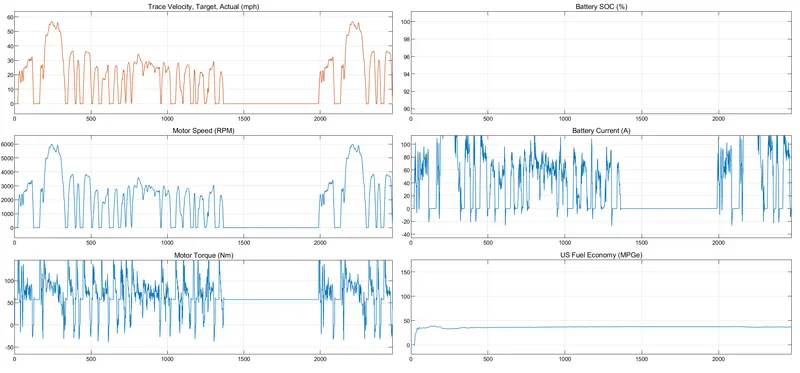
Case 1: - HEV Multimode Reference Application
- open Hev Reference Application model in MATLAB.
- The model consists of Environment, Drive cycle, Longitudinal Driver passenger and visualisation Subsystem
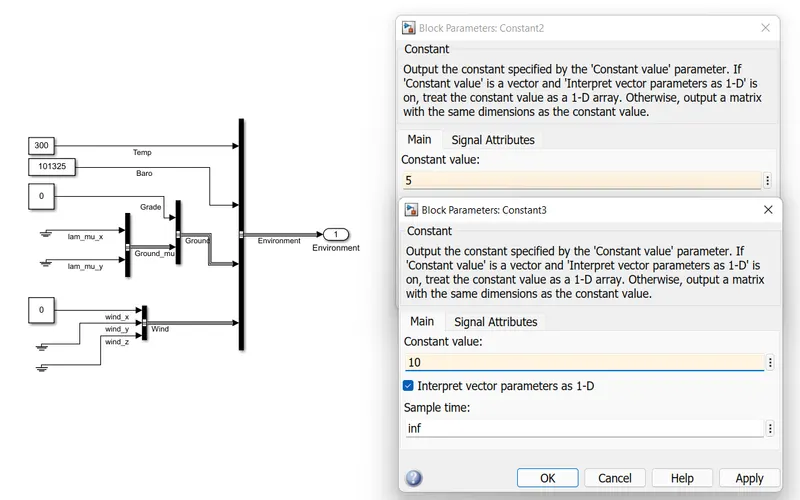
- open the environment block and change the grade value to 5 and wind velocity 10.
- Now run the simulation with 2474 seconds and go to visualisation to see the graph.
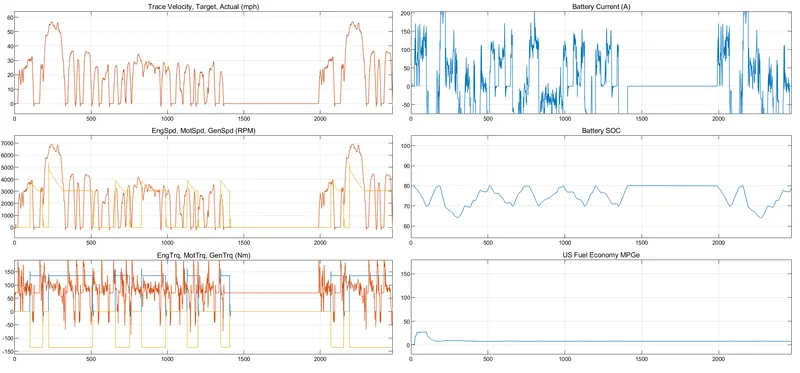
Case 2: - EV Reference application model
- open Electric Vehicle Reference Application model in MATLAB.
- The model consists of Environment, Drive cycle, Longitudinal Driver passenger and visualisation Subsystem as similar to HEV but as it is a pure electric vehicle the complexity in the model is less and the rendering time is less.
- open the environment block and change the grade value to 5 and wind velocity to 10.
- Now run the simulation with 2474 seconds and go to visualisation to see the graph.
Conclusion:-
1) Battery current is continuesly changing in HEV due to charging and discharging
while in pure EV the battery current is consistanty dropping.
2) The US fuel economy is high in EV compared to HEV, traveling cost is less for EV.
3) The motor speed (RPM) is high for HEV compared to EV.