Week-4 Challenge WOT Condition Part-2
Q.NO 1. What is the difference between mapped and dynamic model of motor, generator and engine? How can you change the model type?
Mapped model: This is developed using look up tables. We can map the data if we have motor or generator data.
It Implements a mapped motor and drive electronics operating in torque-control mode. Specify electrical torque range with a torque-speed envelope or maximum motor power and torque. Output torque tracks a torque reference demand and includes a motor and drive response time constant. Specify electrical losses as a single operating point that estimates loss across the operating range, measured loss, or measured efficiency.
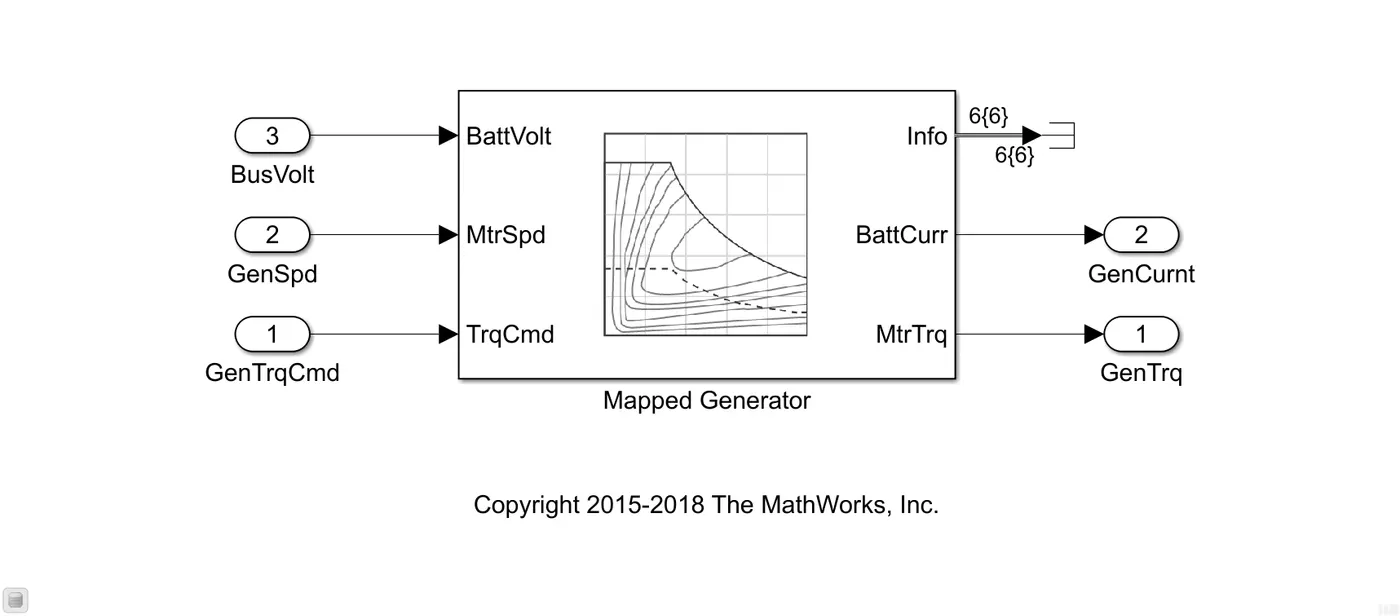
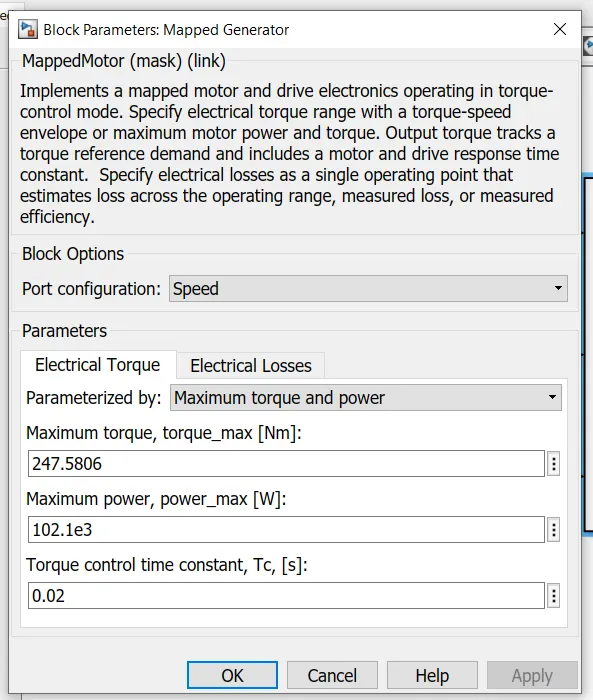
Figure 1. Mapped model and their parameters.
Dynamic model: It is nothing but actual model. Dynamic model will sense the current or voltage or speed etc., and implemented. So it is a slow process compare to static model. Dynamic System Models generally represent systems that have internal dynamics or memory of past states such as integrators, delays, transfer functions, and state-space models.
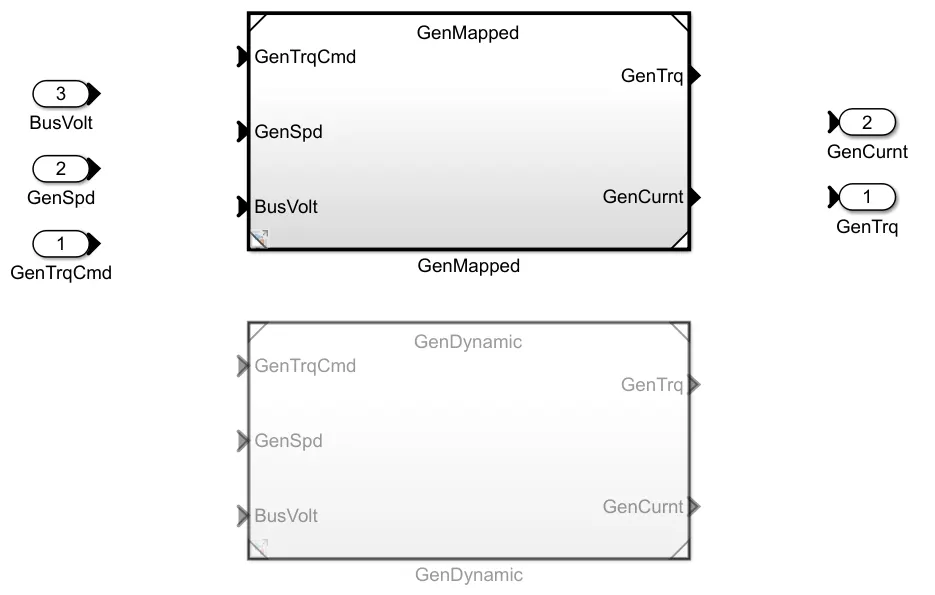
Figure 2. Dynamic Model.
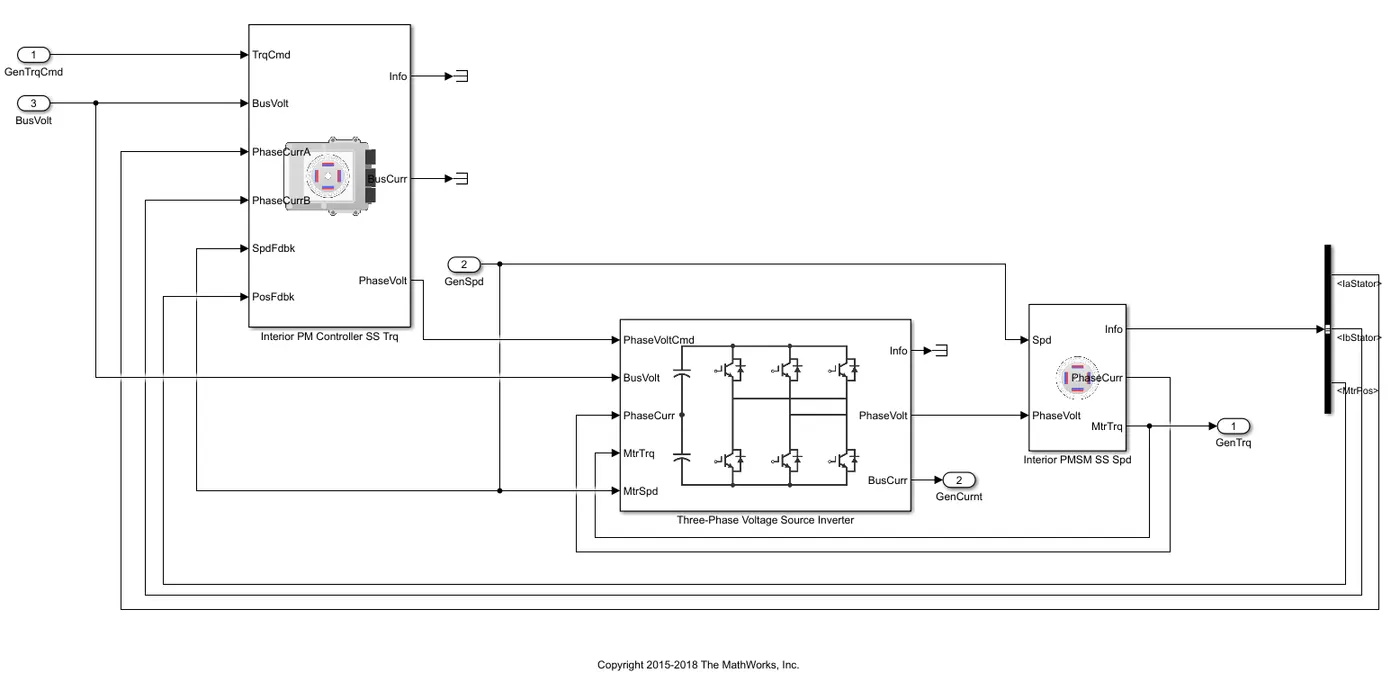
Figure 3. Internal blocks of Dynamic Model.
Example of Mapped and dynamic models:

How can you change the model from mapped to dynamic?

Figure 4. changing from mapped to the dynamic model.
Q.NO 2 How does the models calculate miles per gallon (MPS)? Which factors are considered to model fuel flow.
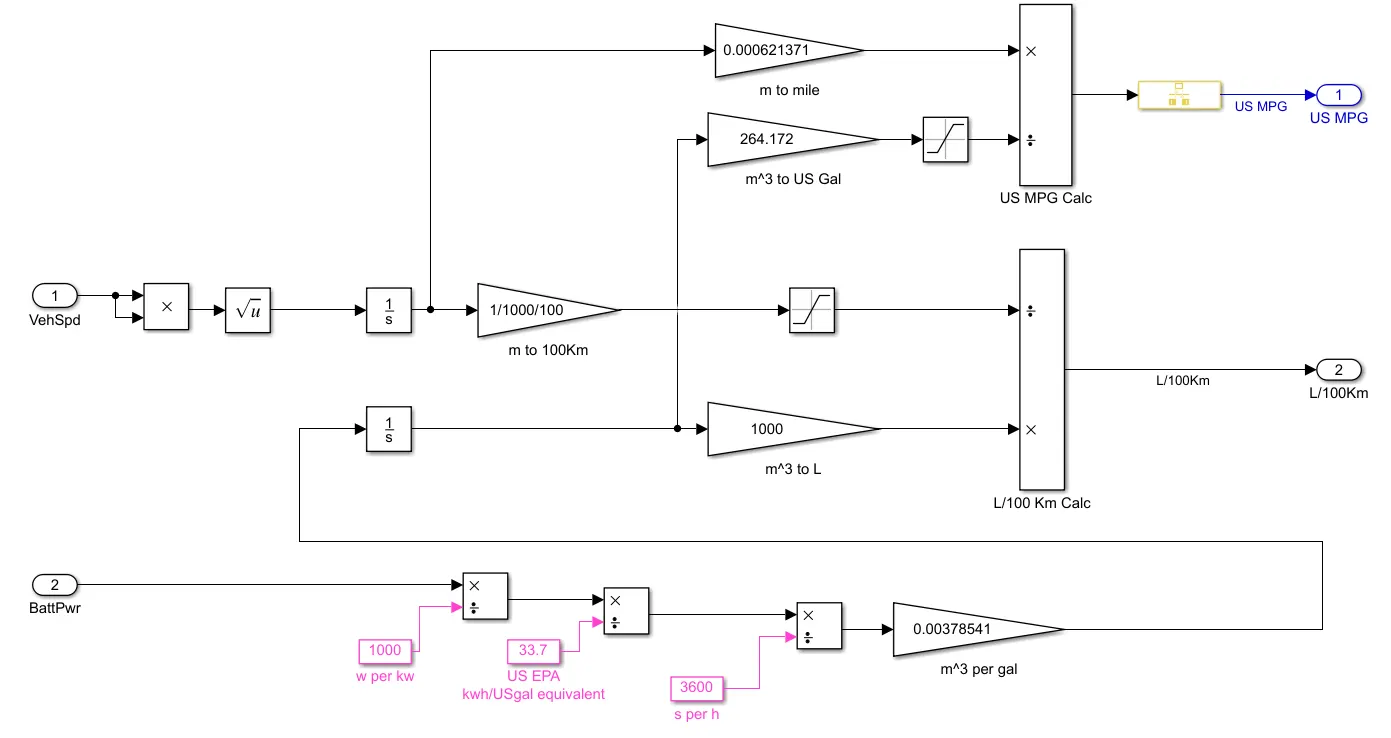
Figure 5. For Hybrid Electric Vehicle.
For this type of vehicle initially vehicle speed is converted into meters and then to miles. This vehicle speed is also converted from m to 100km to get L/100Km. Fuelvolflw is converted into m^3 and then to litre L. The battery power initially converted into kw and to m^3pergal. This block is again added with integrator block which gives only m^3 and the output of this block is connected to gain block which will converts m^3 to US GAL. By using multiply or divide block mile and USGAL converted into USMPG block. For EV Fuelvolflw is not present and the remaining parameters are same as in the case of HEV.
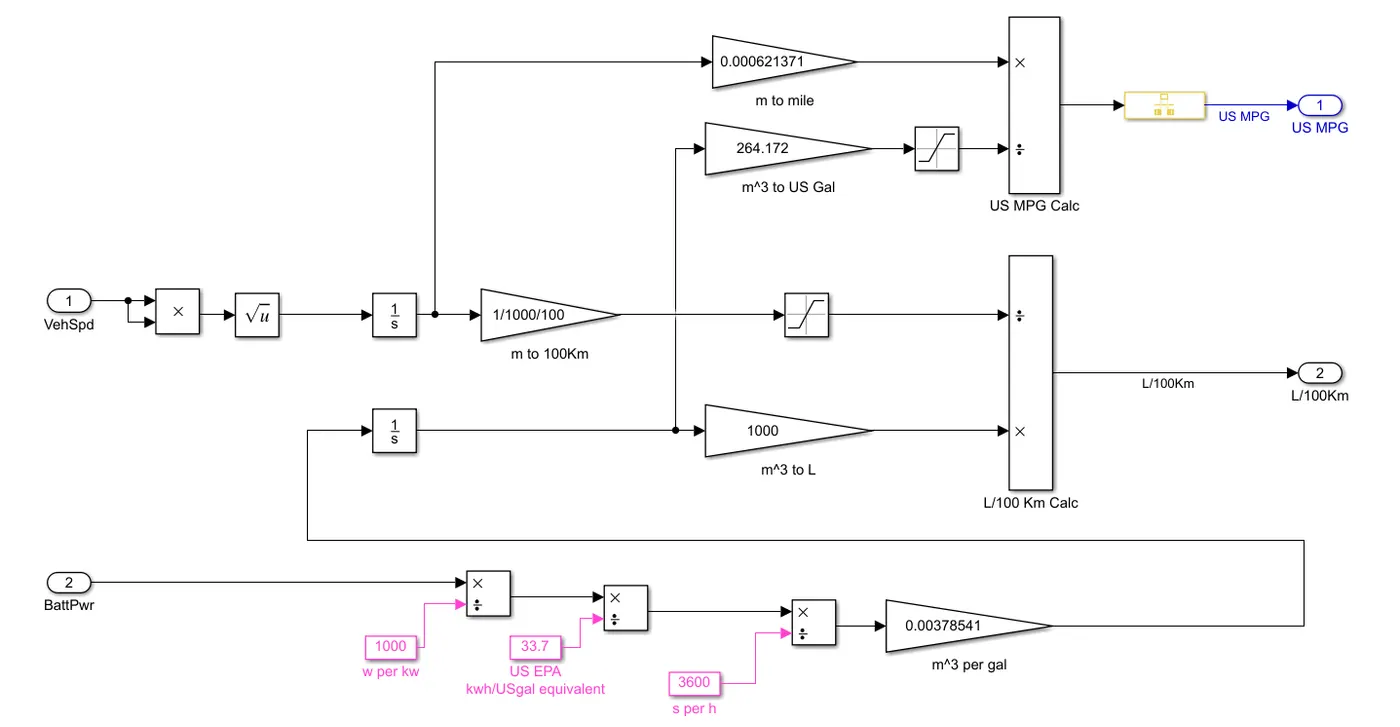
Figure 6. For Electric Vehicle only.
Factors must be considered for HEV: The factors are Vehicle speed, fuelvolflw and battery power.
Factors must be considered for EV: The factors are Vehicle speed and battery power.
Q.NO 3. Run the HEV Reference Application with WOT Drive cycle. Change the grade and wind velocity in the environment block. Comment on the results.
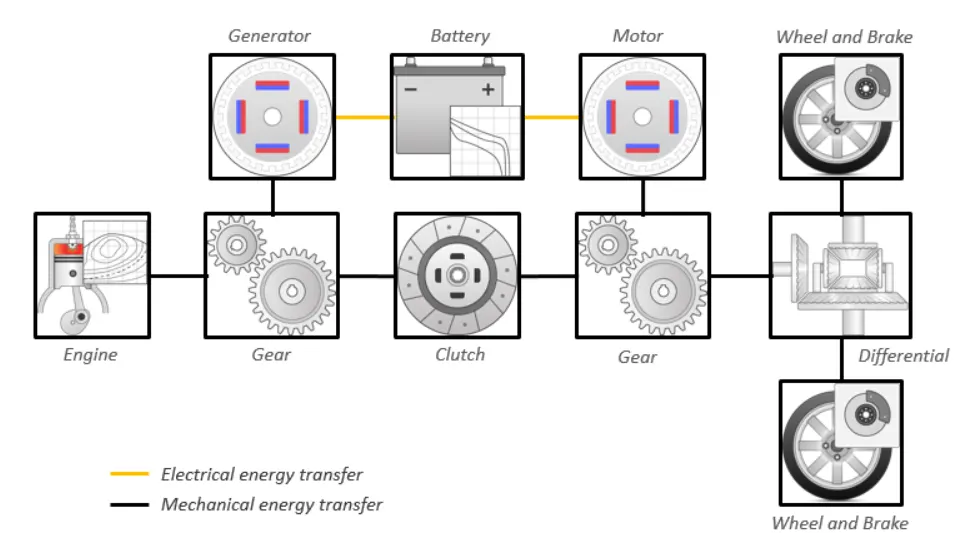
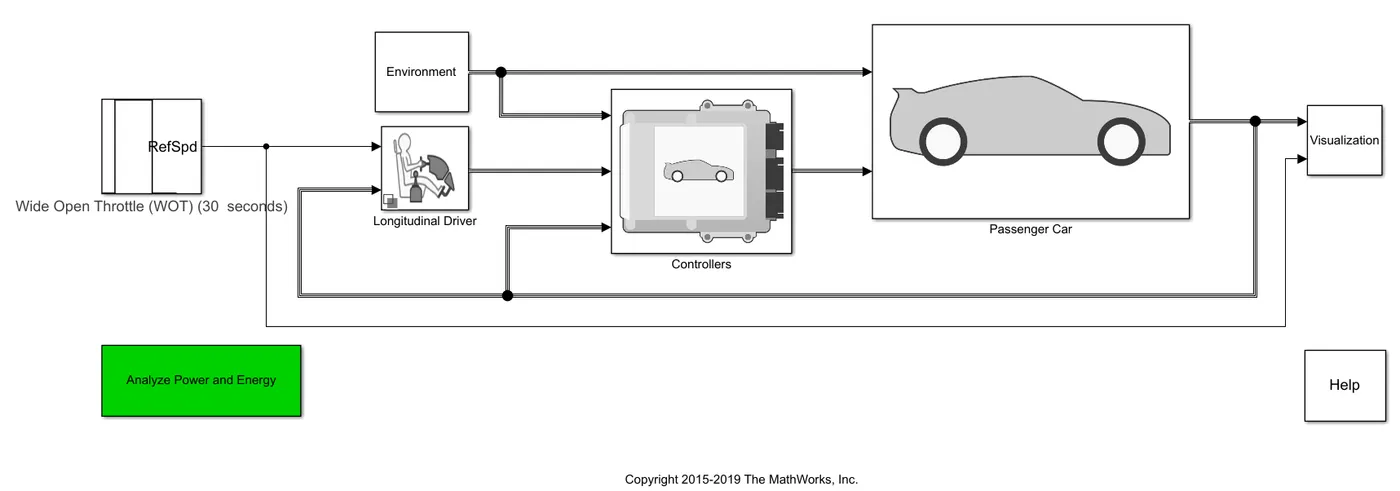
Figure 7. HEV Multimode Reference Application.
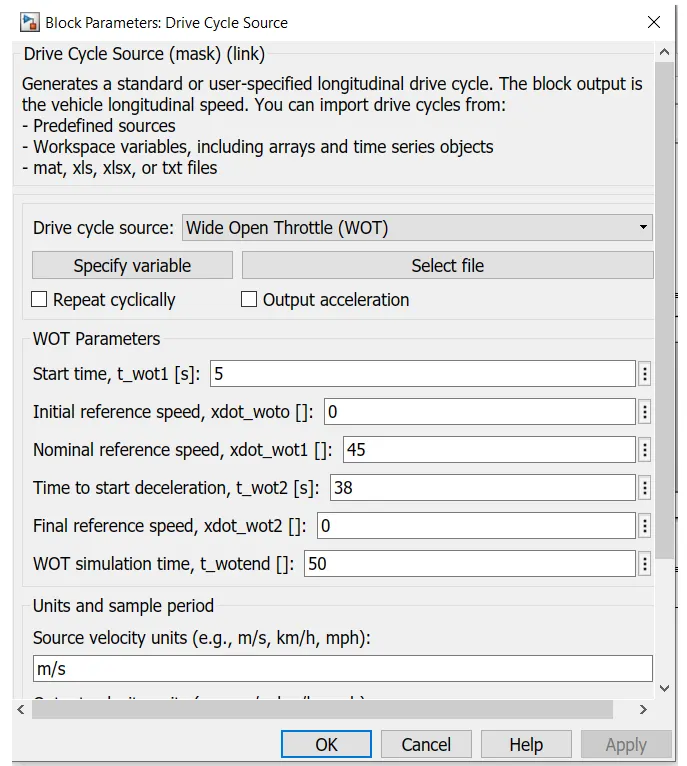
Figure 8. HEV Drive Cycle.
The above drive cycle shows that reference speed in terms of mps is 45 m/s or 100.62 mph. It will start deceleration from 38sec and the simulation time is 50Sec. Also the WOT will start at 5Sec.
Case i: Grade =0 and wind velocity=0
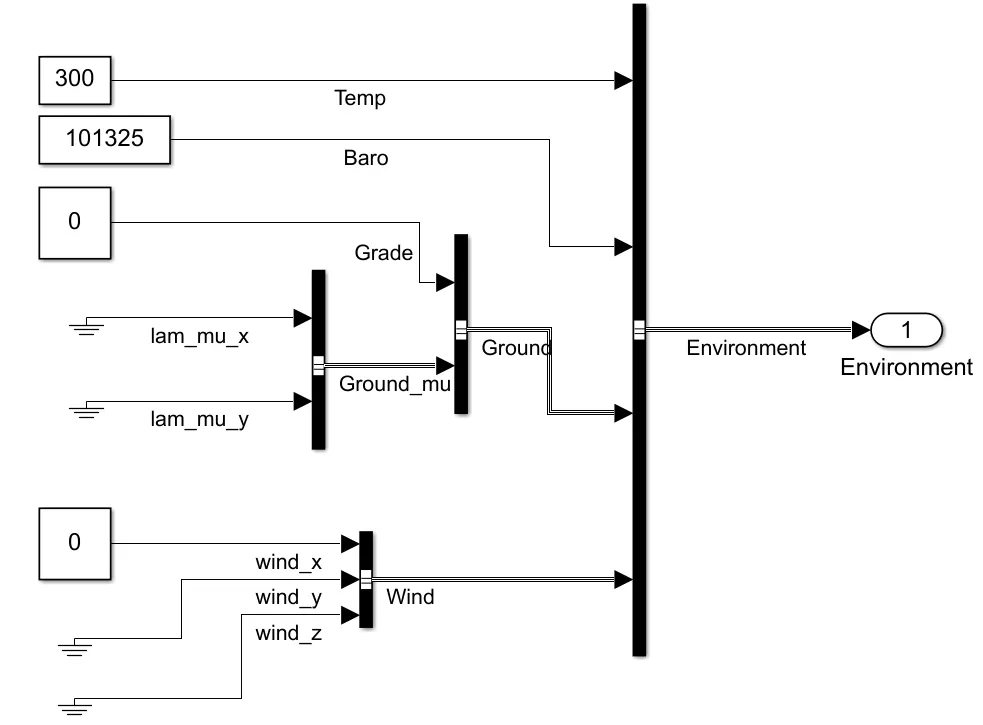
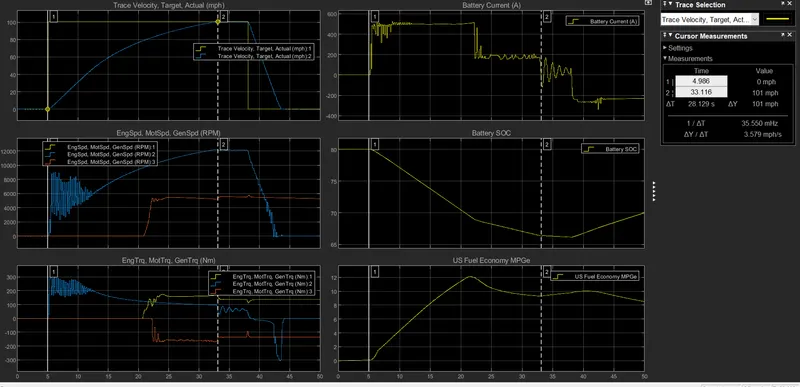
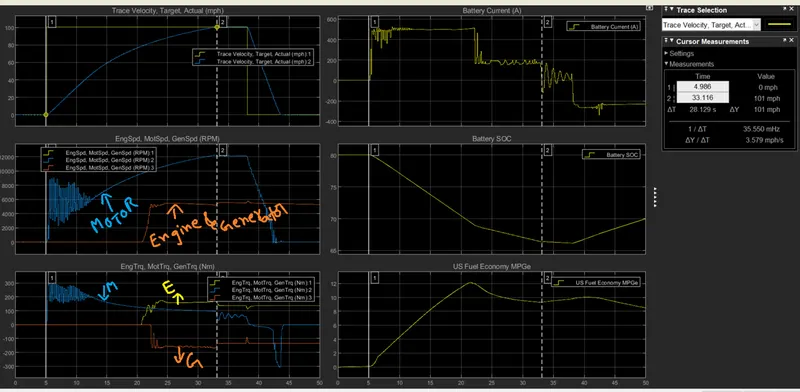
Figure 9. Results of HEV when Grade and wind velocity are 0.
In this case, maximum speed is achieved at 33.116sec and total time required is 28.129sec to reach maximum speed. Because WOT drive cycle is starting at 5sec onwards.
Mode i: From 5sec to 22.5 Sec: From the results of Battery current waveform shown in Figure 9, it is observed that battery current is maintained as constant and the magnitude is 500A. In this period the battery SOC is reduced from 80 to 68. Therefore, in this period only motor is operated from the battery. The power flow path is as shown in Figure 10. Out of 3 rotating equipment’s Motor has only started from 5sec and remaining two equipment’s i.e engine and generator are in OFF state.
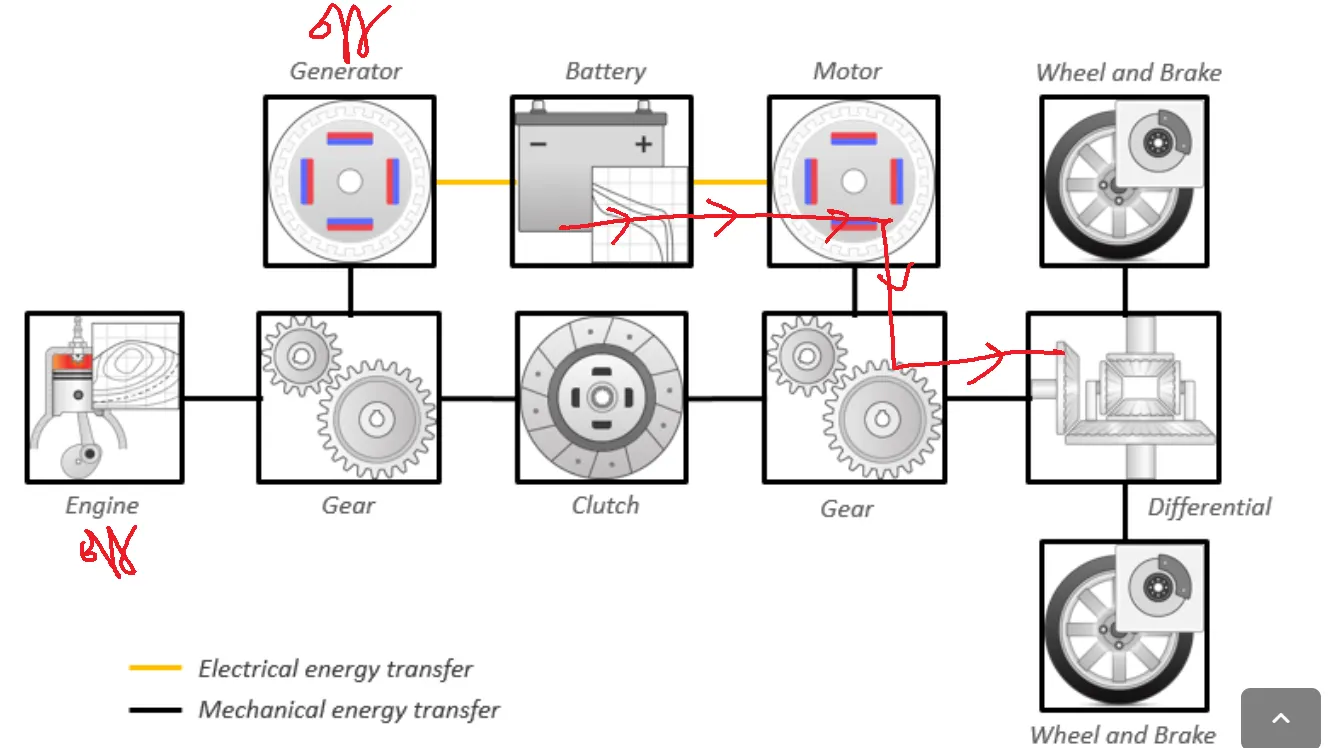
Figure 10. Power flow path for Mode i.
Mode ii: From 22.5 Sec to 33.11Sec: In this case, the battery current is reduced from 500A to 190A which is shown in figure 9 (battery current). From the SOC curve also, it is understood that the SOC is still reduced to 66 which is shown in figure 9. Therefore, immediately Engine and generator has started to reach required speed. The generator is also rotating and the generated power is given to the motor through PEC (Power electronic controller). In this case the motor will rotates with the help of two energy sources i.e from battery and generator. The power flow path is shown in Figure 11a &11b.
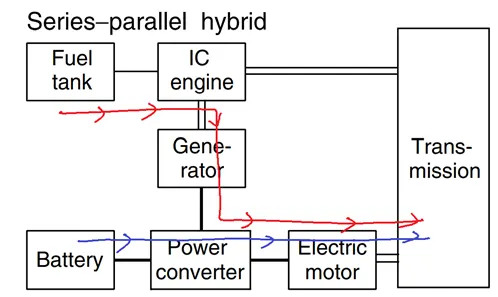
Figure 11A. Power flow path for Mode ii.
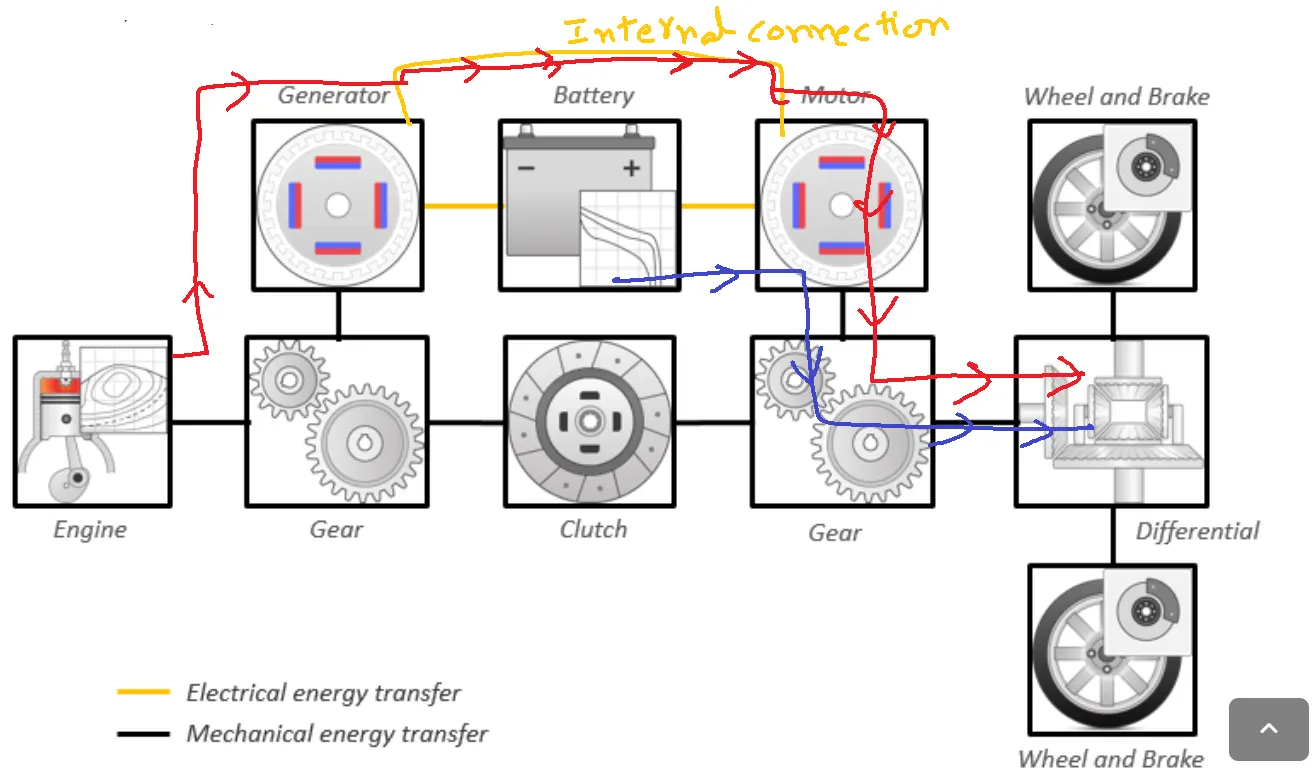
Figure 11B. Power flow path for Mode ii.
Mode iii: From 33.11 Sec to 38Sec: In this case, the vehicle reached the required speed (101 mph) with the help of two energy sources. Now the battery current is oscillating in between 0 to 200A, 150A ,100A and finally settled to Zero which is as shown in figure 9, but the generator torque (or) power is not oscillating. The power flow paths are same as that of figures 11A and 11B.
Mode iv: From 38 Sec to 43Sec: In this case vehicle starts decelerating from the reference speed. The motors speed reduces and finally reached to zero at 43Sec which is shown in figure 9 and in this deceleration period the motor (negative torque) operates as a generator and the power fed back to the battery. This is called Regenerative braking mode of operation. In this case, it is observed in the graphs the IC engine along with generator is in ON State to recharge the battery. Now the current direction of the battery is negative which is shown in figure 9. The power flow paths are shown in figure 12a&12b.
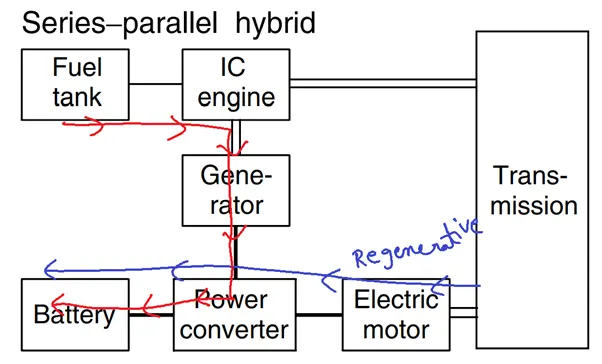
Figure 12a. Power flow path for Mode iv
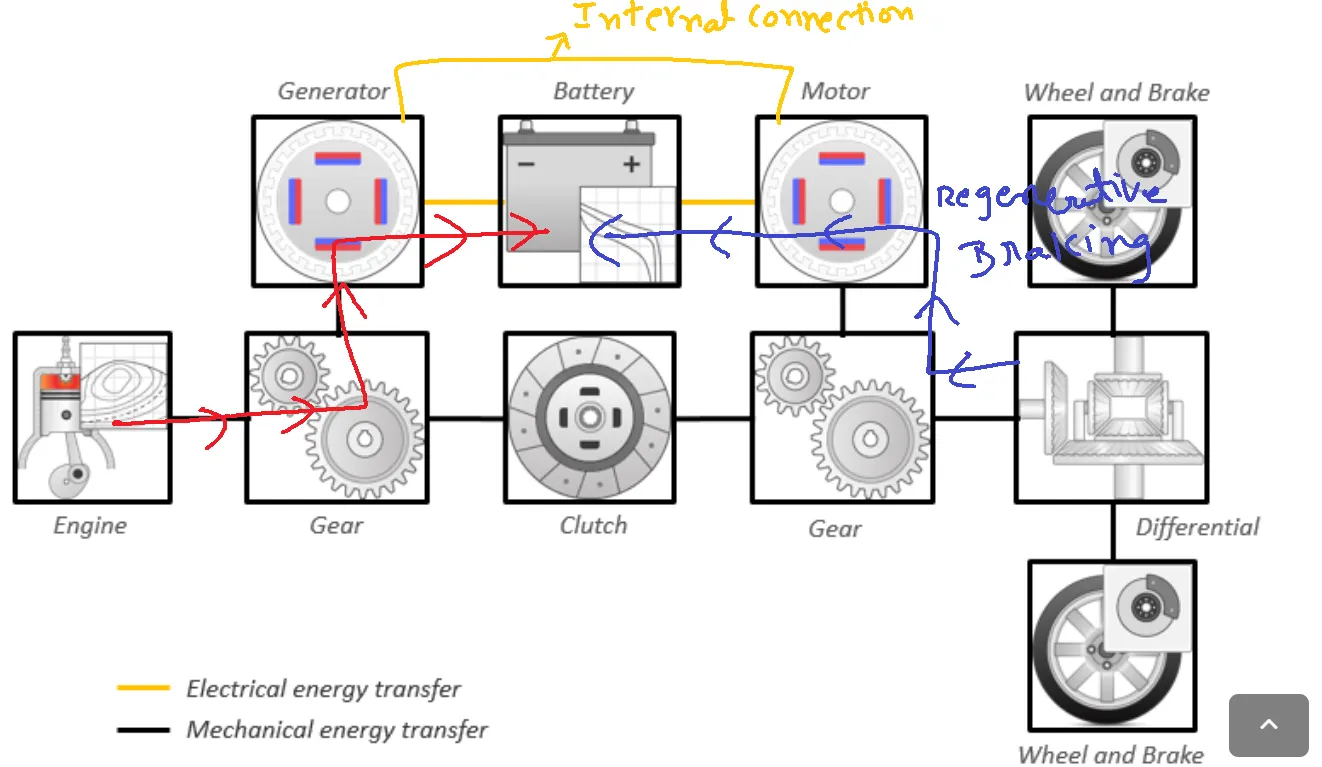
Figure 12b. Power flow path for Mode iv.
Mode V: From 43 Sec to 50 Sec: In this case, motor speed, vehicle speed is completely zero and motor torque is also zero. To charge the battery, the IC Engine is giving mechanical power to generator and this generating power is given to PEC to charge the battery. The generator electromagnetic torque is always negative if it generates the power. Therefore, the battery current in this case also negative which is shown in figure 9. The power flow paths are shown in figure 13a&13b.
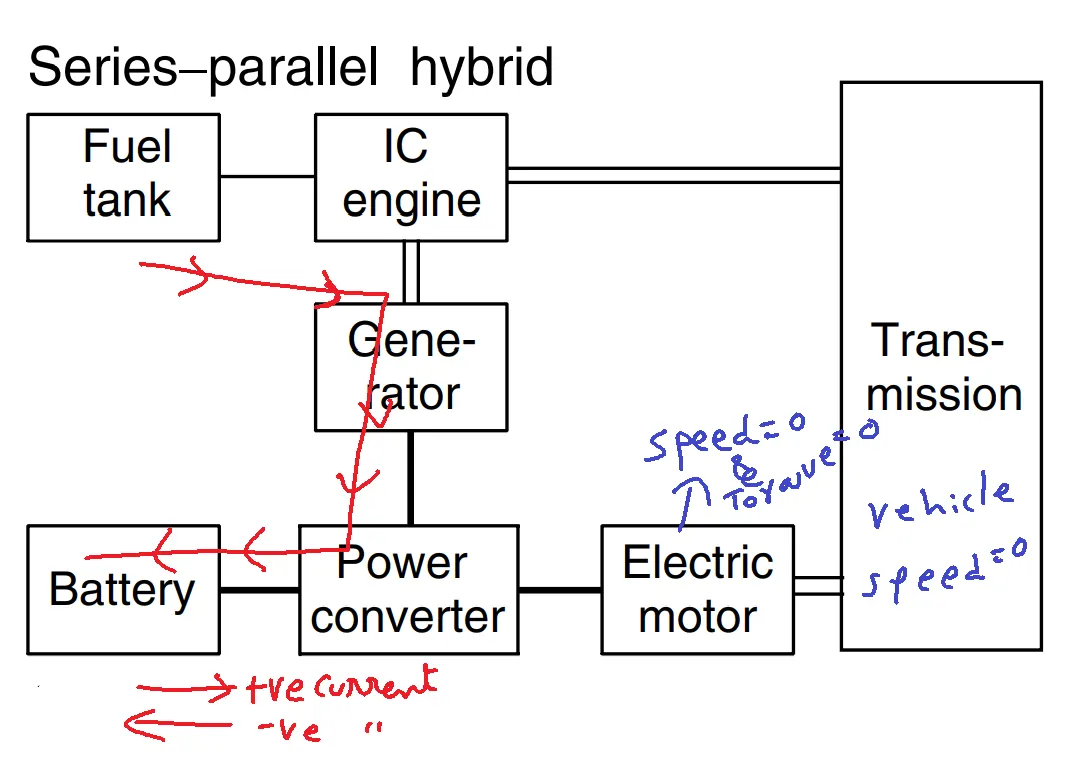
Figure 13a. Power flow path for Mode V.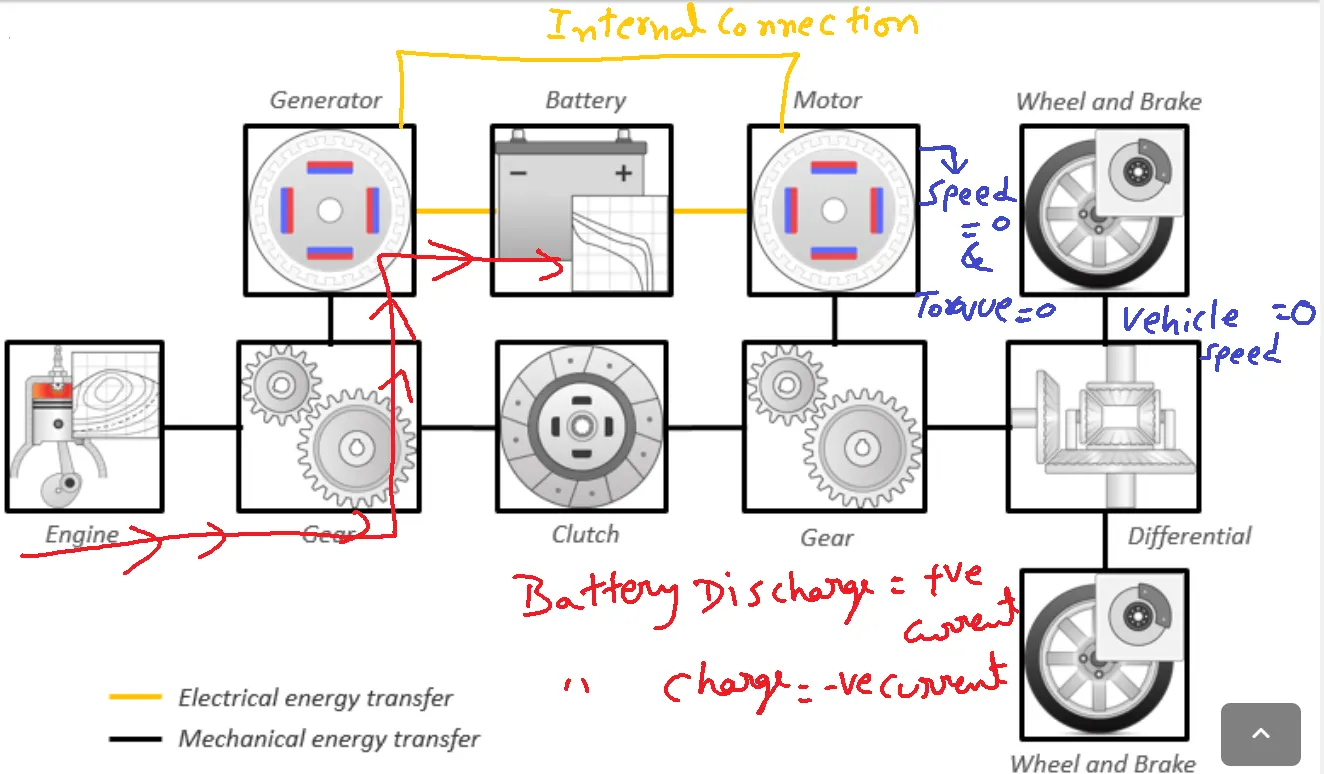
Figure 13b. Power flow path for Mode V.
Case ii: Grade =1 and wind velocity=1
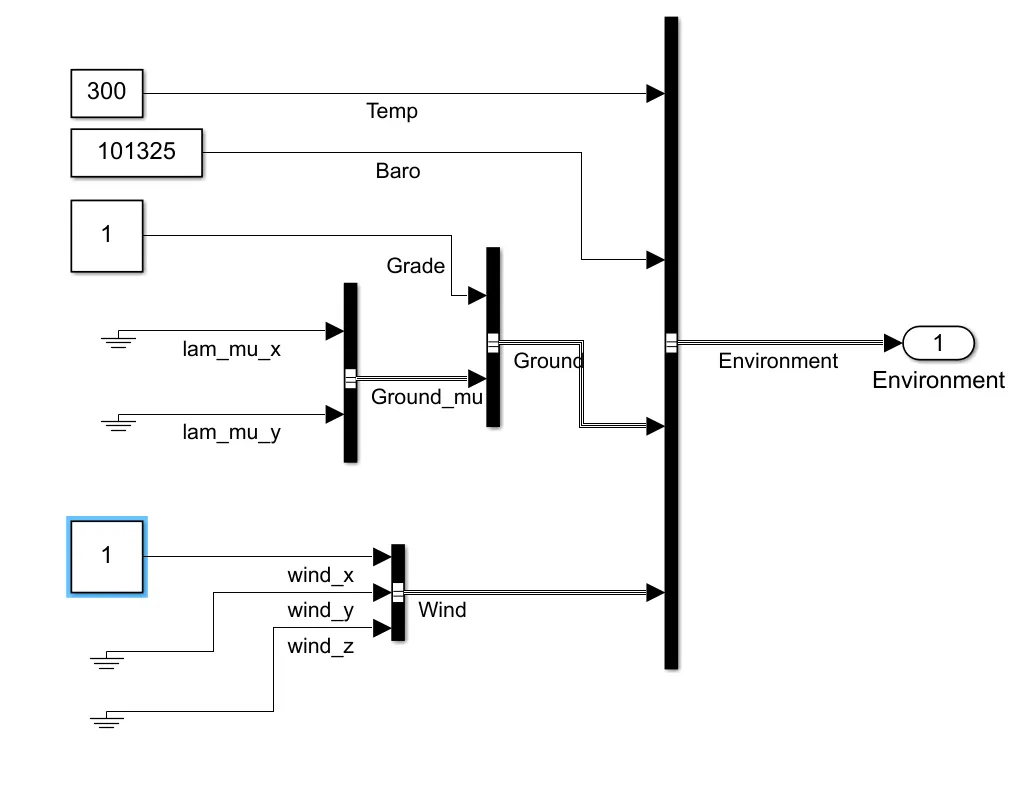
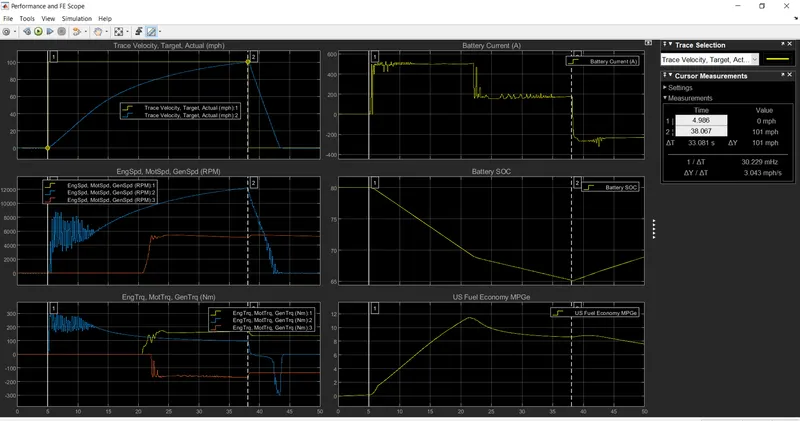
Figure 14. Results of HEV when Grade and wind velocity are 1.
In this case, the total time required to reach maximum speed is 33.081sec. This time is higher than that of the previous case and the remaining parameters i.e battery current, battery SOC and US Fuel economy are same as that of previous case. In case I there is a steady state operation from 33sec to 38sec that’s why battery current has oscillations and slowly settled to zero. Where as in this case, there is no steady state operation hence no oscillations in this time period which is shown in figure14.
Case iii: Grade =10 and wind velocity=1
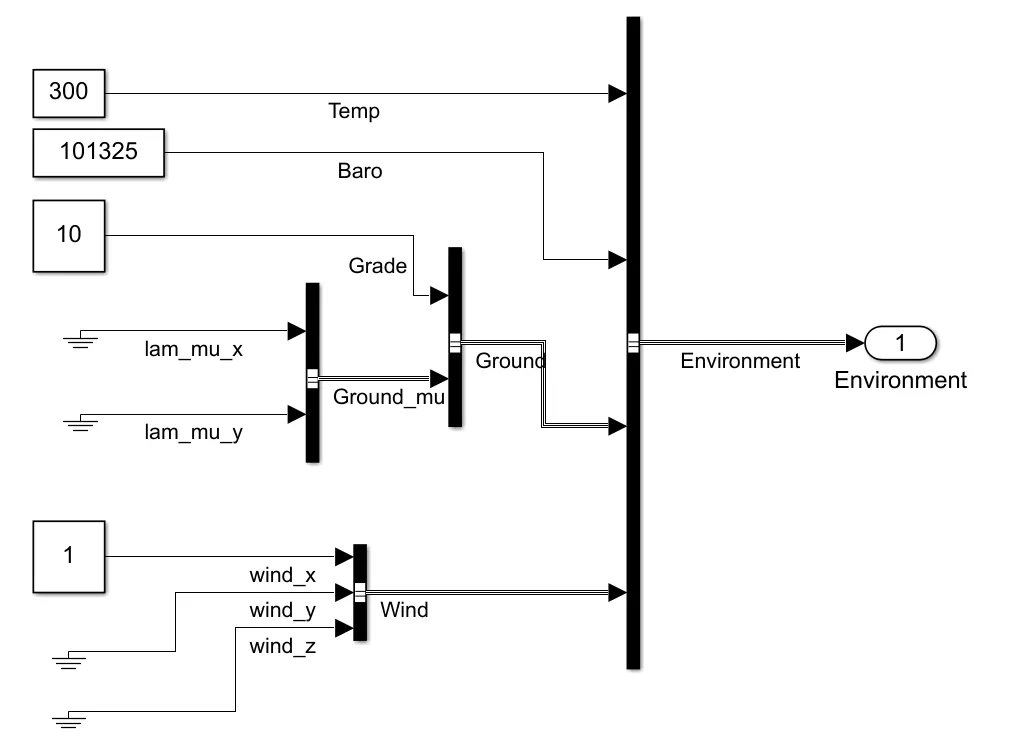
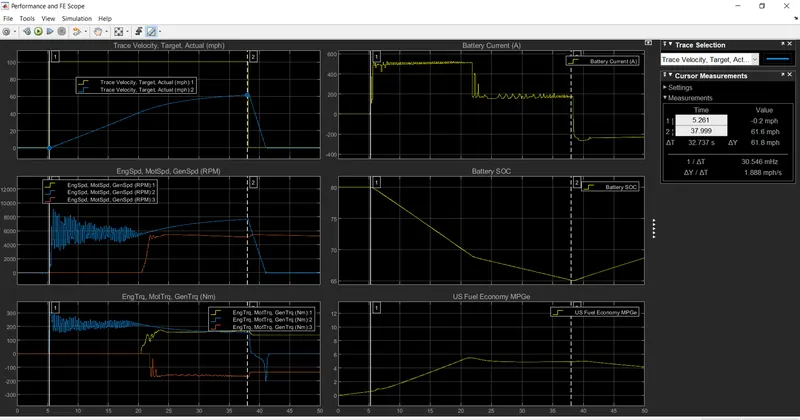
Figure 15. Results of HEV when Grade is 10 and wind velocity are 1.
In this case, the total time required to reach maximum speed is 32.737sec. This time is higher than that of the case i and the remaining parameters i.e battery current, battery SOC are same as that of case i. The motor maximum speed(RPM) is reached 8000 only which is less when compare to case i and case ii. It is observed that the vehicle is not reached 101mph as per the reference speed in drive cycle and the vehicle attains maximum speed in this case is 60mph which is shown in figure 15. This because of high grade i.e is 10. The US Fuel Economy MPG maximum value is 6 which is lesser when compare to case I and case ii. In case I, there is a steady state operation from 33sec to 38sec that’s why battery current has oscillations and slowly settled to zero. Where as in this case, there is no steady state operation hence no oscillations in this time period.
Case iv: Grade =1 and wind velocity=10
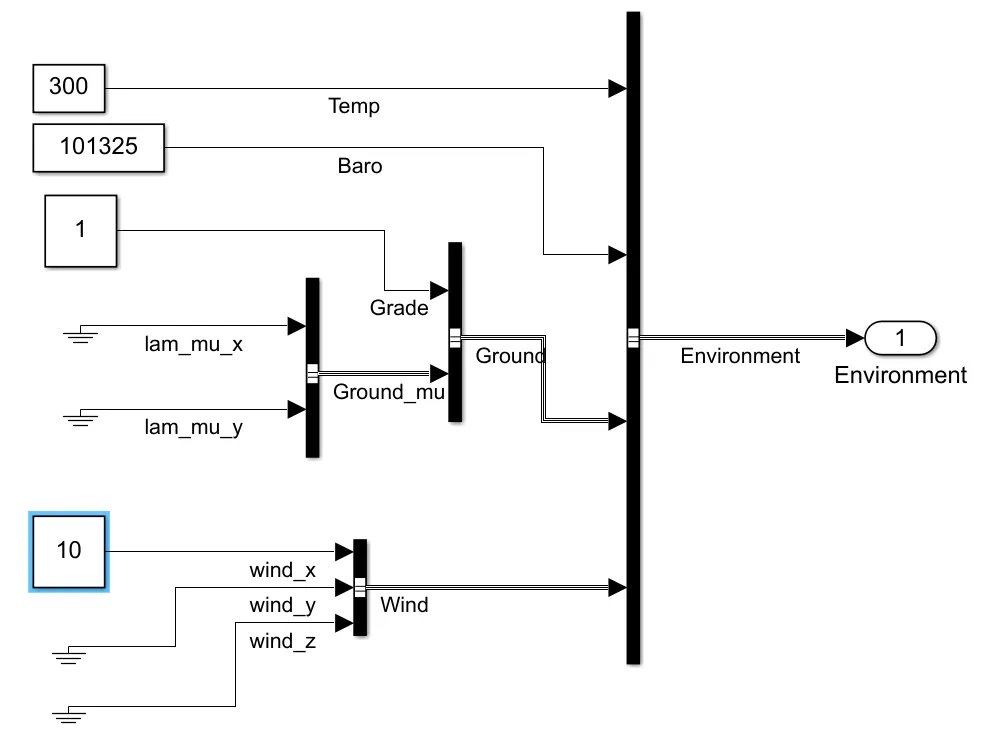
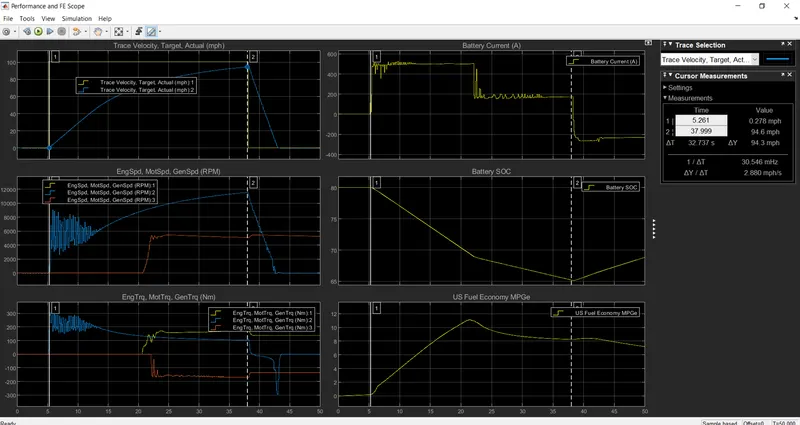
Figure 16. Results of HEV when Grade is 1 and wind velocity are 10.
In this case, the total time required to reach maximum speed is 32.737sec. This time is higher than that of the case i and the remaining parameters i.e battery current, battery SOC, motor rpm and generator torque are same as that of case i. It is observed that the vehicle is not reached 101mph as per the reference speed in drive cycle and the vehicle attains maximum speed in this case is 95mph which is shown in figure 16. This because of high wind velocity i.e is 10. The US Fuel Economy MPG maximum value is 11 which is slightly lesser when compare to case I and case ii but compare to case iii it is higher. In case I there is a steady state operation from 33sec to 38sec that’s why battery current has oscillations and slowly settled to zero. Where as in this case, there is no steady state operation hence no oscillations in this time period.
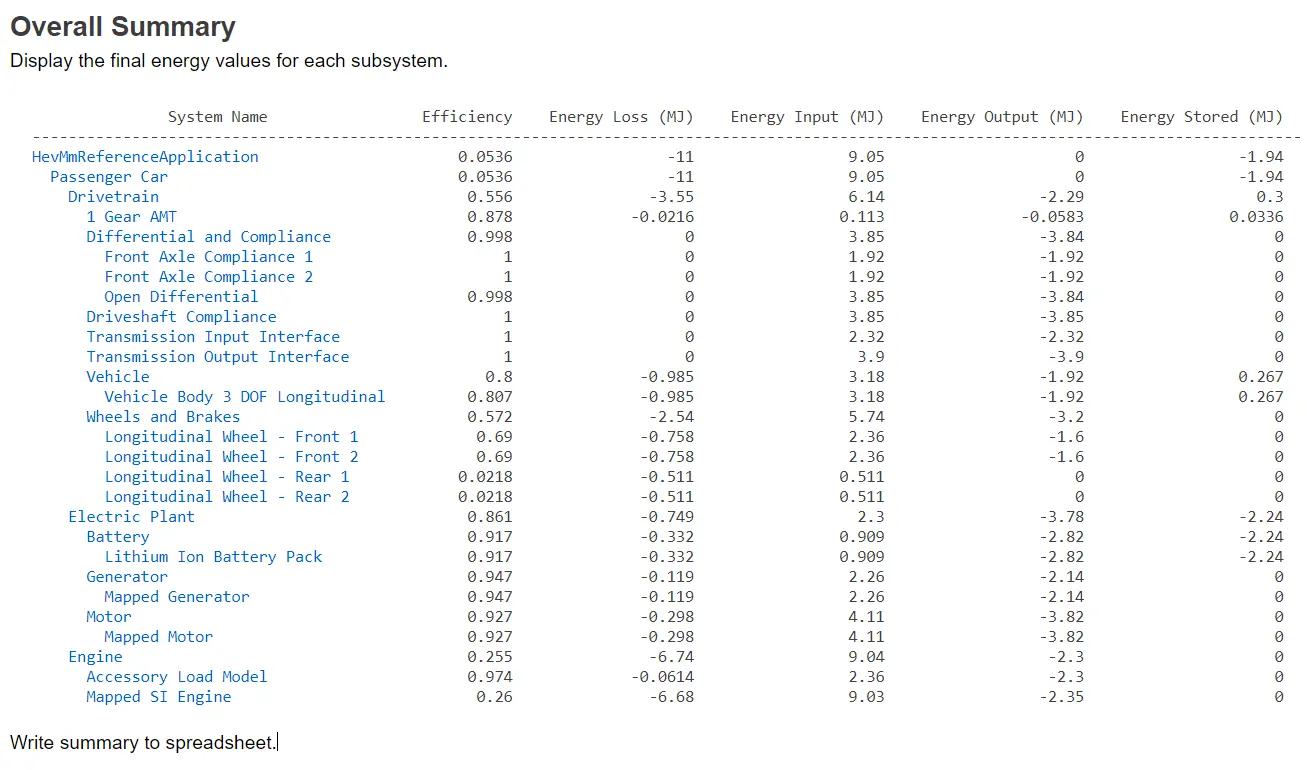
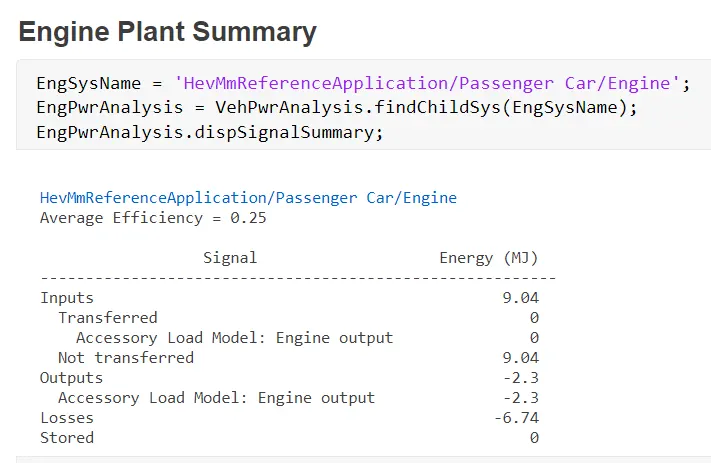
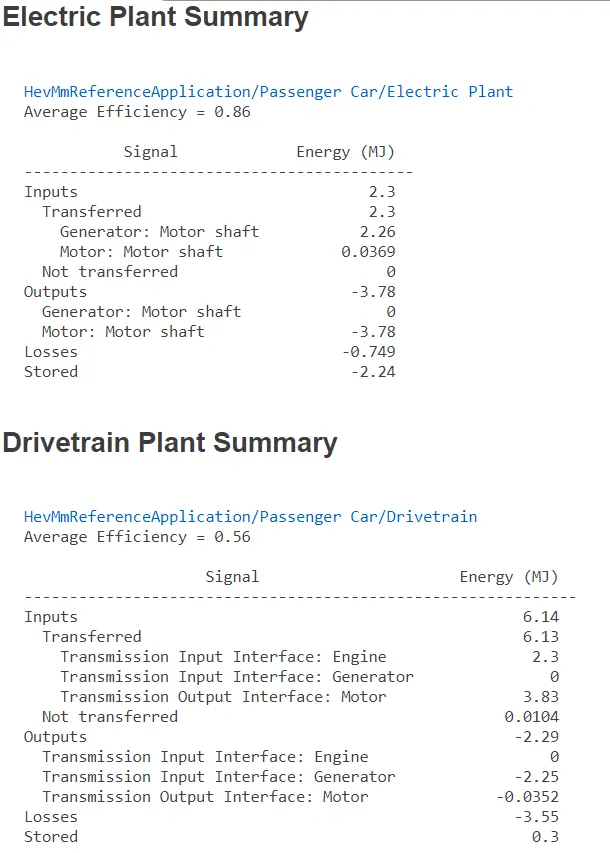
Live script energy summary of HEV for G=0 AND WV=0:
Q.NO 4 Keeping all parameters same, compare the simulation results of hybrid and pure electric trains.
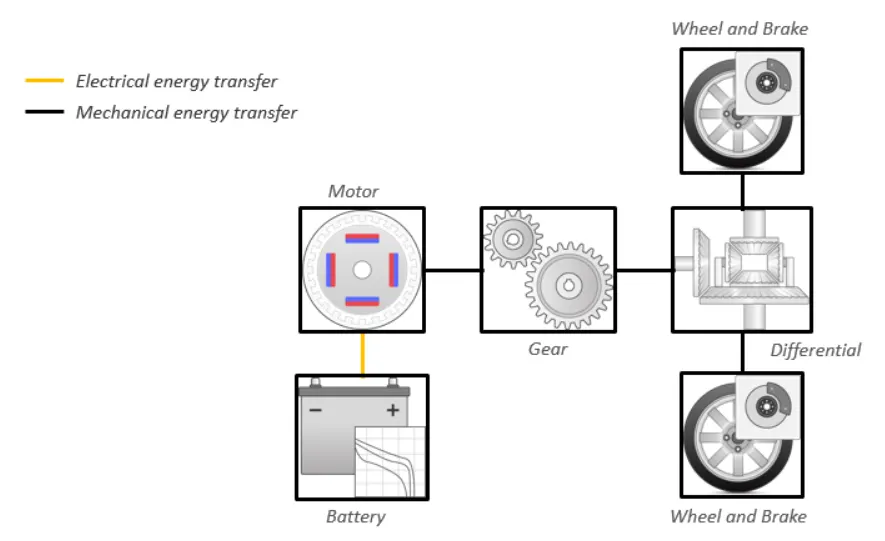
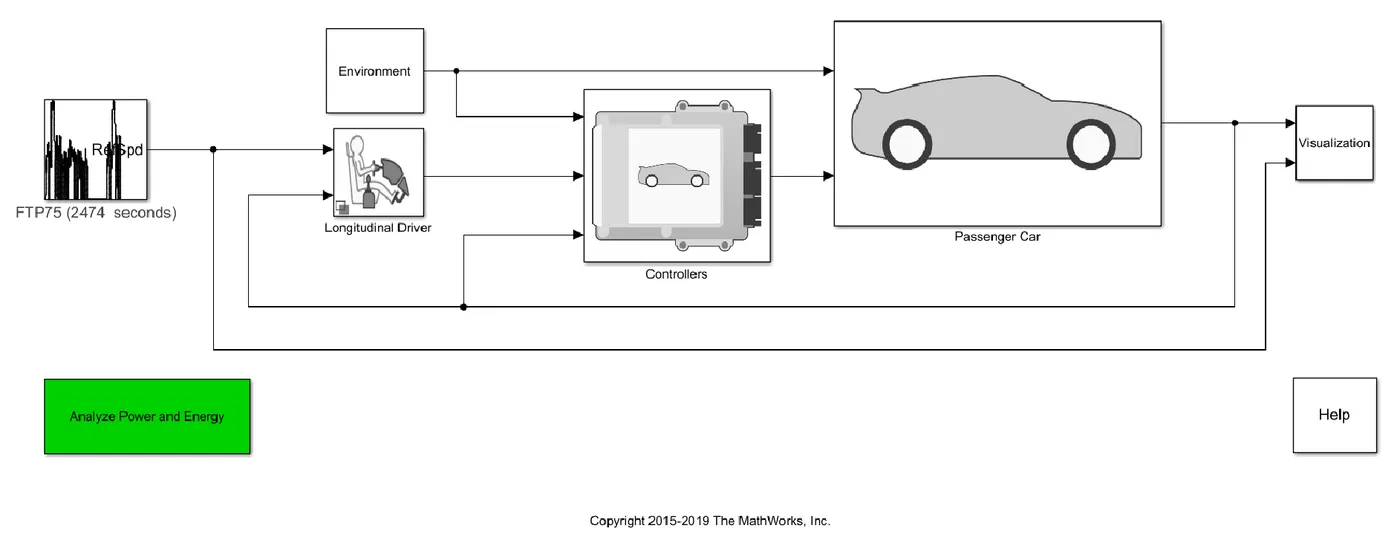
Figure 17. Pure Electric Vehicle.
In this vehicle there in no generator and engine. The battery acts as major source to deliver the power to the motor. Therefore, cost and size of the vehicle is reduced but the efficiency of the vehicle is higher compare to HEV.
Case i: Grade =0 and wind velocity=0
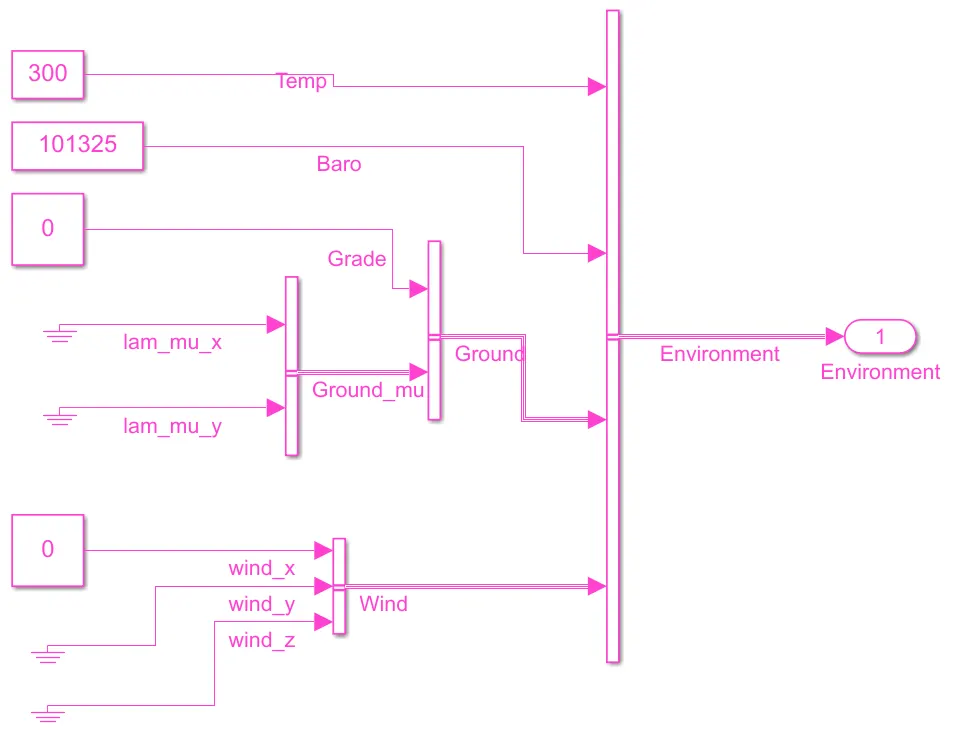
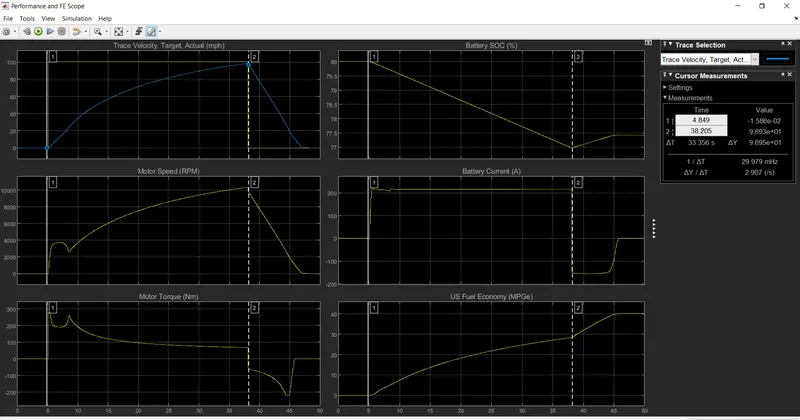
Figure 18. Result of EV for Case i.
Mode 1 (5sec to 38sec): In this mode of operation battery will give power to the motor and the vehicle reaches to 96.5 mph due to acceleration but the maximum speed as per the drive cycle is 101mph. To reach maximul speed vehicle takes nearly 33.3sec but where as in case of HEV it takes only 28sec due to additional engine. It is observed that battery SOC starts reducing and battery current of 200A is maintained constant which is shown in figure 18. The motor speed is above 10000 RPM at 38 sec. The power flow path is as shown in figure 19.
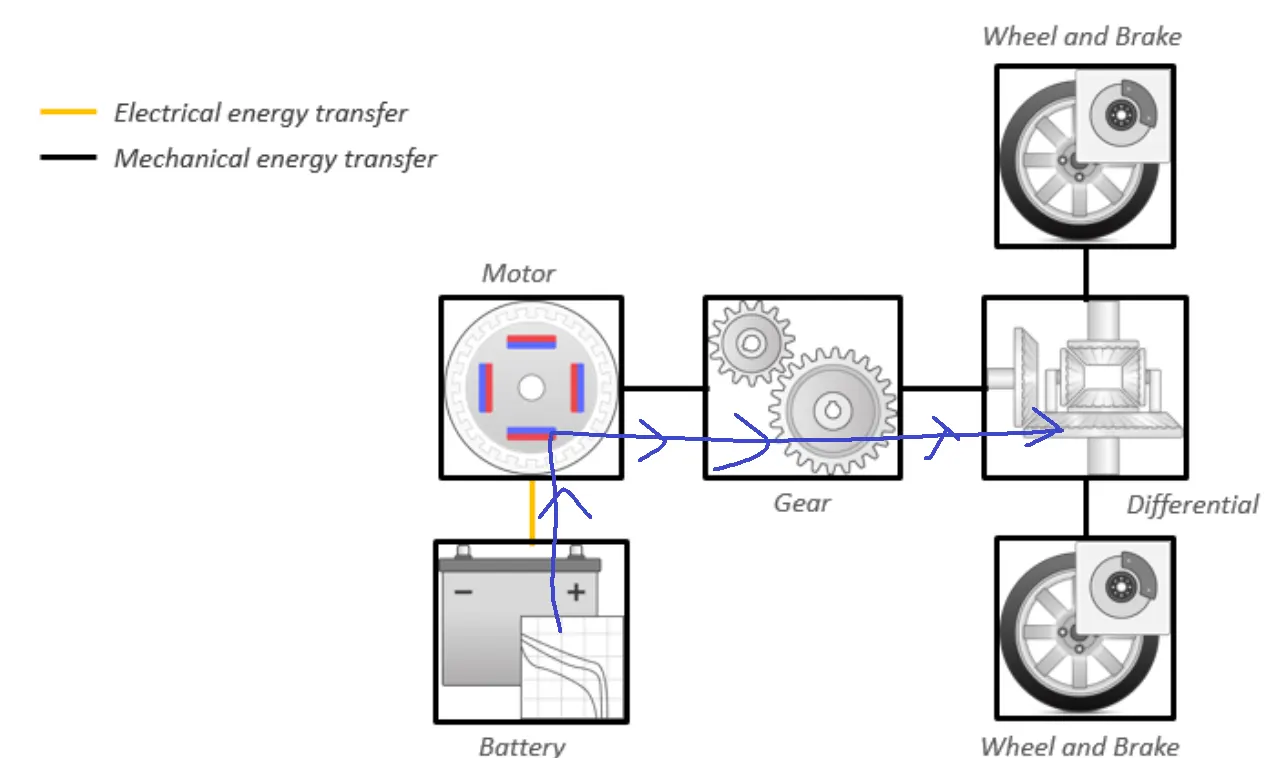
Figure 19 Power flow path for mode 1 operation.
Mode 2 (38sec to 47sec): In this mode of operation vehicle starts deceleration, at 47sec the vehicle speed reaches to zero. This mode is also called as Regenerative braking mode. During deceleration period the motor acts as generator and produces negative torque followed by negative power. Hence in this period battery will be charging mode in the reverse direction and the value of charging current is approximately 160A. It is observed that SOC is increasing due to battery charging operation and reaches a value of 77.5 which is shown in figure 18. The power flow path is as shown in figure 20. The US Fuel Economy (MPG) is increasing as shown in figure18.
Mode 3 (47 Sec to 50Sec): At 47sec the vehicle, motor speed reaches to zero speed and no motor torque and. In this mode, there is no charging and no discharging of the battery hence the battery current is reached to zero which is shown in figure 18. But, the battery SOC is maintained as constant and the value is near to 77.5. The US Fuel Economy (MPG) is also constant as shown in figure18.
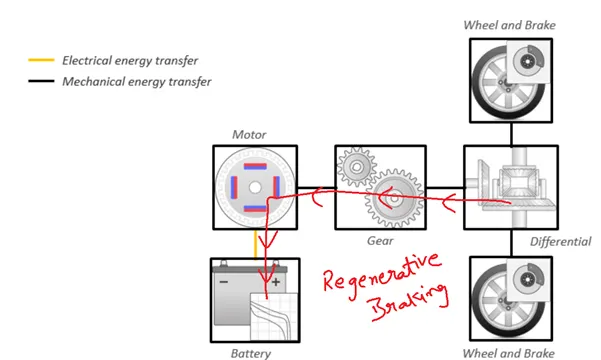
Figure 20. Power flow path in mode 2.
Case ii: Grade =1 and wind velocity=1
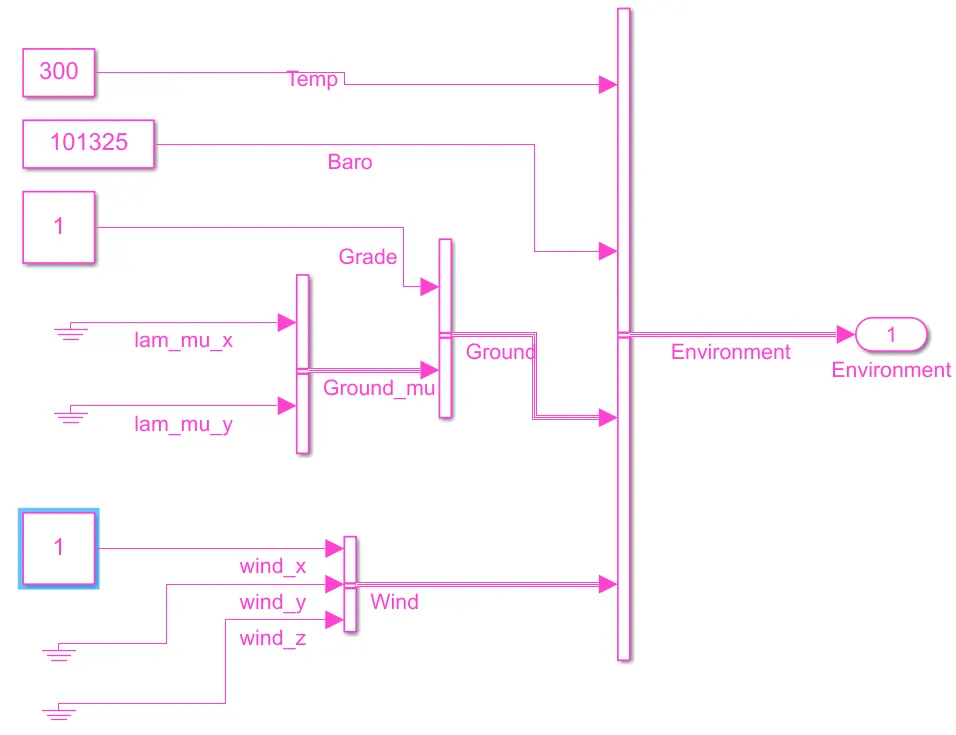
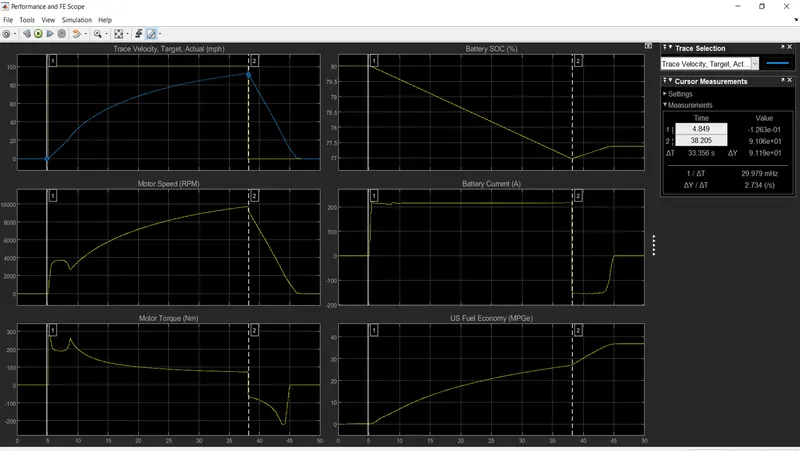
Figure 21. Result of EV for Case ii.
In this case, the vehicle speed is reached to 91.1mph which is lesser when compare to case i. The motor speed is also reduced to 9000 which is also lesser compare to the previous case. The rest of the parameters variation is almost same as that of the previous case.
Case iii: Grade =10 and wind velocity=1
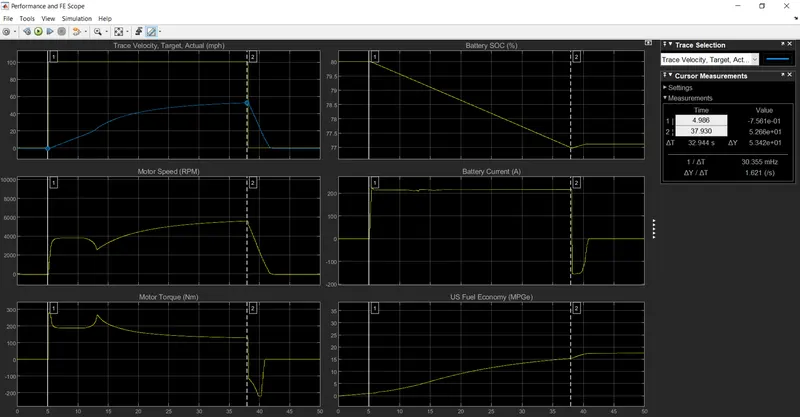
Figure 22. Result of EV for Case iii.
In this case, the vehicle speed is reached to 53.2mph which is lesser when compare to case i. The motor speed is also reduced to 5800 which is also lesser compare to the previous case. The vehicle speed reduces to zero at 43sec only. The US Fuel Economy (MPGe) is reduce to below 20. The battery SOC is less than that of the previous case and the value 77.1.
Case iv: Grade =1 and wind velocity=10
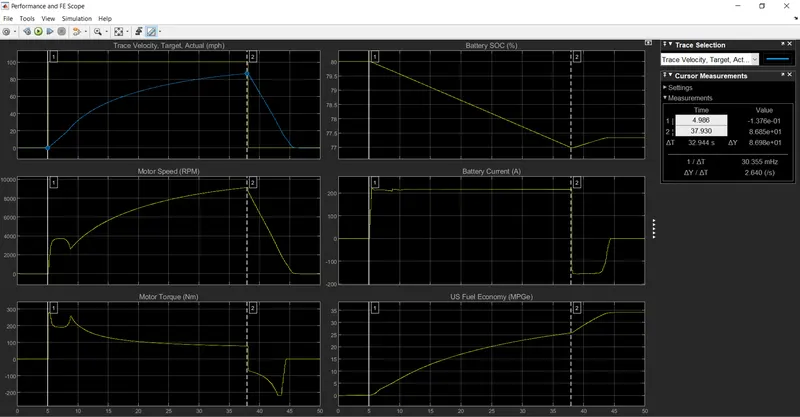
Figure 22. Result of EV for Case iv.
In this case, the vehicle speed is reached to 86.9mph which is lesser when compared to case i. The motor speed is also reduced to 9500 which is also lesser compared to the previous case. The vehicle speed reduces to zero at 46sec only. The US Fuel Economy (MPGe) is reduced to below 40 which is lesser compared to case i. The battery SOC is more than that of the previous case and the value 77.4.
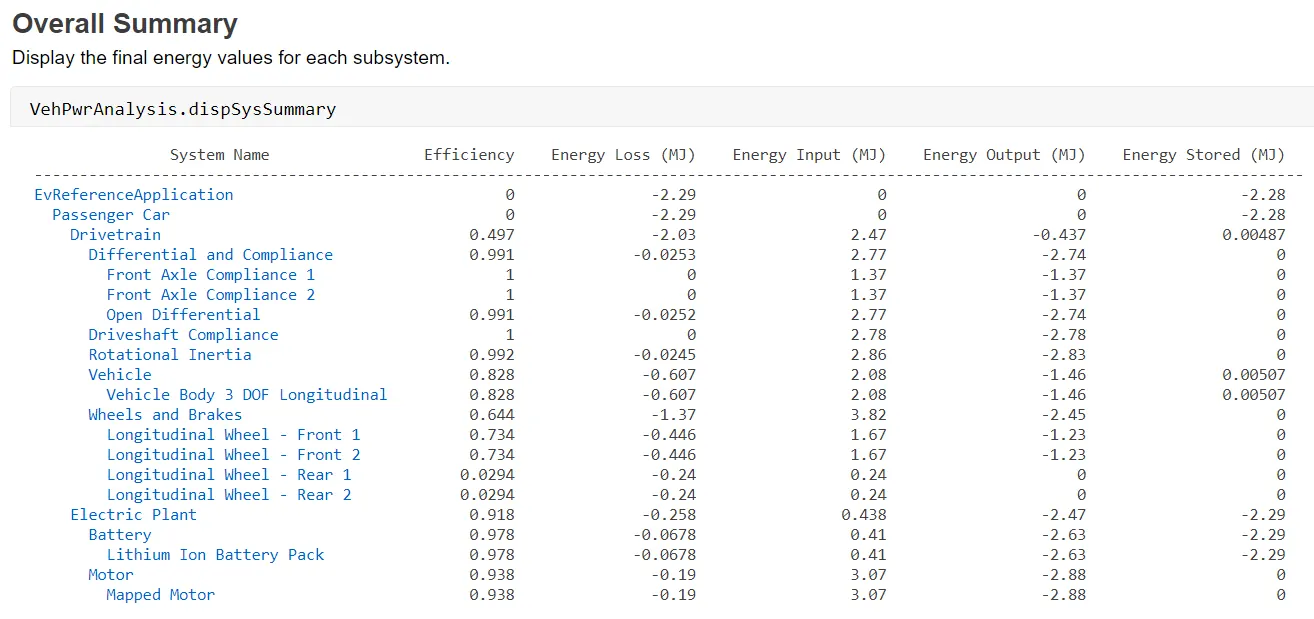
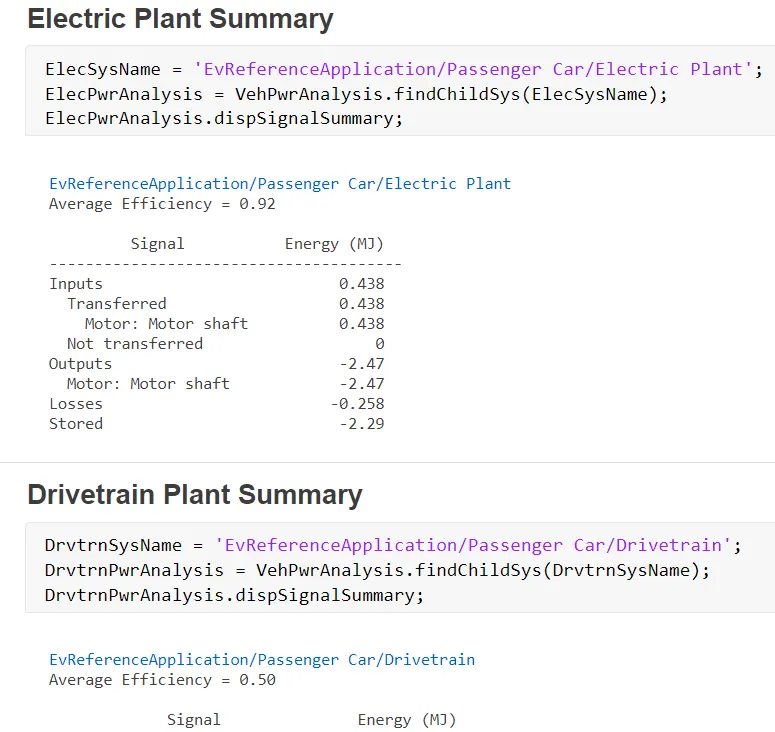
Live script energy summary of Pure EV For G=0 and WV=0:
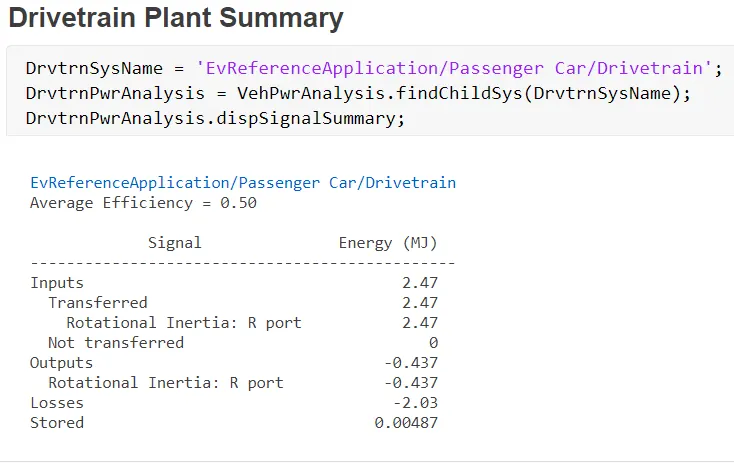
Comarision of HEV and EV from simulation results:
HEV Case i: G=0 and WV=0 Case ii: G=1 and WV=1 Caseiii: G=10 and WV=1 Case iv: G=1 and WV=10
Vehicle speed(mph)
i.5sec to 22.5sec 0 to 85 0 to 80 0 to 50 0 to 80
ii.22.5sec to 33.11sec 85 to 101 80 to 90 50 to 58 80 to 90
iii. 33.11sec to 38sec 101 90 to 101 58 to 60 90 to 94.3
iv. 38sec to 43 sec 101 to 0 101 to 0 60 to 0 94.3 to 0
v. 43sec to 50sec 0 0 0 0
Motor speed, Engine speed and
Generator speed (RPM)
i.5sec to 22.5sec 0 to 10000,0 and 0 0 to 10000,0 and 0 0 to 6000,0 and 0 0 to 9500,0 and 0
ii.22.5sec to 33.11sec 10000 to12000, 5500 and 5500 10000 to11500, 5000 and 5000 6000to 7400, 5000 and 5000 9500 to 11000, 5000 and 5000
iii. 33.11sec to 38sec 12000,5700 and 5700 11500 to 12000, 5000 and 5000 7400 to 7900, 5000 and 5000 11000 to 11500, 5000 and 5000
iv. 38sec to 43 sec 12000 to 0, 5700 and 5700 12000 to 0, 5500 and 5500 7900 to 0, 5500 and 5500 11500 to 0, 5500 and 5500
v. 43sec to 50sec 0 to 5700, 5700 and 5700 0 to 5700, 5500 and 5500 0,5500 and 5500 0,5500 and 5500
Engine Torque, Generator Torque and
Motor Torque (Nm)
i.5sec to 22.5sec 300 to 120, 0 and 0 300 to 120Nm, 0 and 0 300 to 200,0 and 0 300 to 120Nm, 0 and 0
ii.22.5sec to 33.11sec 120 to 100, 160 and -160 120 to 100Nm, 160 and -160 200 to 160, 160 and -160 120 to 100Nm, 160 and -160
iii. 33.11sec to 38sec 100 to 70(oscillating),140 and -140 100,160 and -160 160,160 and -160 100,160 and -160
iv. 38sec to 43 sec 70 to-300, 140 and -140 70to-300,140 and -140 160 to -200,140 and -140 70to-300,140 and -140
v. 43sec to 50sec 0,140 and -140 0,140 and -140 0,140 and -140 0,140 and -140
Battery Capacity(A)
i.5sec to 22.5sec 500 500 500 500
ii.22.5sec to 33.11sec 190 190 190 190
iii. 33.11sec to 38sec 190 to 0(oscillating) 190 190 190
iv. 38sec to 43 sec -250 -230 -230 -230
v. 43sec to 50sec -250A -230 -230 -230
Battery SOC
i.5sec to 22.5sec 80 to 68 80 to 68 80 to 68 80 to 68
ii.22.5sec to 33.11sec 68 to 67 68 to 67 68 to 67 68 to 67
iii. 33.11sec to 38sec 67 67 to 65 67 to 65 67 to 65
iv. 38sec to 43 sec 67 to 68 65 to 66 65 to 66 65 to 66
v. 43sec to 50sec 68 to 70 66 to 68 66 to 68 66 to 68
US Fuel Economy MPGe
i.5sec to 22.5sec 5 to 12 5 to 11 1 to 5.5 5 to 11
ii.22.5sec to 33.11sec 12 to 9.5 11 to 9 5.5 to 5 11 to 9
iii. 33.11sec to 38sec 9.5 to 10 9 5.5 to 5 9 to 8
iv. 38sec to 43 sec 10 to 9 9 to 8.5 5 to 4.5 8 to9 and 9 to 8
v. 43sec to 50sec 9 to 8.5 8.5 to 7.5 4.5 to 4 8 to 7
EV Case i: G=0 and WV=0 Case ii: G=1 and WV=1 Caseiii: G=10 and WV=1 Case iv: G=1 and WV=10
Vehicle speed(mph)
i. 5sec to 38sec 0 to 96.5 0 to 91.19 0 to 53.4 0 to 86.9
ii. 38sec to 47sec 96.5 to 0 91.19 to 0 53.4 to 0 86.9 to 0
iii. 47sec to 50sec 0 0 0 0
Motor speed(RPM)
i. 5sec to 38sec 0 to 10,500 0 to 9500 0 to 5700 0 to 9000
ii. 38sec to 47sec 10,500 to 0 9500 to 0 5700 to 0 9000 to 0
iii. 47sec to 50sec 0 0 0 0
Battery Capacity(A)
i. 5sec to 38sec 220 220 220 220
ii. 38sec to 47sec -150 -150 (38 to 45sec) and 0 (From 45sec) -150(38 to 40sec) and 0 (From 40sec) -150 (38 to 42sec) and 0 (From 42sec)
iii. 47sec to 50sec 0 0 0 0
Battery SOC
i. 5sec to 38sec 80 to 77 80 to 77 80 to 77 80 to 77
ii. 38sec to 47sec 77 to 77.4 77 to 77.4 77 to 77.1 77 to 77.3
iii. 47sec to 50sec 77.4 77.4 77.1 77.3
US Fuel Economy MPGe
i. 5sec to 38sec 0 to 28 0 to 27 0 to 15 0 to 25
ii. 38sec to 47sec 28 to 40 28 to 36 15to17 25 to 33
iii. 47sec to 50sec 40 36 17 33
Here G=Grade and WV= Wind velocity
Efficiency's of various equipment used in HEV
Engine 25% 24.7% 24.6% 24.6%
generator 94.7% 94.4% 94.4% 94.3%
motor 92.7% 92.8% 92.5% 92.1%
drive train 55.6% 57.7% 69.7% 56.4%
Battery 91.7% 91.8% 91.8% 91.8%
Efficiency's of various equipment used in EV
motor 93.8% 94% 94.1% 94.1%
battery 97.8% 97.8% 97.8% 97.8%
drive train 49.7% 52.8% 70.7% 47.8%
From the above comparision it is understood that motor and battery efficiency in EV is higher than HEV. where as drive train efficiency in EV is lesser compare to HEV.
For HEV additional generator and engine is required where as in case of Pure EV these equipmetns are not required. There fore, cost and size are higher in HEV compare to EV.